13941 E Montgomery Rd · Scottsdale, AZ
Flood risk No data
- FEMA flood zone
- —
- Chance of flooding over 30 yrs
- —
- Est. flood insurance / yr
- —
Fire risk No data
- Est. fire insurance / yr
- —
Heat risk No data
- Hot days now (above threshold)
- —
- Hot days in 30 yrs
- —
Wind risk No data
- Chance of severe wind over 30 yrs
- —
Air-quality risk No data
- Unhealthy air days now
- —
- Unhealthy air days in 30 yrs
- —
Risk factors via First Street. Map © Google.
Why this score? — see what drove the F grade
The composite is a weighted blend of 9 inputs, each scored 0–100. Each bar is that input's sub-score; the figure is the points it added to the 100-point composite (weight × sub-score).
- ARV discount +13.3/15.0
- Schools +5.4/10.0
- Livability +4.0/5.0
- Cash flow +3.4/30.0
- Rent growth +2.5/5.0
- Condition / age +2.5/5.0
- 1% rule +0.0/10.0
- DSCR +0.0/10.0
- Appreciation +0.0/10.0
$1,200,000
🖨 Deal sheet (PDF) 📄 Offer letter ✓ Due diligence
Listing remarks MLS
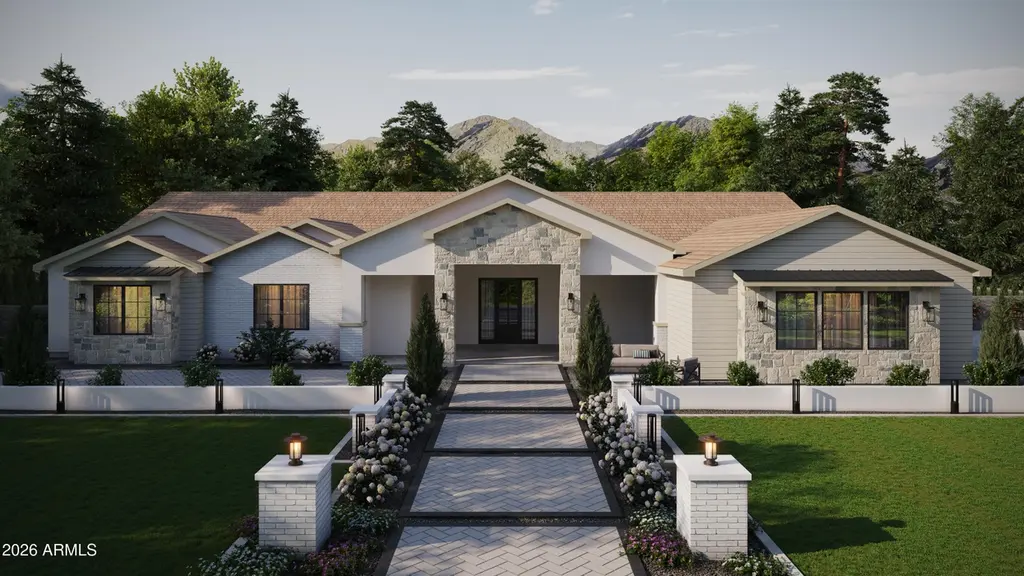
Discover the 4034 floor plan & all it has to offer in this pre-designed custom home. The kitchen boasts luxurious finishes, such as, stainless steel WOLF appliances, upgraded 42'' upper cabinets w/ crown molding, ample countertop space & a large center island. The adjacent informal dining area provides a comfortable & convenient space. The great room is filled with natural light, CUSTOM Fireplace Accent Wall & a sliding glass door lets in even more. The homes boasts plenty of room for everyone w/ a guest living area w/ separate entry & a bonus/game room. The spa-like primary bathroom includes a BEACH ENTRY shower, dual-sink vanity, a soaking tub, & a spacious walk-in closet. Enjoy outdoor living on the covered patio. ESTIMATED completion in July/August.
Key facts
- Large center island
- Guest living area
- 4034 floor plan
Tags
Neighborhood map
What this means for you Summary
Snapshot
- This is a 4-bed/4.0-bath land listed at $1.20M.
Deal economics
- At list price, monthly cash flow is $-4k ($-44k/yr) — negative.
- To cash-flow at today's rent, offer at most $667k (44.4% below list).
- To meet the 1% rule (rent ≥ 1% of price), the offer needs to be $583k (51.4% below list).
- Recommended offer: $583k (51.4% below list) — sets the bar for 1% rule.
Location & tenants
- Location reads 80/100 on livability (#4 in AZ, #1,756 nationally) — a professional / high-income tenant draw. Strengths: amenities A+, commute A+, employment A+; Watch: health & safety C-, cost of living F.
- Cave Creek Unified District (4244) (urban): math 57% / reading 59% proficiency, ranked #13 of 249 in AZ (top 5%) — acceptable for families but not a draw, mixed tenant base, ~2y average lease; only 8% free/reduced lunch — higher-income household profile.
- Zoned schools: Desert Sun Academy (math 52% / reading 57%, grade C, #208 of 1,109 statewide, top 19%, 322 students, 14% FRL); Sonoran Trails Middle School (math 48% / reading 50%, grade C-, #31 of 218 statewide, top 14%, 761 students, 7% FRL); Cactus Shadows High School (math 49% / reading 46%, grade D, #48 of 381 statewide, top 13%, 1,588 students, 6% FRL) — zoned schools at 9% FRL track the district average.
- Market conditions: 598 active listings in the ZIP; 4 comparable units currently listed for rent nearby; rentals at typical pace (median 17d on market — plan ~3-4 weeks tenant-placement turnaround); high-income renter base; 36,011 units permitted in Maricopa County in 2024 (12,801 in 5+ unit buildings).
- This rent runs 39% of the median local income ($178k/yr) — at the standard rent-burdened threshold; future hikes will face affordability resistance.
Forward outlook
- Local home prices are declining (-3.0%/yr); year-one equity from $8k of loan paydown is wiped out by about $36k of value loss. Plan a longer hold.
- Maricopa County population projected at +38% by 2050 — long-run rental-demand tailwind backs the buy-and-hold thesis.
Negotiation context
- It's been on market 88 days — a 6% lower offer ($1.13M) is reasonable based on typical stale-listing flexibility.
Questions for the listing agent
- What do current leases actually rent for vs. the listed asking? Can we see a recent rent roll and the last 12 months of T-12 income?
- It's been on market 88 days. Have you received any prior offers? Is the seller open to a 51% concession, seller financing, or rate buy-down credit?
- Why hasn't it sold? Are there any deal-killer items the seller is aware of (foundation, flood, title, zoning, code violations)?
- Is there a deadline driving the sale (1031 exchange, divorce, estate, relocation)? That informs how much negotiation room exists.
- Schools are A-rated — typically a magnet for longer-tenancy family renters. What's the average tenant stay here, and is there a school-zone premium baked into asking?
- The area grade is low — what's the realistic commute time and amenity access for the typical tenant pool here? Any planned neighborhood developments (good or bad) we should know about?
- What's the average days-on-market for RENTAL listings here right now (not sales)? A rising rental-DOM trend means longer vacancies and softer asking-rent achievability than the comps imply.
- What's the recent tenant-quality profile in this submarket — average credit score on applications, eviction rate, late-payment / NSF rate, and stable-employment percentage? A property-management company in the area should have these aggregated.
- How much new for-sale + rental construction is in the pipeline within 1–3 miles? Heavy new supply typically softens prices + rents 12–24 months out; constrained supply supports both.
Investment metrics
- 1% rule
- 0.49% ✗
- Cap rate
- 2.61%
- Cash-on-cash
- -13.16%
- DSCR
- 0.41
- GRM
- 17.1
CMA / ARV
- ARV (median comp)
- $1,375,992
- List price
- $1,200,000
- Delta
- -12.79%
- Verdict
- UNDERPRICED
- Comps
- 20 within 1.0 mi
Projected returns pro-forma
-3.0% appreciation · 3.0% rent growth · sell at horizon
- IRR
- -40.9%
- Equity multiple
- -0.28×
- Total profit
- $-429,133
- Equity at exit
- $178,924
- IRR
- -67.2%
- Equity multiple
- -1.01×
- Total profit
- $-675,628
- Equity at exit
- $103,754
Cash invested: $336,000 (down + closing). Projections, not guarantees.
Landlord ↔ Tenant lean methodology
- Overall (STATE)
- 87 Strongly Landlord-Friendly
- State Arizona
- 87 Strongly Landlord-Friendly · R+3
- County
- — inherits STATE
- City
- — inherits STATE
ZIP-level market 85262
- Home prices YoY
- -12.2%
- Active inventory
- 598
- Price-to-rent
- 17.1×
Monthly cashflow live
- Estimated rent
- $5,831 medium interval (Pro) →
- Mortgage (P&I)
- −$6,293
- Tax est. 1.5%
- −$1,500 /mo · $18,000/yr
- Insurance
- −$500
- HOA
- −$0
- Vacancy / Maint / Mgmt
- −$1,225
- Net cashflow
- $-3,686
Break-even live
Sensitivity live
| Price | -10% $-2,857 | -5% $-3,271 | +0% $-3,686 | +5% $-4,101 | +10% $-4,515 |
|---|---|---|---|---|---|
| Rent | -10% $-4,147 | -5% $-3,916 | +0% $-3,686 | +5% $-3,456 | +10% $-3,225 |
| Rate | -1.0pp $-3,082 | -0.5pp $-3,381 | base $-3,686 | +0.5pp $-3,997 | +1.0pp $-4,313 |
UW: 25.0% down · 7.5% · 30yr · 1.5% tax · 5.0% vac · 8.0% maint · 8.0% mgmt
Financing live
Cash to close
- Down payment
- $300,000
- Closing costs
- $36,000
- Reserves months
- —
- Total cash needed
- —
Loan-product check · same deal, 3 products live
Conventional
25% down · 7.5% · 30yr
- Down + closing
- —
- Monthly P&I
- —
- Monthly cashflow
- —
- DSCR
- —
- Eligible?
- —
Personal DTI + credit; lowest rate.
DSCR
20% down · 8.5% · 30yr
- Down + closing
- —
- Monthly P&I
- —
- Monthly cashflow
- —
- DSCR
- —
- Eligible?
- —
No personal income docs; deal must DSCR.
Hard money
10% down · 12.0% · 12mo
- Down + closing
- —
- Monthly P&I
- —
- Monthly cashflow
- —
- DSCR
- —
- Eligible?
- —
Short-term bridge; refi at stabilization.
Rent comps 4 comps
| Address | Beds | Baths | Sqft | Rent | $/sqft | DOM | Units | Dist |
|---|---|---|---|---|---|---|---|---|
| 14006 E Mark Ln Scottsdale, AZ | 4.0 | 3.5 | 3072 | $5,125 | $1.67 | 9d | 1 | 1.33mi |
| 14006 E Mark Ln Scottsdale, AZ | 4.0 | 3.5 | 3072 | $5,125 | $1.67 | 1d | 1 | 1.33mi |
| 14214 E Gamble Ln Scottsdale, AZ | 5.0 | 4.0 | 3346 | $20,000 | $5.98 | 45d | 1 | 1.34mi |
| 14010 E Desert Vista Trl Scottsdale, AZ | 4.0 | 3.5 | 3106 | $5,500 | $1.77 | 17d | 1 | 1.39mi |
Listing history 10 events
-
2026-06-10status $1,200,000 Pending 88 DOM
-
2026-06-09days on market $1,200,000 Active 88 DOM
-
2026-06-08days on market $1,200,000 Active 87 DOM
-
2026-06-07days on market $1,200,000 Active 86 DOM
-
2026-06-04days on market $1,200,000 Active 83 DOM
-
2026-06-03days on market $1,200,000 Active 82 DOM
-
2026-06-02days on market $1,200,000 Active 81 DOM
-
2026-06-01days on market $1,200,000 Active 80 DOM
-
2026-05-31days on market $1,200,000 Active 79 DOM
-
2026-03-13$1,200,000 Active 787-char remark
Show marketing remark (787 chars)
Discover the 4034 floor plan & all it has to offer in this pre-designed custom home. The kitchen boasts luxurious finishes, such as, stainless steel WOLF appliances, upgraded 42'' upper cabinets w/ crown molding, ample countertop space & a large center island. The adjacent informal dining area provides a comfortable & convenient space. The great room is filled with natural light, CUSTOM Fireplace Accent Wall & a sliding glass door lets in even more. The homes boasts plenty of room for everyone w/ a guest living area w/ separate entry & a bonus/game room. The spa-like primary bathroom includes a BEACH ENTRY shower, dual-sink vanity, a soaking tub, & a spacious walk-in closet. Enjoy outdoor living on the covered patio. ESTIMATED completion in July/August.
ⓘ Source: listings_history table (triggers on properties + properties_extension) + one-shot
backfill from property_details.listing_events for pre-trigger history.
Nearby sold comps map
Loading sold comps map…
Walkable amenities ~0.75 mi
Loading nearby amenities…
Taxation est. · year 1
- Rental income
- $69,977
- − Mortgage interest
- −$67,219
- − Property taxes
- −$18,000
- − Insurance
- −$6,000
- − Repairs & maintenance
- −$5,598
- − Management
- −$5,598
- − Depreciation
- −$34,909
- Taxable loss
- −$67,347
- Est. tax savings @ 24.0%
- +$16,163
- After-tax cash flow
- $-28,070/yr
For passive investors: Depreciation is non-cash, so a rental often shows a tax loss while cash-flowing — sheltering income. Rental losses are passive: they offset passive income freely, and up to $25,000/yr can offset ordinary (W-2) income if you actively participate and your MAGI is under $100k (phasing out to $0 by $150k); unused losses carry forward. On sale, claimed depreciation is recaptured at up to 25%, and gains may owe capital-gains tax (a 1031 exchange can defer both). Figures are a year-1 estimate at your 24.0% rate — not tax advice; consult a CPA.
Schools (NCES district)
- District
- Cave Creek Unified District (4244)
- NCES district ID
- 0400001
- Math proficiency
- 57% ▼ -9.00%
- Reading proficiency
- 59% ▼ -8.00%
- Median HH income
- $102,788
- Composite
- 54.46/100
- National rank
- #1351
- State rank
- #13 of 249 in AZ
Livability — Scottsdale
- Score
- 80/100
- State rank
- #4
- US rank
- #1756
Category grades
Schools grade is shown separately in the Schools card above.
Census & demographics
- County
- Maricopa County · 4,537,380 people
- City population
- 290,846
- Metro
- Phoenix-Mesa-Chandler, AZ
- Population (ZIP)
- 14,329
- Household income
- $177,790
- Rent vs Own
- Severe rent burden
- 70.0
Population outlook (Maricopa County) Hauer SSP2
- Today (2025)
- 4,979,203 people
- By 2030
- 5,378,229 · +8.0%
- By 2040
- 6,156,598 · +23.6%
- By 2050
- 6,872,376 · +38.0%
- By 2075
- 8,401,270 · +68.7%
- By 2100
- 9,247,439 · +85.7%
Race, ethnicity, and origin ACS 2023
- Neighborhood character
- Predominantly White (89%)
- Race & ethnicity
- White 89% Two or more races 6% Hispanic / Latino 6% Black 1%
- Hispanic origin (detail)
- Mexican 1% Puerto Rican 2%
- Common ancestry
- Romanian 5% Portuguese 4% Lithuanian 3%
- Foreign-born
- 9% · Canada
- Languages at home
- 92% English-only · Spanish 4% Other Indo-European 2% Other Asian/Pacific 1%
Political lean MEDSL · Maricopa
- 2024 margin
- Toss-up / Even · D 47.7% · R 51.2% · Other 1.1%
- 2008→2024 swing
- +7.1pp toward D · 2008: -10.6pp · 2024: -3.5pp
- All cycles
- 2024: R+3.5 2020: D+2.2 2016: R+3.5 2012: R+12.0 2008: R+10.6
Not yet ingested
- Civics
- —
Market trends
- HPI YoY
- ▼ -39.65%
- Current HPI
- 286.3814
- Rent YoY
- —
- Metro
- Phoenix-Mesa-Chandler, AZ
- State GDP YoY
- ▲ 4.54%
- F500 in state
- 20
Industry mix (Fortune 500 HQ in AZ)
| Industry | F500 HQs | Revenue |
|---|---|---|
| Technology | 2 | $13B |
|
||
| Mining / Metals | 1 | $23B |
|
||
| Environmental Services | 1 | $16B |
|
||
| Metals / Steel | 1 | $14B |
|
||
| Technology Distribution | 1 | $9B |
|
||
| Homebuilding | 1 | $8B |
|
||
Price history
1 event — show timeline
- 2026-03-13 Listed $1,200,000 ARMLS
Cash-flow waterfall
monthlySold comps — $/sqft
last 12 mo · ≤1 miLoading sold comps…