 Fourplex
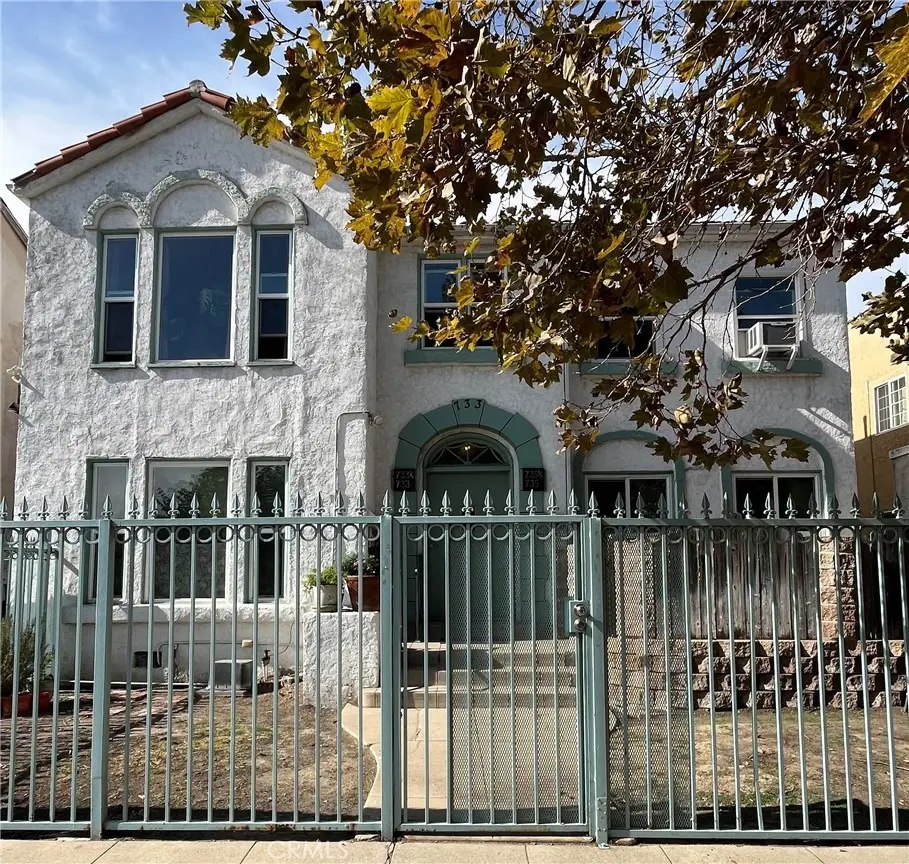
733 N RIDGEWOOD Pl · Los Angeles, CA
Flood risk 3/10 · Minor
- FEMA flood zone
- X (unshaded)
- Chance of flooding over 30 yrs
- 0.2%
- Est. flood insurance / yr
- $507 – $1,088
Fire risk 1/10 · Minimal
- Est. fire insurance / yr
- $659 – $1,223
Heat risk 6/10 · Moderate
- Hot days now (above 90°F)
- 7 days/yr
- Hot days in 30 yrs
- 21 days/yr
Wind risk 1/10 · Minimal
- Chance of severe wind over 30 yrs
- —
Air-quality risk 5/10 · Moderate
- Unhealthy air days now
- 8 days/yr
- Unhealthy air days in 30 yrs
- 8 days/yr
Risk factors via First Street. Map © Google.
Why this score? — see what drove the B grade
The composite is a weighted blend of 9 inputs, each scored 0–100. Each bar is that input's sub-score; the figure is the points it added to the 100-point composite (weight × sub-score).
- Cash flow +28.4/30.0
- ARV discount +13.4/15.0
- DSCR +10.0/10.0
- 1% rule +7.0/10.0
- Schools +3.6/10.0
- Livability +3.4/5.0
- Rent growth +2.7/5.0
- Condition / age +2.5/5.0
- Appreciation +0.0/10.0
$1,495,000
🖨 Deal sheet 📄 Offer letter ✓ Due diligence
Multi-family units
County records classify this as Multi-Family (2-4 Unit). Listing-text estimate: 4 units. confirmed
Listing remarks
Nestled in the heart of Historic Hollywood, this classic four-unit property embodies timeless Old-World Charm with a spacious layout and it's original character. This 4-plex offers comfort, convenience and a great investment potential in one of Los Angeles most desirable and sought-after neighborhoods. Prime Hollywood Location near Paramount Studios and Melrose Avenue. Each Unit has a spacious layout and its own private in-unit laundry room. On-site parking for tenant and owner convenience. Excellent opportunity for owner-user Close to shopping, dining, entertainment and major studios. High Demand area with strong long term investment potential for the savvy investor.
Key facts
- 6,731 sq ft lot
- 5 garage spots
- Built 1924
Property features AI
Finance
- Other: Rent control applies; Tenant pays gas, trash, and electricity; Property contains separate meters (5 electric, 4 gas, 1 water)
- Financial info: Net operating income reported at $61,678; Gross income and gross scheduled income reported at $84,411; Total actual rent currently $4,735.98; Operating/maintenance/insurance/water-sewer expenses reported (operating expenses noted); Some units generate individual rents (examples: $1,339; $1,392; $2,060.98)
- HOA & community: Community type: Urban; Zoning: LARD1.5
Exterior
- Parking: Total of 5 parking spaces; Driveway (concrete); Each unit has an assigned garage space (1 per unit)
- Utilities: Standard electric service; Public sewer; District/public water
- Home design: Multi-unit property (4 units); Two stories; Front entry; Has a view; Urban location
- Construction: Stucco construction; Membrane roof; Spanish tile roof; Built per public records (year built source: public records)
- Exterior features: Wrought iron fencing; Front yard; Lawn; Near public transit; No pool
Interior
- Kitchen: Refrigerator; Gas oven; Microwave; Dishwasher; Water heater unit
- Bedrooms: Some units include walk-in closets
- Flooring: Tile; Wood
- Bathrooms: Multiple one-bath units (each unit listed has 1 full bath)
- Heating & cooling: Floor furnace heating; Wall heater; Wall/window cooling units
- Interior features: Balcony; Living room balcony; High ceilings (9 feet+); Ceiling fan; Tile counters; Granite counters; Service entrance; Unfurnished; Low emissivity windows
- Laundry & utility: Washer hookup; Gas dryer hookup; Dedicated laundry room
Neighborhood map
What this means for you Summary
Snapshot
- This is a 4 × 6-bed/4.0-bath units multifamily listed at $1.50M.
Deal economics
- At list price, monthly cash flow is $5k ($58k/yr) — positive. Per door: $1k/mo.
- The deal already cash-flows at list — no discount required.
- Meets the 1% rule at list price ($18k rent vs $1.50M).
- Recommended offer: $1.45M (3.0% below list) — sets the bar for market timing.
- Cap rate 10.2% vs local median 2.1% in Los Angeles — top-decile yield for the area; either an underpriced asset or a hidden risk that comps aren't pricing in. Stress-test before assuming the spread holds.
Location & tenants
- Location reads 68/100 on livability (#273 in CA) — a middle-class / working-renter tenant base. Strengths: amenities A+, commute A+, employment B; Watch: health & safety C-, schools D+, crime F.
- Los Angeles Unified (urban): math 29% / reading 54% proficiency, ranked #223 of 517 in CA (top 43%) — families likely to look elsewhere, expect single-tenant / working-renter base with shorter leases; 67% free/reduced lunch — lower-income household profile, screen leases tightly.
- Market conditions: Rents flat; 87 active listings in the ZIP; 3 comparable units currently listed for rent nearby; rentals lingering (median 44d on market — plan ~5-8 weeks vacancy on turnover, expect pricing pressure); 67% of comp listings sitting > 30 days — soft ceiling on asking rent; 19,697 units permitted in Los Angeles County in 2024 (9,426 in 5+ unit buildings).
- At $17,957/mo this rent would consume 351% of the median local household income ($61k/yr) (locally 4038% of renters already pay >50% of income on rent) — very limited rent-growth headroom before tenants either downsize or default.
Forward outlook
- Local home prices are declining (-3.0%/yr); year-one equity from $10k of loan paydown is wiped out by about $45k of value loss. Plan a longer hold.
- Los Angeles County population projected at +9% by 2050 — modest demand growth; plan on rents tracking national, not racing it.
Negotiation context
- It's been on market 49 days — a 3% lower offer ($1.45M) is reasonable based on typical stale-listing flexibility.
- 14 sale attempts since 28y ago with the ask held roughly flat each time — persistent listings suggest the price (not the market) is what's stuck; bring a comps-based counter.
- Current owner paid $288k; list at $1.50M implies a 419% gain — meaningful room to come down on a strong offer.
Risks & watch-outs
- Watch-outs: built in 1924 — expect roof / HVAC / electrical / plumbing capex.
- Climate carrying-cost: extreme-heat days projected 7→21/yr by 2055 (HVAC capex compounding) — expect insurance premiums to compound above CPI over the hold.
Questions for the listing agent
- It's been on market 49 days. Have you received any prior offers? Is the seller open to a 3% concession, seller financing, or rate buy-down credit?
- Can we see the unit-by-unit rent roll, current vacancy, and any below-market leases? What's the average tenancy length?
- What capital expenditures (roof, boiler, parking lot, exteriors) have been made in the last 5 years, and what's planned in the next 2?
- Built in 1924 — when were the roof, HVAC, electrical panel, plumbing, and water heater last replaced?
- Is there a deadline driving the sale (1031 exchange, divorce, estate, relocation)? That informs how much negotiation room exists.
- Schools are D-rated, which usually means shorter tenancies and higher turnover. Who's the typical renter profile here, and what's been the actual vacancy rate?
- Crime grade is F in this area — have there been break-ins, vandalism, or insurance claims at this property in the last 3 years? What carrier currently insures it and at what premium?
- What's the average days-on-market for RENTAL listings here right now (not sales)? A rising rental-DOM trend means longer vacancies and softer asking-rent achievability than the comps imply.
- What's the recent tenant-quality profile in this submarket — average credit score on applications, eviction rate, late-payment / NSF rate, and stable-employment percentage? A property-management company in the area should have these aggregated.
- How much new apartment / multifamily construction is in the pipeline within 1–3 miles? Heavy new supply (>2% of stock underway) typically softens rents 12–24 months out; light construction supports rent growth.
Investment metrics
- 1% rule
- 1.20% ✓
- Cap rate
- 10.17%
- Cash-on-cash
- 13.86%
- DSCR
- 1.62
- GRM
- 6.9
CMA / ARV
- ARV (median comp)
- $1,718,757
- List price
- $1,495,000
- Delta
- -13.02%
- Verdict
- UNDERPRICED
- Comps
- 20 within 1.0 mi
Show comp detail 1 sale within ~0.75 mi
| Address | Dist | Beds/Ba | Sqft | Sold | Price | $/sf | Match |
|---|---|---|---|---|---|---|---|
| 206 N Irving Blvd | 0.70mi | 6/4.0 | 4,262 (-12%) | 15mo | $2,725,000 | $639 | 35 |
Match score weights: distance 35% · size 25% · config 20% · recency 20%. Top-matched comps best support the ARV.
Projected returns pro-forma
-3.0% appreciation · 0.67% rent growth · sell at horizon
- IRR
- 1.5%
- Equity multiple
- 1.06×
- Total profit
- $24,101
- Equity at exit
- $222,909
- IRR
- 8.8%
- Equity multiple
- 1.61×
- Total profit
- $254,903
- Equity at exit
- $129,260
Cash invested: $418,600 (down + closing). Projections, not guarantees.
Landlord ↔ Tenant lean methodology
- Overall (CITY)
- 0 Strongly Tenant-Friendly
- State California
- 18 Strongly Tenant-Friendly · D+13
- County
- — inherits STATE
- City Los Angeles
- 0 Strongly Tenant-Friendly · D+22
ZIP-level market 90038
- Rents YoY
- 0.7%
- Active inventory
- 87
- Price-to-rent
- 27.8×
Monthly cashflow live
- Estimated rent
- $17,957 medium interval (Pro) →
- Mortgage (P&I)
- −$7,840
- Tax from tax record
- −$890 /mo · $10,680/yr
- Insurance
- −$623
- HOA
- −$0
- Vacancy / Maint / Mgmt
- −$3,771
- Net cashflow
- $4,833
Break-even live
4-unit breakdown (identical units grouped — click to expand)
| Units | Beds | Baths | Est. rent |
|---|---|---|---|
| 4× units | 6 | 4 | $17,956 |
| #1 | 6 | 4 | $4,489 |
| #2 | 6 | 4 | $4,489 |
| #3 | 6 | 4 | $4,489 |
| #4 | 6 | 4 | $4,489 |
| Total (4 units) | $17,957 | ||
UW: 25.0% down · 7.5% · 30yr · 1.5% tax · 5.0% vac · 8.0% maint · 8.0% mgmt
Financing live
Cash to close
- Down payment
- $373,750
- Closing costs
- $44,850
- Reserves months
- —
- Total cash needed
- —
Loan-product check · same deal, 3 products live
Conventional
25% down · 7.5% · 30yr
- Down + closing
- —
- Monthly P&I
- —
- Monthly cashflow
- —
- DSCR
- —
- Eligible?
- —
Personal DTI + credit; lowest rate.
DSCR
20% down · 8.5% · 30yr
- Down + closing
- —
- Monthly P&I
- —
- Monthly cashflow
- —
- DSCR
- —
- Eligible?
- —
No personal income docs; deal must DSCR.
Hard money
10% down · 12.0% · 12mo
- Down + closing
- —
- Monthly P&I
- —
- Monthly cashflow
- —
- DSCR
- —
- Eligible?
- —
Short-term bridge; refi at stabilization.
Rent comps 3 comps
| Address | Beds | Baths | Sqft | Rent | $/sqft | DOM | Units | Dist |
|---|---|---|---|---|---|---|---|---|
| 401 N McCadden Pl Los Angeles, CA | 6.0 | 5.5 | 5000 | $17,500 | $3.50 | 43d | 1 | 1.37mi |
| 344 S Kingsley Dr Los Angeles, CA | 5.0 | 3.0 | 4224 | $9,998 | $2.37 | 43d | 1 | 1.40mi |
| 1922 Taft Ave Los Angeles, CA | 6.0 | 4.0 | 3600 | $10,250 | $2.85 | 18d | 1 | 1.45mi |
Listing history 46 events
-
2026-06-18days on market $1,495,000 Active 49 DOM
-
2026-06-17days on market $1,495,000 Active 48 DOM
-
2026-06-16days on market $1,495,000 Active 47 DOM
-
2026-06-15days on market $1,495,000 Active 46 DOM
-
2026-06-13days on market $1,495,000 Active 44 DOM
-
2026-06-09days on market $1,495,000 Active 40 DOM
-
2026-06-08days on market $1,495,000 Active 39 DOM
-
2026-06-07days on market $1,495,000 Active 38 DOM
-
2026-06-04days on market $1,495,000 Active 35 DOM
-
2026-06-03days on market $1,495,000 Active 34 DOM
-
2026-06-02days on market $1,495,000 Active 33 DOM
-
2026-06-01days on market $1,495,000 Active 32 DOM
-
2026-05-31days on market $1,495,000 Active 31 DOM
-
2026-04-30$1,495,000 Active 679-char remark
-
2026-04-29historical $1,495,000 679-char remark
-
2020-02-17historical
-
2020-02-06$1,598,000 Active
-
2020-02-05historical
-
2020-01-28status Active
-
2020-01-19historical Hold Do Not Show
-
2020-01-11status Active
-
2020-01-11price $1,549,000
-
2019-12-05historical Active Under Contract
-
2019-11-06$1,498,000 Active
-
2016-03-21historical Hold Do Not Show
-
2016-03-21historical
-
2016-02-26status Active Under Contract
-
2016-02-18historical Hold Do Not Show
-
2016-02-11$1,288,000 Active
-
2016-02-10$1,288,000
-
2013-03-01historical
-
2012-10-23$899,000 Active
-
2011-06-12historical Withdrawn
-
2011-03-28Active
-
2008-03-28historical
-
2007-09-27
-
2002-05-07historical
-
2002-05-01
-
2000-11-14soldstatus $288,000
-
2000-11-14soldstatus $288,000
-
2000-09-18historical
-
2000-06-01$295,000
-
1998-10-01historical
-
1998-04-01
-
1992-05-29soldstatus $270,000
-
1975-11-17soldstatus $55,000
ⓘ Source: listings_history table (triggers on properties + properties_extension) + one-shot
backfill from property_details.listing_events for pre-trigger history.
Tax reassessment forecast CA · Resets to sale price
- Current annual tax
- $10,680 · $890/mo
- Projected year-2 tax
- $11,362 · $947/mo
- Expected delta
- +$682/yr (+$57/mo · 6.4%)
ⓘ Screening estimate from a state-policy table — verify with the county assessor before closing.
Climate risk First Street
- Flood 3/10 Moderate FEMA zone X (unshaded) · 20% chance over 30 yrs
- Wildfire 1/10 Low
- Heat 6/10 Major 7 d/yr ≥90°F today · 21 d/yr by 30 yrs out
- Wind 1/10 Low
- Air quality 5/10 Major 8 unhealthy d/yr today · 8 by 30 yrs out
Nearby sold comps map
Loading sold comps map…
Walkable amenities ~0.75 mi
Loading nearby amenities…
Taxation est. · year 1
- Rental income
- $215,484
- − Mortgage interest
- −$83,743
- − Property taxes
- −$10,680
- − Insurance
- −$7,475
- − Repairs & maintenance
- −$17,239
- − Management
- −$17,239
- − Depreciation
- −$43,491
- Taxable income
- $35,618
- Est. tax owed @ 24.0%
- −$8,548
- After-tax cash flow
- $49,450/yr
For passive investors: Depreciation is non-cash, so a rental often shows a tax loss while cash-flowing — sheltering income. Rental losses are passive: they offset passive income freely, and up to $25,000/yr can offset ordinary (W-2) income if you actively participate and your MAGI is under $100k (phasing out to $0 by $150k); unused losses carry forward. On sale, claimed depreciation is recaptured at up to 25%, and gains may owe capital-gains tax (a 1031 exchange can defer both). Figures are a year-1 estimate at your 24.0% rate — not tax advice; consult a CPA.
Schools (NCES district)
- District
- Los Angeles Unified
- NCES district ID
- 0622710
- Math proficiency
- 29% ▼ -4.00%
- Reading proficiency
- 54% ▲ 10.00%
- Median HH income
- $50,403
- Composite
- 35.67/100
- National rank
- #4875
- State rank
- #223 of 517 in CA
Livability — Los Angeles
- Score
- 68/100
- State rank
- #273
- US rank
- #9237
Category grades
Schools grade is shown separately in the Schools card above.
Census & demographics
- Census place
- Los Angeles, CA
- County
- Los Angeles County · 9,444,647 people
- City population
- 3,838,149
- Metro
- Los Angeles-Long Beach-Anaheim, CA
- Population (ZIP)
- 27,127
- Household income
- $61,454
- Rent vs Own
- Severe rent burden
- 4038.0
Population outlook (Los Angeles County) Hauer SSP2
- Today (2025)
- 10,940,515 people
- By 2030
- 11,256,481 · +2.9%
- By 2040
- 11,729,929 · +7.2%
- By 2050
- 11,948,407 · +9.2%
- By 2075
- 11,818,114 · +8.0%
- By 2100
- 10,842,928 · -0.9%
Race, ethnicity, and origin ACS 2023
- Neighborhood character
- Diverse neighborhood (Simpson 0.66)
- Race & ethnicity
- Hispanic / Latino 49% White 31% Two or more races 15% Asian 7% Black 7% Native American 2%
- Hispanic origin (detail)
- Mexican 21%
- Common ancestry
- Romanian 2% Scotch-Irish 1% Lithuanian 1%
- Foreign-born
- 39% · Canada, South Korea, Jamaica
- Languages at home
- 44% English-only · Spanish 43% Other Indo-European 4% Tagalog/Filipino 2%
Political lean MEDSL · Los Angeles
- 2024 margin
- Solid D (+32.9) · D 64.8% · R 31.9% · Other 3.3%
- 2008→2024 swing
- -7.4pp toward R · 2008: 40.4pp · 2024: 32.9pp
- All cycles
- 2024: D+32.9 2020: D+44.2 2016: D+48.0 2012: D+40.0 2008: D+40.4
Not yet ingested
- Civics
- —
Market trends
- HPI YoY
- ▼ -461.01%
- Current HPI
- 349.1001
- Rent YoY
- ▲ 0.67%
- Metro
- Los Angeles-Long Beach-Anaheim, CA
- State GDP YoY
- ▲ 3.21%
- F500 in state
- 116
Industry mix (Fortune 500 HQ in CA)
| Industry | F500 HQs | Revenue |
|---|---|---|
| Technology | 27 | $1,492B |
|
||
| Financial Services | 3 | $174B |
|
||
| Retail | 3 | $44B |
|
||
| Insurance | 3 | $26B |
|
||
| Media / Entertainment | 2 | $115B |
|
||
| Pharmaceuticals / Biotech | 2 | $62B |
|
||
Price history
+2618.2% since first listed33 events — show timeline
- 2026-04-30 Listed $1,495,000 CRMLS
- 2026-04-29 Coming Soon $1,495,000 CRMLS
- 2020-02-17 Listing Removed — CRMLS
- 2020-02-06 Listed $1,598,000 CRMLS
- 2020-02-05 Listing Removed — CRMLS
- 2020-01-28 Relisted — CRMLS
- 2020-01-19 Delisted — CRMLS
- 2020-01-11 Relisted — CRMLS
- 2020-01-11 Price Changed $1,549,000 CRMLS
- 2019-12-05 Contingent — CRMLS
- 2019-11-06 Listed $1,498,000 CRMLS
- 2016-03-21 Listing Removed — SDMLS
- 2016-03-21 Delisted — CRMLS
- 2016-02-26 Relisted — CRMLS
- 2016-02-18 Delisted — CRMLS
- 2016-02-11 Listed $1,288,000 CRMLS
- 2016-02-10 Listed $1,288,000 SDMLS
- 2013-03-01 Listing Removed — CRMLS
- 2012-10-23 Listed $899,000 CRMLS
- 2011-06-12 Delisted — TheMLS
- 2011-03-28 Listed — TheMLS
- 2008-03-28 Delisted — TheMLS
- 2007-09-27 Listed — TheMLS
- 2002-05-07 Delisted — TheMLS
- 2002-05-01 Listed — TheMLS
- 2000-11-14 Sold (Public Records) $288,000 Public Records
- 2000-11-14 Sold (MLS) $288,000 TheMLS
- 2000-09-18 Delisted — TheMLS
- 2000-06-01 Listed $295,000 TheMLS
- 1998-10-01 Delisted — TheMLS
- 1998-04-01 Listed — TheMLS
- 1992-05-29 Sold (Public Records) $270,000 Public Records
- 1975-11-17 Sold (Public Records) $55,000 Public Records
Property tax history
+4.2%/yrLatest (2025): $10,680 · +1.5% YoY. Source: county tax records.
Cash-flow waterfall
monthlySold comps — $/sqft
last 12 mo · ≤1 miLoading sold comps…