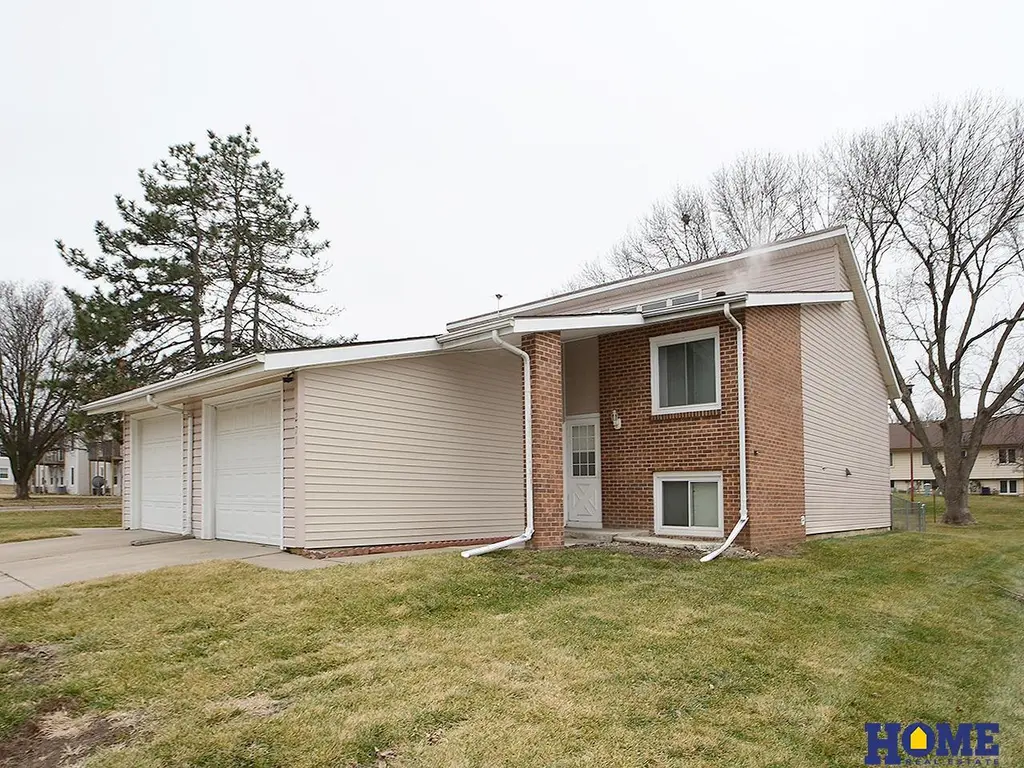
271 Parkside Ln · Lincoln, NE
Flood risk 1/10 · Minimal
- FEMA flood zone
- X (unshaded)
- Chance of flooding over 30 yrs
- 0.0%
- Est. flood insurance / yr
- $473 – $860
Fire risk 1/10 · Minimal
- Est. fire insurance / yr
- $1,161 – $2,155
Heat risk 4/10 · Minor
- Hot days now (above 105°F)
- 7 days/yr
- Hot days in 30 yrs
- 16 days/yr
Wind risk 2/10 · Minimal
- Chance of severe wind over 30 yrs
- —
Air-quality risk 1/10 · Minimal
- Unhealthy air days now
- 0 days/yr
- Unhealthy air days in 30 yrs
- 0 days/yr
Risk factors via First Street. Map © Google.
Why this score? — see what drove the F grade
The composite is a weighted blend of 9 inputs, each scored 0–100. Each bar is that input's sub-score; the figure is the points it added to the 100-point composite (weight × sub-score).
- ARV discount +8.5/15.0
- Cash flow +7.1/30.0
- Schools +4.4/10.0
- Livability +4.2/5.0
- Rent growth +3.5/5.0
- Condition / age +2.5/5.0
- 1% rule +1.9/10.0
- DSCR +1.3/10.0
- Appreciation +0.0/10.0
$210,000
🖨 Deal sheet (PDF) 📄 Offer letter ✓ Due diligence
Listing remarks
This 4 plus 1 bedroom, 2 bathroom, 1,264 square foot home in the Fairfield Park area has enough bedrooms and bathrooms for any size family. First floor has a roomy living room with vaulted ceilings, comfortable kitchen, 2 bedrooms, bathroom and sliding glass door out to a deck and fenced in backyard. The lower level has 2 more legal bedrooms plus a 5th non conforming bedroom. Also an additional bathroom and nice sized laundry room. The deck out back looks over a beautiful commons area and there is additional off street parking. This home is located close to downtown, UNL campus, parks and has easy access to the interstate for quick access going east or west. And the owners have added a one
Key facts
- $80 HOA
- Garage
- Built 1983
Property features AI
Finance
- HOA & community: Association: Parkside Village Homes; Monthly association fee of $80; Association covers exterior maintenance, grounds maintenance, snow removal, common area maintenance, trash, and management
Exterior
- Parking: Attached garage with garage door opener (1 covered/1 total parking space)
- Utilities: Public water; Public sewer; Electricity available; Natural gas available; Cable available; Phone available; Fiber optic available
- Home design: Split-entry home; Townhouse (attached); Not new / not a model; Built in 1983; Below-grade finished area included (basement approx. 400); Above-grade finished area included
- Construction: Vinyl siding and brick exterior; Composition roof; Concrete perimeter foundation
- Exterior features: Deck; In-ground sprinkler system; Chain link fencing; Paved road access; Curb and gutter; Level lot; Common area
Interior
- Kitchen: Range; Refrigerator; Dishwasher; Garbage disposal; Microwave; Pantry (listed under interior features)
- Bedrooms: Main floor master bedroom (approx. 9' x 14'); Main floor second bedroom (approx. 11' x 12'); Basement bedroom (approx. 12' x 13'); Basement bedroom (approx. 11' x 11'); Basement bedroom (approx. 10' wide)
- Flooring: Carpet; Laminate; Vinyl
- Bathrooms: Two bathrooms total — one full and one three-quarter; Main level bathroom(s) included; additional below-grade bathroom
- Heating & cooling: Natural gas forced-air heating; Central air conditioning
- Interior features: Ceiling fans; Pantry; Daylight, egress, finished basement
- Laundry & utility: Washer/dryer hook-ups available (utilities: electricity and natural gas available)
Neighborhood map
What this means for you Summary
Snapshot
- This is a 2-bed/2.0-bath townhouse listed at $210k.
Deal economics
- At list price, monthly cash flow is $-300 ($-4k/yr) — negative.
- To cash-flow at today's rent, offer at most $157k (25.2% below list).
- To meet the 1% rule (rent ≥ 1% of price), the offer needs to be $145k (30.8% below list).
- Recommended offer: $145k (30.8% below list) — sets the bar for 1% rule.
- Cap rate 4.6% vs local median 3.0% in Lincoln — top-decile yield for the area; either an underpriced asset or a hidden risk that comps aren't pricing in. Stress-test before assuming the spread holds.
Location & tenants
- Location reads 85/100 on livability (#5 in NE, #545 nationally) — a professional / high-income tenant draw. Strengths: amenities A+, cost of living A+, housing A+; Watch: crime D+.
- Lincoln Public Schools (urban): math 50% / reading 53% proficiency, ranked #59 of 111 in NE (top 53%) — acceptable for families but not a draw, mixed tenant base, ~2y average lease.
- Zoned schools: Belmont Elementary School (math 34% / reading 44%, grade F, #371 of 502 statewide, top 74%, 814 students, 0% FRL); Goodrich Middle School (math 38% / reading 36%, grade F, #99 of 128 statewide, top 79%, 877 students, 78% FRL); Lincoln Northeast High School (math 34% / reading 36%, grade F, #207 of 261 statewide, top 79%, 1,812 students, 62% FRL).
- Zoned-school proficiency averages 37% at this address vs 52% district-wide (-14 pts) — the specific schools serving this property underperform the Lincoln Public Schools average; the district grade overstates school quality for this exact location.
- Market conditions: Rents rising fast (+4.0%/yr); 371 active listings in the ZIP; 21 comparable units currently listed for rent nearby; rentals at typical pace (median 23d on market — plan ~3-4 weeks tenant-placement turnaround); 48% of comp listings sitting > 30 days — soft ceiling on asking rent; 1,940 units permitted in Lancaster County in 2024 (895 in 5+ unit buildings).
Forward outlook
- Local home prices are declining (-3.0%/yr); year-one equity from $1k of loan paydown is wiped out by about $6k of value loss. Plan a longer hold.
- Lancaster County population projected at +37% by 2050 — long-run rental-demand tailwind backs the buy-and-hold thesis.
Negotiation context
- It's been on market 45 days — a 3% lower offer ($204k) is reasonable based on typical stale-listing flexibility.
- 6 sale attempts since 28y ago with the ask held roughly flat each time — persistent listings suggest the price (not the market) is what's stuck; bring a comps-based counter.
Questions for the listing agent
- What do current leases actually rent for vs. the listed asking? Can we see a recent rent roll and the last 12 months of T-12 income?
- It's been on market 45 days. Have you received any prior offers? Is the seller open to a 31% concession, seller financing, or rate buy-down credit?
- What does the HOA fee cover, when was the last increase, and are there any pending special assessments or reserve-fund shortfalls?
- Is there a deadline driving the sale (1031 exchange, divorce, estate, relocation)? That informs how much negotiation room exists.
- Schools are A-rated — typically a magnet for longer-tenancy family renters. What's the average tenant stay here, and is there a school-zone premium baked into asking?
- Crime grade is D in this area — have there been break-ins, vandalism, or insurance claims at this property in the last 3 years? What carrier currently insures it and at what premium?
- The area grade is low — what's the realistic commute time and amenity access for the typical tenant pool here? Any planned neighborhood developments (good or bad) we should know about?
- What's the average days-on-market for RENTAL listings here right now (not sales)? A rising rental-DOM trend means longer vacancies and softer asking-rent achievability than the comps imply.
- What's the recent tenant-quality profile in this submarket — average credit score on applications, eviction rate, late-payment / NSF rate, and stable-employment percentage? A property-management company in the area should have these aggregated.
- How much new for-sale + rental construction is in the pipeline within 1–3 miles? Heavy new supply typically softens prices + rents 12–24 months out; constrained supply supports both.
Investment metrics
- 1% rule
- 0.69% ✗
- Cap rate
- 4.58%
- Cash-on-cash
- -6.12%
- DSCR
- 0.73
- GRM
- 12.0
CMA / ARV
- ARV (median comp)
- $215,000
- List price
- $210,000
- Delta
- -2.33%
- Verdict
- FAIR
- Comps
- 17 within 1.0 mi
Show comp detail 3 sales within ~0.75 mi
| Address | Dist | Beds/Ba | Sqft | Sold | Price | $/sf | Match |
|---|---|---|---|---|---|---|---|
| 247 Parkside Ln | 0.04mi | 2/2.0 | 1,325 (+5%) | 14mo | $211,451 | $160 | 78 |
| 222 Parkside Ln | 0.04mi | 3/2.0 (+1) | 1,420 (+12%) | 2mo | $226,000 | $159 | 71 |
| 4114 N 7th St | 0.37mi | 2/2.0 | 1,109 (-12%) | 3mo | $183,950 | $166 | 60 |
Match score weights: distance 35% · size 25% · config 20% · recency 20%. Top-matched comps best support the ARV.
Projected returns pro-forma
-3.0% appreciation · 4.04% rent growth · sell at horizon
- IRR
- -25.7%
- Equity multiple
- 0.12×
- Total profit
- $-51,560
- Equity at exit
- $31,312
- IRR
- -19.2%
- Equity multiple
- -0.07×
- Total profit
- $-62,957
- Equity at exit
- $18,157
Cash invested: $58,800 (down + closing). Projections, not guarantees.
Landlord ↔ Tenant lean methodology
- Overall (STATE)
- 83 Strongly Landlord-Friendly
- State Nebraska
- 83 Strongly Landlord-Friendly · R+13
- County
- — inherits STATE
- City
- — inherits STATE
ZIP-level market 68521
- Home prices YoY
- -34.1%
- Rents YoY
- 4.0%
- Active inventory
- 371
- Price-to-rent
- 12.0×
Monthly cashflow live
- Estimated rent
- $1,453 high interval (Pro) →
- Mortgage (P&I)
- −$1,101
- Tax from tax record
- −$179 /mo · $2,145/yr
- Insurance
- −$88
- HOA
- −$80
- Vacancy / Maint / Mgmt
- −$305
- Net cashflow
- $-300
Break-even live
Sensitivity live
| Price | -10% $-181 | -5% $-240 | +0% $-300 | +5% $-359 | +10% $-419 |
|---|---|---|---|---|---|
| Rent | -10% $-414 | -5% $-357 | +0% $-300 | +5% $-242 | +10% $-185 |
| Rate | -1.0pp $-194 | -0.5pp $-246 | base $-300 | +0.5pp $-354 | +1.0pp $-409 |
UW: 25.0% down · 7.5% · 30yr · 1.5% tax · 5.0% vac · 8.0% maint · 8.0% mgmt
Financing live
Cash to close
- Down payment
- $52,500
- Closing costs
- $6,300
- Reserves months
- —
- Total cash needed
- —
Loan-product check · same deal, 3 products live
Conventional
25% down · 7.5% · 30yr
- Down + closing
- —
- Monthly P&I
- —
- Monthly cashflow
- —
- DSCR
- —
- Eligible?
- —
Personal DTI + credit; lowest rate.
DSCR
20% down · 8.5% · 30yr
- Down + closing
- —
- Monthly P&I
- —
- Monthly cashflow
- —
- DSCR
- —
- Eligible?
- —
No personal income docs; deal must DSCR.
Hard money
10% down · 12.0% · 12mo
- Down + closing
- —
- Monthly P&I
- —
- Monthly cashflow
- —
- DSCR
- —
- Eligible?
- —
Short-term bridge; refi at stabilization.
Rent comps 21 comps
| Address | Beds | Baths | Sqft | Rent | $/sqft | DOM | Units | Dist |
|---|---|---|---|---|---|---|---|---|
| North Pointe Villas Lincoln, NE | 3.0 | 1.0–2.0 | 1022 | $1,919 | $1.88 | 15d | 25 | 0.29mi |
| 4441 N 1st St Lincoln, NE | 3.0 | 1.0–2.0 | 853 | $1,490 | $1.75 | 15d | 39 | 0.43mi |
| 4420 N 7th St Lincoln, NE | 1.0–2.0 | 1.0–2.0 | 881 | $1,092 | $1.24 | 15d | 17 | 0.49mi |
| 2900 N 1st St Lincoln, NE | 2.0–3.0 | 1.0–2.0 | 1061 | $945 | $0.89 | 45d | 3 | 0.54mi |
| 1151 Elba Ave Lincoln, NE | 3.0 | 1.5 | 1443 | $1,695 | $1.17 | 45d | 1 | 0.64mi |
| 2801 NW 1st St Lincoln, NE | 3.0 | 2.0 | 1152 | $1,349 | $1.17 | 45d | 3 | 0.70mi |
| 2700 N 1st St #2 Lincoln, NE | 2.0 | 1.0 | 897 | $1,095 | $1.22 | 23d | 1 | 0.72mi |
| 2635 N 5th St Unit 2635 Lincoln, NE | 3.0 | 2.0 | 1060 | $1,595 | $1.50 | 45d | 1 | 0.73mi |
| 2636 N 4th St Unit 2636 Lincoln, NE | 3.0 | 2.0 | 1060 | $1,595 | $1.50 | 45d | 1 | 0.73mi |
| 3201 N 12th St Lincoln, NE | 3.0 | 1.0 | 928 | $1,250 | $1.35 | 15d | 1 | 0.76mi |
| 4730 Innovation Dr Lincoln, NE | 2.0 | 1.0–2.5 | 873 | $1,800 | $2.06 | 15d | 1 | 0.78mi |
| 1205 Adams St Lincoln, NE | 2.0 | 1.0 | 875 | $1,350 | $1.54 | 45d | 1 | 0.82mi |
| 1501 Superior St Lincoln, NE | 1.0–2.0 | 1.0–2.0 | 818 | $1,211 | $1.48 | 15d | 11 | 1.01mi |
| 535 W Saunders Ave Unit 3 Lincoln, NE | 2.0 | 1.0 | 889 | $945 | $1.06 | 45d | 1 | 1.11mi |
| 1431 Hilltop Rd Lincoln, NE | 2.0–3.0 | 2.0 | 1050 | $1,225 | $1.17 | 15d | 1 | 1.13mi |
| 4800 N 15th St Unit 3-211 Lincoln, NE | 2.0 | 2.0 | 950 | $1,225 | $1.29 | 45d | 1 | 1.13mi |
| 4800 N 15th St Unit 3-307 Lincoln, NE | 2.0 | 2.0 | 950 | $1,225 | $1.29 | 15d | 1 | 1.13mi |
| 4800 N 15th St Unit 4-LL07 Lincoln, NE | 3.0 | 2.0 | 1150 | $1,395 | $1.21 | 23d | 1 | 1.13mi |
| 4800 N 15th St Unit 4-303 Lincoln, NE | 3.0 | 2.0 | 1150 | $1,395 | $1.21 | 45d | 1 | 1.13mi |
| 1615 Old Glory Rd Lincoln, NE | 3.0 | 2.5 | 1564 | $1,800 | $1.15 | 45d | 1 | 1.17mi |
| 5265 NW 12th St Lincoln, NE | 2.0 | 1.0–2.0 | 932 | $1,895 | $2.03 | 15d | 15 | 1.46mi |
HOA detail
- Monthly dues
- $80 · $960/yr
Listing history 30 events
-
2026-06-21days on market $210,000 Active 45 DOM
-
2026-06-18days on market $210,000 Active 42 DOM
-
2026-06-17days on market $210,000 Active 41 DOM
-
2026-06-16days on market $210,000 Active 40 DOM
-
2026-06-15days on market $210,000 Active 39 DOM
-
2026-06-14days on market $210,000 Active 37 DOM
-
2026-06-10days on market $210,000 Active 34 DOM
-
2026-06-09days on market $210,000 Active 33 DOM
-
2026-06-08days on market $210,000 Active 32 DOM
-
2026-06-07days on market $210,000 Active 31 DOM
-
2026-06-05days on market $210,000 Active 28 DOM
-
2026-06-03days on market $210,000 Active 27 DOM
-
2026-06-02days on market $210,000 Active 26 DOM
-
2026-06-01days on market $210,000 Active 25 DOM
-
2026-05-31days on market $210,000 Active 24 DOM
-
2026-05-30days on market $210,000 Active 23 DOM
-
2026-05-07$210,000 New 749-char remark
-
2026-05-07historical
-
2026-03-31price $210,000
-
2026-01-06$219,900 New
-
2026-01-06historical
-
2025-12-27$219,900 New
-
2025-04-18soldstatus $194,000 Sold
-
2025-03-06status Pending
-
2025-02-26$199,900 New
-
2025-02-26historical
-
2025-02-03$209,900 New
-
2018-10-17soldstatus $110,000
-
1998-12-07historical
-
1998-09-25$76,900
ⓘ Source: listings_history table (triggers on properties + properties_extension) + one-shot
backfill from property_details.listing_events for pre-trigger history.
Tax reassessment forecast NE · Resets to sale price
- Current annual tax
- $2,145 · $179/mo
- Projected year-2 tax
- $3,633 · $303/mo
- Expected delta
- +$1,488/yr (+$124/mo · 69.4%)
ⓘ Screening estimate from a state-policy table — verify with the county assessor before closing.
Climate risk First Street
- Flood 1/10 Low FEMA zone X (unshaded) · 0% chance over 30 yrs
- Wildfire 1/10 Low
- Heat 4/10 Moderate 7 d/yr ≥105°F today · 16 d/yr by 30 yrs out
- Wind 2/10 Low
- Air quality 1/10 Low 0 unhealthy d/yr today · 0 by 30 yrs out
Nearby sold comps map
Loading sold comps map…
Walkable amenities ~0.75 mi
Loading nearby amenities…
Taxation est. · year 1
- Rental income
- $17,435
- − Mortgage interest
- −$11,763
- − Property taxes
- −$2,145
- − Insurance
- −$1,050
- − Repairs & maintenance
- −$1,395
- − Management
- −$1,395
- − HOA
- −$960
- − Depreciation
- −$6,109
- Taxable loss
- −$7,382
- Est. tax savings @ 24.0%
- +$1,772
- After-tax cash flow
- $-1,825/yr
For passive investors: Depreciation is non-cash, so a rental often shows a tax loss while cash-flowing — sheltering income. Rental losses are passive: they offset passive income freely, and up to $25,000/yr can offset ordinary (W-2) income if you actively participate and your MAGI is under $100k (phasing out to $0 by $150k); unused losses carry forward. On sale, claimed depreciation is recaptured at up to 25%, and gains may owe capital-gains tax (a 1031 exchange can defer both). Figures are a year-1 estimate at your 24.0% rate — not tax advice; consult a CPA.
Schools (NCES district)
- District
- Lincoln Public Schools
- NCES district ID
- 3172840
- Math proficiency
- 50% ▼ -6.00%
- Reading proficiency
- 53% ▼ -3.00%
- Median HH income
- $50,273
- Composite
- 44.05/100
- National rank
- #2880
- State rank
- #59 of 111 in NE
Livability — Lincoln
- Score
- 85/100
- State rank
- #5
- US rank
- #545
Category grades
Schools grade is shown separately in the Schools card above.
Census & demographics
- Census place
- Lincoln, NE
- County
- Lancaster County · 291,509 people
- City population
- 291,509
- Metro
- Lincoln, NE
- Population (ZIP)
- 37,050
- Household income
- $67,483
- Rent vs Own
- Severe rent burden
- 1500.0
Population outlook (Lancaster County) Hauer SSP2
- Today (2025)
- 352,806 people
- By 2030
- 377,899 · +7.1%
- By 2040
- 428,582 · +21.5%
- By 2050
- 483,103 · +36.9%
- By 2075
- 632,390 · +79.2%
- By 2100
- 759,513 · +115.3%
Race, ethnicity, and origin ACS 2023
- Neighborhood character
- Predominantly White (70%)
- Race & ethnicity
- White 70% Hispanic / Latino 12% Asian 8% Two or more races 7% Black 5%
- Hispanic origin (detail)
- Mexican 7%
- Common ancestry
- Romanian 2% Arab 2% Italian 2%
- Foreign-born
- 15% · Vietnam, Canada, United Kingdom
- Languages at home
- 78% English-only · Spanish 9% Vietnamese 6% Arabic 3%
Political lean MEDSL · Lancaster
- 2024 margin
- Toss-up / Even · D 51.4% · R 47.1% · Other 1.5%
- 2008→2024 swing
- -0.7pp no change · 2008: 5.0pp · 2024: 4.3pp
- All cycles
- 2024: D+4.3 2020: D+7.8 2016: D+0.1 2012: R+1.0 2008: D+5.0
Not yet ingested
- Civics
- —
Market trends
- HPI YoY
- ▼ -124.30%
- Current HPI
- 239.8394
- Rent YoY
- ▲ 4.04%
- Metro
- Lincoln, NE
- State GDP YoY
- ▲ 0.68%
- F500 in state
- 2
Industry mix (Fortune 500 HQ in NE)
| Industry | F500 HQs | Revenue |
|---|---|---|
| Conglomerate | 1 | $371B |
|
||
Price history
+173.1% since first listed14 events — show timeline
- 2026-05-07 Listing Removed — GPRMLS
- 2026-05-07 Listed $210,000 GPRMLS
- 2026-03-31 Price Changed $210,000 GPRMLS
- 2026-01-06 Listing Removed — GPRMLS
- 2026-01-06 Listed $219,900 GPRMLS
- 2025-12-27 Listed $219,900 GPRMLS
- 2025-04-18 Sold (MLS) $194,000 GPRMLS
- 2025-03-06 Pending — GPRMLS
- 2025-02-26 Listing Removed — GPRMLS
- 2025-02-26 Listed $199,900 GPRMLS
- 2025-02-03 Listed $209,900 GPRMLS
- 2018-10-17 Sold (Public Records) $110,000 Public Records
- 1998-12-07 Listing Removed — GPRMLS
- 1998-09-25 Listed $76,900 GPRMLS
Property tax history
+2.2%/yrLatest (2025): $2,145 · +0.6% YoY. Source: county tax records.
Cash-flow waterfall
monthlySold comps — $/sqft
last 12 mo · ≤1 miLoading sold comps…