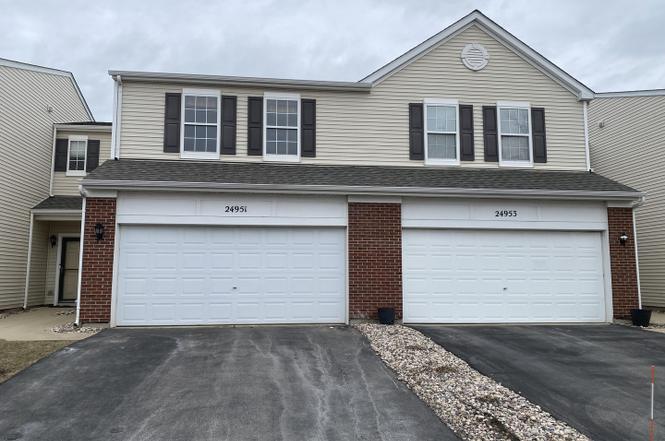
24951 Clare Cir · Manhattan, IL
Flood risk 1/10 · Minimal
- FEMA flood zone
- X (unshaded)
- Chance of flooding over 30 yrs
- 0.0%
- Est. flood insurance / yr
- $507 – $1,088
Fire risk 1/10 · Minimal
- Est. fire insurance / yr
- $804 – $1,492
Heat risk 3/10 · Minor
- Hot days now (above 102°F)
- 7 days/yr
- Hot days in 30 yrs
- 16 days/yr
Wind risk 2/10 · Minimal
- Chance of severe wind over 30 yrs
- —
Air-quality risk 3/10 · Minor
- Unhealthy air days now
- 2 days/yr
- Unhealthy air days in 30 yrs
- 3 days/yr
Risk factors via First Street. Map © Google.
Why this score? — see what drove the D- grade
The composite is a weighted blend of 9 inputs, each scored 0–100. Each bar is that input's sub-score; the figure is the points it added to the 100-point composite (weight × sub-score).
- Cash flow +10.3/30.0
- ARV discount +7.5/15.0
- 1% rule +5.9/10.0
- Schools +4.3/10.0
- Livability +3.5/5.0
- DSCR +3.0/10.0
- Rent growth +2.5/5.0
- Condition / age +2.5/5.0
- Appreciation +0.0/10.0
$251,500
🖨 Deal sheet 📄 Offer letter ✓ Due diligence
Listing remarks
Experience effortless living in this llght-filled, 2 bedroom, one and one half bathroom townhome. Beautifully maintained and perfectly situated adjacent to a park, this home offers the perfect blend of modern convenience and a peaceful suburban setting. An expansive living room flows seamlessly in to the dining area, creating a perfect environment for entertaining. Sliding glass doors lead from the dining area to a large concrete patio area, ideal for summer BBQ's and relaxing outdoors. The kitchen is well-appointed and functional featuring a brand new faucet and garbage-disposal (2026). The main floor includes a stylish half bath and direct access to the attached 2 car garage. Second level
Key facts
- Large concrete patio
- Garbage-disposal
- Adjacent to a park
Tags
Property features AI
Finance
- Other: School bus service available; Special service area (T)
- HOA & community: Monthly association fee of $195; Master association fee $120 yearly; HOA covers insurance, lawn care, and snow removal; Community amenities include a park; Manager off-site; Pets allowed (cats and dogs OK) with deposit and number limits
Exterior
- Parking: Attached garage with 2 garage spaces and garage door opener; Asphalt driveway; 2 total parking spaces
- Utilities: Public water; Public sewer
- Home design: Attached single — townhouse, 2-story; Entry at level 1; Fee simple ownership with HOA; Part of a 6-unit building; Subdivision: Brookstone Springs
- Construction: Vinyl siding and brick exterior; Building age approximately 16–20 years
- Exterior features: Patio
Interior
- Kitchen: Range; Microwave; Dishwasher; Refrigerator; Disposal
- Bedrooms: Master bedroom on second level (14 x 13) with window treatments; Second bedroom on second level (11 x 10) with blinds; Loft on second level (18 x 19)
- Flooring: Carpet in living areas and bedrooms; Vinyl in kitchen, dining room and laundry
- Bathrooms: 1 full bath; 1 half bath
- Heating & cooling: Natural gas forced air heating; Central air conditioning
- Interior features: Walk-in closet(s); Drapes; 6 total rooms
- Laundry & utility: In-unit laundry on upper level (washer and dryer included)
Neighborhood map
What this means for you Summary
Snapshot
- This is a 2-bed/1.5-bath other listed at $252k.
Deal economics
- At list price, monthly cash flow is $-138 ($-2k/yr) — negative.
- To cash-flow at today's rent, offer at most $227k (9.7% below list).
- Meets the 1% rule at list price ($3k rent vs $252k).
- Recommended offer: $227k (9.7% below list) — sets the bar for cash-flow.
- Cap rate 5.6% vs local median 2.5% in Manhattan — top-decile yield for the area; either an underpriced asset or a hidden risk that comps aren't pricing in. Stress-test before assuming the spread holds.
Location & tenants
- Location reads 69/100 on livability (#396 in IL) — a middle-class / working-renter tenant base. Strengths: crime A+, employment A+, housing A+; Watch: amenities F, commute F, health & safety F.
- Lincoln Way Chsd 210 (suburban): math 44% / reading 49% proficiency, ranked #60 of 620 in IL (top 10%) — families likely to look elsewhere, expect single-tenant / working-renter base with shorter leases.
- Market conditions: 113 active listings in the ZIP; 3 comparable units currently listed for rent nearby; rentals lingering (median 44d on market — plan ~5-8 weeks vacancy on turnover, expect pricing pressure); 67% of comp listings sitting > 30 days — soft ceiling on asking rent; 2,028 units permitted in Will County in 2024 (530 in 5+ unit buildings).
Forward outlook
- Local home prices are declining (-3.0%/yr); year-one equity from $2k of loan paydown is wiped out by about $8k of value loss. Plan a longer hold.
- Will County population projected to shrink 4% by 2050 — rents likely to lag national; underwrite the cash flow, not the appreciation.
Negotiation context
- It's been on market 112 days — a 9% lower offer ($229k) is reasonable based on typical stale-listing flexibility.
Risks & watch-outs
- Watch-outs: property tax is 3.2% of price.
Questions for the listing agent
- What do current leases actually rent for vs. the listed asking? Can we see a recent rent roll and the last 12 months of T-12 income?
- It's been on market 112 days. Have you received any prior offers? Is the seller open to a 10% concession, seller financing, or rate buy-down credit?
- Property tax is high relative to price — has the assessment been appealed recently, and will the sale trigger a re-assessment?
- What does the HOA fee cover, when was the last increase, and are there any pending special assessments or reserve-fund shortfalls?
- Why hasn't it sold? Are there any deal-killer items the seller is aware of (foundation, flood, title, zoning, code violations)?
- Is there a deadline driving the sale (1031 exchange, divorce, estate, relocation)? That informs how much negotiation room exists.
- Schools are B-rated — typically a magnet for longer-tenancy family renters. What's the average tenant stay here, and is there a school-zone premium baked into asking?
- The area grade is low — what's the realistic commute time and amenity access for the typical tenant pool here? Any planned neighborhood developments (good or bad) we should know about?
- What's the average days-on-market for RENTAL listings here right now (not sales)? A rising rental-DOM trend means longer vacancies and softer asking-rent achievability than the comps imply.
- What's the recent tenant-quality profile in this submarket — average credit score on applications, eviction rate, late-payment / NSF rate, and stable-employment percentage? A property-management company in the area should have these aggregated.
- How much new for-sale + rental construction is in the pipeline within 1–3 miles? Heavy new supply typically softens prices + rents 12–24 months out; constrained supply supports both.
Investment metrics
- 1% rule
- 1.09% ✓
- Cap rate
- 5.63%
- Cash-on-cash
- -2.36%
- DSCR
- 0.90
- GRM
- 7.6
CMA / ARV
No comps found within radius.
Projected returns pro-forma
-3.0% appreciation · 3.0% rent growth · sell at horizon
- IRR
- -20.0%
- Equity multiple
- 0.30×
- Total profit
- $-49,167
- Equity at exit
- $37,499
- IRR
- -12.6%
- Equity multiple
- 0.25×
- Total profit
- $-52,565
- Equity at exit
- $21,745
Cash invested: $70,420 (down + closing). Projections, not guarantees.
Landlord ↔ Tenant lean methodology
- Overall (STATE)
- 43 Moderately Tenant-Leaning
- State Illinois
- 43 Moderately Tenant-Leaning · D+7
- County
- — inherits STATE
- City
- — inherits STATE
ZIP-level market 60442
- Home prices YoY
- -9.3%
- Active inventory
- 113
- Price-to-rent
- 7.6×
Monthly cashflow live
- Estimated rent
- $2,743 medium interval (Pro) →
- Mortgage (P&I)
- −$1,319
- Tax from tax record
- −$676 /mo · $8,118/yr
- Insurance
- −$105
- HOA
- −$205
- Vacancy / Maint / Mgmt
- −$576
- Net cashflow
- $-138
Break-even live
UW: 25.0% down · 7.5% · 30yr · 1.5% tax · 5.0% vac · 8.0% maint · 8.0% mgmt
Financing live
Cash to close
- Down payment
- $62,875
- Closing costs
- $7,545
- Reserves months
- —
- Total cash needed
- —
Loan-product check · same deal, 3 products live
Conventional
25% down · 7.5% · 30yr
- Down + closing
- —
- Monthly P&I
- —
- Monthly cashflow
- —
- DSCR
- —
- Eligible?
- —
Personal DTI + credit; lowest rate.
DSCR
20% down · 8.5% · 30yr
- Down + closing
- —
- Monthly P&I
- —
- Monthly cashflow
- —
- DSCR
- —
- Eligible?
- —
No personal income docs; deal must DSCR.
Hard money
10% down · 12.0% · 12mo
- Down + closing
- —
- Monthly P&I
- —
- Monthly cashflow
- —
- DSCR
- —
- Eligible?
- —
Short-term bridge; refi at stabilization.
Rent comps 3 comps
| Address | Beds | Baths | Sqft | Rent | $/sqft | DOM | Units | Dist |
|---|---|---|---|---|---|---|---|---|
| 15030 W Cyrus Dr Manhattan, IL | 3.0 | 2.5 | 1760 | $2,900 | $1.65 | 44d | 1 | 0.48mi |
| 15749 W Crobally Way Manhattan, IL | 2.0 | 2.5 | 1508 | $2,900 | $1.92 | 44d | 1 | 0.68mi |
| 25273 Faraday Rd Manhattan, IL | 2.0 | 1.5 | 1274 | $2,250 | $1.77 | 10d | 1 | 0.76mi |
HOA detail
- Monthly dues
- $205 · $2,460/yr
- Likely covers
- trash
Listing history 17 events
-
2026-06-18days on market $251,500 Active 112 DOM
-
2026-06-17days on market $251,500 Active 111 DOM
-
2026-06-16days on market $251,500 Active 110 DOM
-
2026-06-15days on market $251,500 Active 109 DOM
-
2026-06-13days on market $251,500 Active 107 DOM
-
2026-06-13days on market $251,500 Active 106 DOM
-
2026-06-10price $251,500 Active 103 DOM
-
2026-06-09days on market $252,000 Active 103 DOM
-
2026-06-08days on market $252,000 Active 102 DOM
-
2026-06-07statusdays on market $252,000 Active 101 DOM
-
2026-06-04statusdays on market $252,000 Contingent - Continue to Show 98 DOM
-
2026-06-03days on market $252,000 Active 97 DOM
-
2026-06-02days on market $252,000 Active 96 DOM
-
2026-06-01days on market $252,000 Active 95 DOM
-
2026-05-31days on market $252,000 Active 94 DOM
-
2026-04-23price $252,000
-
2026-02-26$255,000 Active
ⓘ Source: listings_history table (triggers on properties + properties_extension) + one-shot
backfill from property_details.listing_events for pre-trigger history.
Tax reassessment forecast IL · Partial reset (capped growth)
- Current annual tax
- $8,118 · $676/mo
- Projected year-2 tax
- $8,118 · $676/mo
- Expected delta
- $0/yr ($0/mo · 0.0%)
ⓘ Screening estimate from a state-policy table — verify with the county assessor before closing.
Climate risk First Street
- Flood 1/10 Low FEMA zone X (unshaded) · 0% chance over 30 yrs
- Wildfire 1/10 Low
- Heat 3/10 Moderate 7 d/yr ≥102°F today · 16 d/yr by 30 yrs out
- Wind 2/10 Low
- Air quality 3/10 Moderate 2 unhealthy d/yr today · 3 by 30 yrs out
Nearby sold comps map
Loading sold comps map…
Walkable amenities ~0.75 mi
Loading nearby amenities…
Taxation est. · year 1
- Rental income
- $32,916
- − Mortgage interest
- −$14,088
- − Property taxes
- −$8,118
- − Insurance
- −$1,258
- − Repairs & maintenance
- −$2,633
- − Management
- −$2,633
- − HOA
- −$2,460
- − Depreciation
- −$7,316
- Taxable loss
- −$5,590
- Est. tax savings @ 24.0%
- +$1,342
- After-tax cash flow
- $-317/yr
For passive investors: Depreciation is non-cash, so a rental often shows a tax loss while cash-flowing — sheltering income. Rental losses are passive: they offset passive income freely, and up to $25,000/yr can offset ordinary (W-2) income if you actively participate and your MAGI is under $100k (phasing out to $0 by $150k); unused losses carry forward. On sale, claimed depreciation is recaptured at up to 25%, and gains may owe capital-gains tax (a 1031 exchange can defer both). Figures are a year-1 estimate at your 24.0% rate — not tax advice; consult a CPA.
Schools (NCES district)
- District
- Lincoln Way Chsd 210
- NCES district ID
- 1723070
- Math proficiency
- 44% ▼ -13.00%
- Reading proficiency
- 49% ▼ -9.00%
- Median HH income
- $86,879
- Composite
- 43.4/100
- National rank
- #3019
- State rank
- #60 of 620 in IL
Livability — Manhattan
- Score
- 69/100
- State rank
- #396
- US rank
- #8289
Category grades
Schools grade is shown separately in the Schools card above.
Census & demographics
- Census place
- Manhattan, IL
- City population
- 13,467
- Population (ZIP)
- 13,467
Population outlook (Will County) Hauer SSP2
- Today (2025)
- 705,368 people
- By 2030
- 708,154 · +0.4%
- By 2040
- 702,692 · -0.4%
- By 2050
- 680,249 · -3.6%
- By 2075
- 611,990 · -13.2%
- By 2100
- 516,215 · -26.8%
Race, ethnicity, and origin ACS 2023
- Neighborhood character
- Predominantly White (82%)
- Race & ethnicity
- White 82% Two or more races 11% Hispanic / Latino 10% Black 3%
- Hispanic origin (detail)
- Mexican 10%
- Common ancestry
- Romanian 15% Iranian 3% Portuguese 1%
- Foreign-born
- 4% · Canada
- Languages at home
- 91% English-only · Spanish 5% Russian/Polish/Slavic 3%
Political lean MEDSL · Will
- 2024 margin
- Toss-up / Even · D 50.1% · R 48.5% · Other 1.4%
- 2008→2024 swing
- -11.6pp toward R · 2008: 13.2pp · 2024: 1.6pp
- All cycles
- 2024: D+1.6 2020: D+8.3 2016: D+5.7 2012: D+3.7 2008: D+13.2
Not yet ingested
- Civics
- —
Market trends
- HPI YoY
- ▼ -23.77%
- Current HPI
- 232.3641
- Rent YoY
- —
- Metro
- —
- State GDP YoY
- ▲ 1.59%
- F500 in state
- 60
Industry mix (Fortune 500 HQ in IL)
| Industry | F500 HQs | Revenue |
|---|---|---|
| Insurance | 4 | $201B |
|
||
| Consumer Goods | 4 | $87B |
|
||
| Industrial Machinery | 3 | $64B |
|
||
| Healthcare | 2 | $55B |
|
||
| Retail / Pharmacy | 1 | $148B |
|
||
| Agriculture / Food | 1 | $86B |
|
||
Price history
-1.2% since first listed2 events — show timeline
- 2026-04-23 Price Changed $252,000 MRED as Distributed by MLS Grid
- 2026-02-26 Listed $255,000 MRED as Distributed by MLS Grid
Property tax history
+2.3%/yrLatest (2024): $8,118 · +1.4% YoY. Source: county tax records.
Cash-flow waterfall
monthlySold comps — $/sqft
last 12 mo · ≤1 miLoading sold comps…