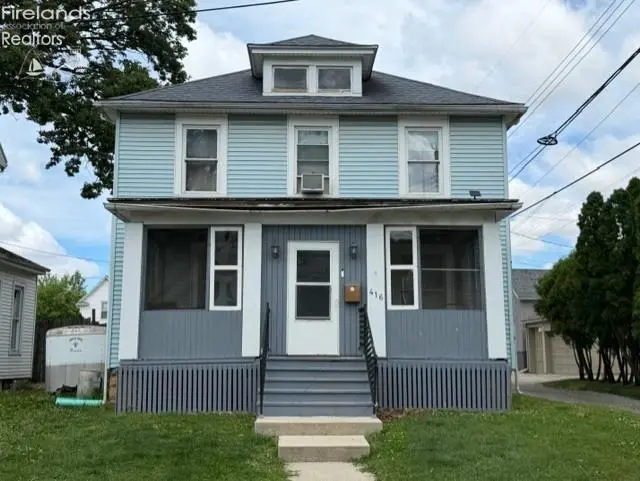
416 S Wood St · Fremont, OH
Flood risk 3/10 · Minor
- FEMA flood zone
- X (unshaded)
- Chance of flooding over 30 yrs
- 0.2%
- Est. flood insurance / yr
- $473 – $860
Fire risk 1/10 · Minimal
- Est. fire insurance / yr
- $713 – $1,323
Heat risk 3/10 · Minor
- Hot days now (above 99°F)
- 7 days/yr
- Hot days in 30 yrs
- 17 days/yr
Wind risk 2/10 · Minimal
- Chance of severe wind over 30 yrs
- —
Air-quality risk 2/10 · Minimal
- Unhealthy air days now
- 1 days/yr
- Unhealthy air days in 30 yrs
- 1 days/yr
Risk factors via First Street. Map © Google.
Why this score? — see what drove the C+ grade
The composite is a weighted blend of 9 inputs, each scored 0–100. Each bar is that input's sub-score; the figure is the points it added to the 100-point composite (weight × sub-score).
- Cash flow +22.9/30.0
- ARV discount +15.0/15.0
- DSCR +7.4/10.0
- 1% rule +5.3/10.0
- Livability +3.7/5.0
- Schools +3.3/10.0
- Rent growth +2.5/5.0
- Condition / age +2.5/5.0
- Appreciation +0.0/10.0
$142,000
🖨 Deal sheet 📄 Offer letter ✓ Due diligence
Listing remarks MLS
Turn-key property! Stunning kit w/laminate flr, wood cabinetry & recessed lighting. Appliances stay. DR & LR open to each other w/wide doorways. French doors off DR to wooden deck. Wide stairway to upstairs. 3 generous sized bdrms. Walk-in closet off hall area w/wire racks and shelving for storage. New roof 2013. Full basement, furnace serviced 2013. Must see!
Key facts
- Bike trail
- Garbage disposal
- Dishwasher
Tags
Property features AI
Exterior
- Parking: Off-street parking
- Utilities: Public water; Public sewer
- Home design: Single-family residence; Residential property
- Construction: Vinyl siding construction; Asphalt roof
- Exterior features: Asphalt roof; Vinyl siding
Interior
- Kitchen: Dishwasher; Range; Refrigerator
- Bathrooms: 1 full bathroom; 1 half bathroom
- Heating & cooling: Central air conditioning; Natural gas forced-air heating
- Interior features: Dishwasher; Dryer; Range; Refrigerator; Washer; Full basement
- Laundry & utility: Washer; Dryer
Neighborhood map
What this means for you Summary
Snapshot
- This is a 2-bed/1.5-bath single-family listed at $142k.
Deal economics
- At list price, monthly cash flow is $250 ($3k/yr) — positive.
- The deal already cash-flows at list — no discount required.
- Meets the 1% rule at list price ($1k rent vs $142k).
- Cap rate 8.4% vs local median 5.3% in Fremont — top-decile yield for the area; either an underpriced asset or a hidden risk that comps aren't pricing in. Stress-test before assuming the spread holds.
Location & tenants
- Location reads 74/100 on livability (#283 in OH, #4,637 nationally) — a middle-class / working-renter tenant base. Strengths: cost of living A+, housing A+, health & safety A+; Watch: amenities F, commute F, employment F.
- Fremont City (town): math 35% / reading 44% proficiency, ranked #543 of 656 in OH (top 83%) — families likely to look elsewhere, expect single-tenant / working-renter base with shorter leases.
- Market conditions: 22 active listings in the ZIP; 3 comparable units currently listed for rent nearby; rentals lingering (median 44d on market — plan ~5-8 weeks vacancy on turnover, expect pricing pressure); 67% of comp listings sitting > 30 days — soft ceiling on asking rent; 23 units permitted in Sandusky County in 2024 (0 in 5+ unit buildings).
- This rent runs 32% of the median local income ($55k/yr) — at the standard rent-burdened threshold; future hikes will face affordability resistance.
Forward outlook
- Local home prices are declining (-3.0%/yr); year-one equity from $982 of loan paydown is wiped out by about $4k of value loss. Plan a longer hold.
- Sandusky County population projected at -17% by 2050 — secular population decline; favor cash flow + early exit over multi-decade hold.
Negotiation context
- Only 5 days on market — expect competitive offers; lowballing is unlikely to land.
- 5 sale attempts since 14y ago with the ask held roughly flat each time — persistent listings suggest the price (not the market) is what's stuck; bring a comps-based counter.
- Current owner paid $92k; list at $142k implies a 55% gain — meaningful room to come down on a strong offer.
Risks & watch-outs
- Watch-outs: built in 1900 — expect roof / HVAC / electrical / plumbing capex.
Questions for the listing agent
- Built in 1900 — when were the roof, HVAC, electrical panel, plumbing, and water heater last replaced?
- Is there a deadline driving the sale (1031 exchange, divorce, estate, relocation)? That informs how much negotiation room exists.
- Schools are B-rated — typically a magnet for longer-tenancy family renters. What's the average tenant stay here, and is there a school-zone premium baked into asking?
- What's the average days-on-market for RENTAL listings here right now (not sales)? A rising rental-DOM trend means longer vacancies and softer asking-rent achievability than the comps imply.
- What's the recent tenant-quality profile in this submarket — average credit score on applications, eviction rate, late-payment / NSF rate, and stable-employment percentage? A property-management company in the area should have these aggregated.
- How much new for-sale + rental construction is in the pipeline within 1–3 miles? Heavy new supply typically softens prices + rents 12–24 months out; constrained supply supports both.
Investment metrics
- 1% rule
- 1.03% ✓
- Cap rate
- 8.40%
- Cash-on-cash
- 7.53%
- DSCR
- 1.34
- GRM
- 8.1
CMA / ARV
- ARV (on-the-fly)
- $186,276
- Comps found
- 12
Show comp detail 12 sales within ~0.75 mi
| Address | Dist | Beds/Ba | Sqft | Sold | Price | $/sf | Match |
|---|---|---|---|---|---|---|---|
| 320 High St | 0.20mi | 3/1.5 (+1) | 1,716 (+5%) | 4mo | $170,000 | $99 | 73 |
| 613 Garrison St | 0.21mi | 3/2.0 (+1) | 1,700 (+4%) | 14mo | $181,500 | $107 | 65 |
| 434 Vine St | 0.25mi | 3/1.5 (+1) | 1,500 (-8%) | 9mo | $130,000 | $87 | 62 |
| 1342 Mcpherson Blvd | 0.47mi | 3/1.5 (+1) | 1,540 (-6%) | 7mo | $175,000 | $114 | 58 |
| 815 South St | 0.24mi | 3/1.0 (+1) | 1,441 (-12%) | 6mo | $143,500 | $100 | 57 |
| 118 S Wood St | 0.22mi | 3/1.5 (+1) | 1,469 (-10%) | 13mo | $175,000 | $119 | 57 |
| 345 Rawson Ave | 0.50mi | 3/2.5 (+1) | 1,660 (+2%) | 15mo | $129,000 | $78 | 52 |
| 1033 Hayes Ave | 0.22mi | 3/1.5 (+1) | 1,841 (+13%) | 15mo | $209,000 | $114 | 51 |
| 905 Twinn St | 0.50mi | 3/1.5 (+1) | 1,832 (+12%) | 7mo | $199,900 | $109 | 46 |
| 812 Bush St | 0.40mi | 3/1.5 (+1) | 1,436 (-12%) | 15mo | $194,000 | $135 | 44 |
| 140 N Jefferson St | 0.62mi | 3/1.0 (+1) | 1,458 (-11%) | 11mo | $173,000 | $119 | 37 |
| 621 Memorial Pkwy | 0.71mi | 3/2.0 (+1) | 1,484 (-9%) | 13mo | $255,000 | $172 | 34 |
Match score weights: distance 35% · size 25% · config 20% · recency 20%. Top-matched comps best support the ARV.
Projected returns pro-forma
-3.0% appreciation · 3.0% rent growth · sell at horizon
- IRR
- -4.8%
- Equity multiple
- 0.82×
- Total profit
- $-7,141
- Equity at exit
- $21,173
- IRR
- 4.8%
- Equity multiple
- 1.36×
- Total profit
- $14,144
- Equity at exit
- $12,278
Cash invested: $39,760 (down + closing). Projections, not guarantees.
Landlord ↔ Tenant lean methodology
- Overall (STATE)
- 73 Landlord-Friendly
- State Ohio
- 73 Landlord-Friendly · R+6
- County
- — inherits STATE
- City
- — inherits STATE
ZIP-level market 43410
- Home prices YoY
- -24.4%
- Active inventory
- 22
- Price-to-rent
- 8.1×
Monthly cashflow live
- Estimated rent
- $1,460 medium interval (Pro) →
- Mortgage (P&I)
- −$745
- Tax from tax record
- −$100 /mo · $1,196/yr
- Insurance
- −$59
- HOA
- −$0
- Vacancy / Maint / Mgmt
- −$307
- Net cashflow
- $250
Break-even live
UW: 25.0% down · 7.5% · 30yr · 1.5% tax · 5.0% vac · 8.0% maint · 8.0% mgmt
Financing live
Cash to close
- Down payment
- $35,500
- Closing costs
- $4,260
- Reserves months
- —
- Total cash needed
- —
Loan-product check · same deal, 3 products live
Conventional
25% down · 7.5% · 30yr
- Down + closing
- —
- Monthly P&I
- —
- Monthly cashflow
- —
- DSCR
- —
- Eligible?
- —
Personal DTI + credit; lowest rate.
DSCR
20% down · 8.5% · 30yr
- Down + closing
- —
- Monthly P&I
- —
- Monthly cashflow
- —
- DSCR
- —
- Eligible?
- —
No personal income docs; deal must DSCR.
Hard money
10% down · 12.0% · 12mo
- Down + closing
- —
- Monthly P&I
- —
- Monthly cashflow
- —
- DSCR
- —
- Eligible?
- —
Short-term bridge; refi at stabilization.
Rent comps 3 comps
| Address | Beds | Baths | Sqft | Rent | $/sqft | DOM | Units | Dist |
|---|---|---|---|---|---|---|---|---|
| 900 Stilwell Ave Fremont, OH | 3.0 | 2.0 | 1484 | $1,250 | $0.84 | 17d | 1 | 0.91mi |
| 1425 White Ave Fremont, OH | 3.0 | 1.0 | 1142 | $1,495 | $1.31 | 43d | 1 | 1.38mi |
| 1526 Sunrise Blvd Fremont, OH | 3.0 | 1.5 | 1592 | $1,750 | $1.10 | 43d | 1 | 1.49mi |
Listing history 6 events
-
2026-06-18days on market $142,000 Active 5 DOM
-
2026-06-17days on market $142,000 Active 4 DOM
-
2026-06-16days on market $142,000 Active 3 DOM
-
2026-06-15days on market $142,000 Active 2 DOM
-
2026-06-14remarks 699-char remark
-
2026-06-14$142,000 Active 1 DOM
ⓘ Source: listings_history table (triggers on properties + properties_extension) + one-shot
backfill from property_details.listing_events for pre-trigger history.
Tax reassessment forecast OH · Partial reset (capped growth)
- Current annual tax
- $1,196 · $100/mo
- Projected year-2 tax
- $1,706 · $142/mo
- Expected delta
- +$509/yr (+$42/mo · 42.6%)
ⓘ Screening estimate from a state-policy table — verify with the county assessor before closing.
Climate risk First Street
- Flood 3/10 Moderate FEMA zone X (unshaded) · 20% chance over 30 yrs
- Wildfire 1/10 Low
- Heat 3/10 Moderate 7 d/yr ≥99°F today · 17 d/yr by 30 yrs out
- Wind 2/10 Low
- Air quality 2/10 Low 1 unhealthy d/yr today · 1 by 30 yrs out
Nearby sold comps map
Loading sold comps map…
Walkable amenities ~0.75 mi
Loading nearby amenities…
Taxation est. · year 1
- Rental income
- $17,515
- − Mortgage interest
- −$7,954
- − Property taxes
- −$1,196
- − Insurance
- −$710
- − Repairs & maintenance
- −$1,401
- − Management
- −$1,401
- − Depreciation
- −$4,131
- Taxable income
- $721
- Est. tax owed @ 24.0%
- −$173
- After-tax cash flow
- $2,822/yr
For passive investors: Depreciation is non-cash, so a rental often shows a tax loss while cash-flowing — sheltering income. Rental losses are passive: they offset passive income freely, and up to $25,000/yr can offset ordinary (W-2) income if you actively participate and your MAGI is under $100k (phasing out to $0 by $150k); unused losses carry forward. On sale, claimed depreciation is recaptured at up to 25%, and gains may owe capital-gains tax (a 1031 exchange can defer both). Figures are a year-1 estimate at your 24.0% rate — not tax advice; consult a CPA.
Schools (NCES district)
- District
- Fremont City
- NCES district ID
- 3904401
- Math proficiency
- 35% ▼ -27.00%
- Reading proficiency
- 44% ▼ -13.00%
- Median HH income
- $44,046
- Composite
- 33.48/100
- National rank
- #5449
- State rank
- #543 of 656 in OH
Livability — Fremont
- Score
- 74/100
- State rank
- #283
- US rank
- #4637
Category grades
Schools grade is shown separately in the Schools card above.
Census & demographics
- Census place
- Fremont, OH
- County
- Sandusky · 51,886 people
- City population
- 29,400
- Population (ZIP)
- 10,365
- Household income
- $54,635
- Rent vs Own
- Severe rent burden
- 2.9
Population outlook (Sandusky County) Hauer SSP2
- Today (2025)
- 57,409 people
- By 2030
- 55,791 · -2.8%
- By 2040
- 51,837 · -9.7%
- By 2050
- 47,712 · -16.9%
- By 2075
- 39,908 · -30.5%
- By 2100
- 33,171 · -42.2%
Race, ethnicity, and origin ACS 2023
- Neighborhood character
- Predominantly White (90%)
- Race & ethnicity
- White 90% Two or more races 6% Hispanic / Latino 5%
- Common ancestry
- Romanian 5% Slovak 3% Lithuanian 3%
- Foreign-born
- 1% · Canada, Dominican Republic
- Languages at home
- 97% English-only · Spanish 3%
Political lean MEDSL · Sandusky
- 2024 margin
- Solid R (+30.9) · D 34.1% · R 65.0%
- 2008→2024 swing
- -35.5pp toward R · 2008: 4.6pp · 2024: -30.9pp
- All cycles
- 2024: R+30.9 2020: R+27.6 2016: R+23.0 2012: D+1.9 2008: D+4.6
Not yet ingested
- Civics
- —
Market trends
- HPI YoY
- ▼ -63.59%
- Current HPI
- 197.1954
- Rent YoY
- —
- Metro
- —
- State GDP YoY
- ▲ 1.98%
- F500 in state
- 48
Industry mix (Fortune 500 HQ in OH)
| Industry | F500 HQs | Revenue |
|---|---|---|
| Insurance | 3 | $145B |
|
||
| Industrial Machinery | 3 | $49B |
|
||
| Financial Services | 3 | $24B |
|
||
| Consumer Goods | 2 | $93B |
|
||
| Aerospace / Defense | 2 | $47B |
|
||
| Utilities | 2 | $33B |
|
||
Price history
+283.8% since first listed18 events — show timeline
- 2026-06-11 Listed $142,000 FAOR
- 2026-05-18 Price Changed $69,900 NORIS
- 2025-10-13 Price Changed $30,250 NORIS
- 2021-12-08 Sold (Public Records) $91,800 Public Records
- 2021-12-02 Sold (MLS) $91,800 FAOR
- 2021-10-26 Listed $89,000 FAOR
- 2017-12-20 Sold (MLS) $44,000 FAOR
- 2017-11-03 Listed $44,000 FAOR
- 2013-09-09 Sold (Public Records) $71,500 Public Records
- 2013-09-09 Sold (MLS) $71,500 NORIS
- 2013-09-09 Price Changed $71,500 NORIS
- 2013-04-23 Listed $69,900 NORIS
- 2013-03-12 Sold (MLS) $30,250 NORIS
- 2013-02-06 Price Changed $34,900 NORIS
- 2012-12-26 Listed $34,900 NORIS
- 2002-03-26 Sold (Public Records) $85,500 Public Records
- 2000-11-20 Sold (Public Records) $36,400 Public Records
- 1993-02-17 Sold (Public Records) $37,000 Public Records
Property tax history
+2.3%/yrLatest (2025): $1,196 · +91.5% YoY. Source: county tax records.
Cash-flow waterfall
monthlySold comps — $/sqft
last 12 mo · ≤1 miLoading sold comps…