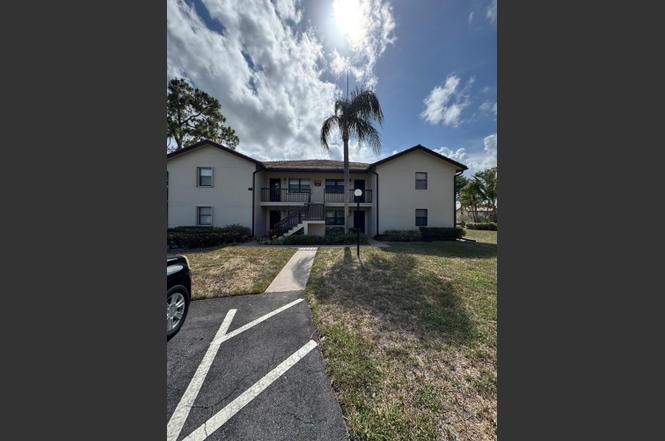
7626 Tahiti Ln #204 · Greenacres, FL
Flood risk 1/10 · Minimal
- FEMA flood zone
- X (unshaded)
- Chance of flooding over 30 yrs
- 0.0%
- Est. flood insurance / yr
- $507 – $1,088
Fire risk 1/10 · Minimal
- Est. fire insurance / yr
- $947 – $1,759
Heat risk 10/10 · Severe
- Hot days now (above 106°F)
- 7 days/yr
- Hot days in 30 yrs
- 27 days/yr
Wind risk 10/10 · Severe
- Chance of severe wind over 30 yrs
- 99.0%
Air-quality risk 2/10 · Minimal
- Unhealthy air days now
- 0 days/yr
- Unhealthy air days in 30 yrs
- 2 days/yr
Risk factors via First Street. Map © Google.
Why this score? — see what drove the C+ grade
The composite is a weighted blend of 9 inputs, each scored 0–100. Each bar is that input's sub-score; the figure is the points it added to the 100-point composite (weight × sub-score).
- Cash flow +25.2/30.0
- 1% rule +10.0/10.0
- DSCR +8.3/10.0
- ARV discount +7.5/15.0
- Schools +4.3/10.0
- Livability +3.5/5.0
- Condition / age +2.5/5.0
- Rent growth +2.4/5.0
- Appreciation +0.0/10.0
$133,500
🖨 Deal sheet 📄 Offer letter ✓ Due diligence
Listing remarks
MOVE IN READY!!! Great condo located in beautiful Lucerne Lakes, a 55+ active community. This 2 bd / 2ba second floor condo with high vaulted ceilings, corner unit, extra windows. New Paint throughout condo, new plank tiles in entry area, kitchen & eat-in area. Wood plank flooring throughout living room, dining room & bedrooms. Side by side Refrigerator, stove, microwave, dishwasher, washer & dryer. Water, sewer, trash and basic cable are included Master bedroom offers ensuite bathroom, walk in shower separate from vanity area. Large walk-in closet. Guest bedroom with nice closet. Guest bathroom with tub. Laundry room comes with washer, dryer & extra storage. Blin
Key facts
- Wood plank flooring
- Large walk-in closet
- New plank tiles
Tags
Property features AI
Finance
- Other: Building area: 1,072 total; living area reported as 1,049; 372 units in community
- HOA & community: Monthly association fee of $575; Association covers cable TV, sewer, trash and water; Community amenities: fitness center, community room, courtesy bus; Has association; Senior community; Pets not allowed
Exterior
- Security: Smoke detector(s)
- Utilities: Public water; Public sewer; Cable available; Sewer available; Water available
- Home design: Condominium; 2-story building; Unit faces west
- Construction: CBS construction
- Exterior features: Not waterfront
Interior
- Kitchen: Dishwasher; Garbage disposal; Gas range; Refrigerator; Electric water heater
- Bedrooms: No main-level bedrooms
- Flooring: Ceramic tile; Wood
- Bathrooms: 2 full bathrooms
- Heating & cooling: Central heating; Central air conditioning; Ceiling fan(s)
- Interior features: High ceilings; Smoke detectors
- Laundry & utility: Inside laundry in a laundry closet
Neighborhood map
What this means for you Summary
Snapshot
- This is a 2-bed/2.0-bath condo listed at $134k.
Deal economics
- At list price, monthly cash flow is $298 ($4k/yr) — positive.
- The deal already cash-flows at list — no discount required.
- Meets the 1% rule at list price ($2k rent vs $134k).
- Recommended offer: $117k (12.0% below list) — sets the bar for market timing.
Location & tenants
- Location reads 69/100 on livability (#490 in FL) — a middle-class / working-renter tenant base. Strengths: cost of living A+, housing A+, health & safety A; Watch: schools D+, employment D, amenities F.
- Palm Beach (suburban): math 46% / reading 53% proficiency, ranked #34 of 73 in FL (top 47%) — families likely to look elsewhere, expect single-tenant / working-renter base with shorter leases.
- Market conditions: Rents soft (-0.4%/yr); 651 active listings in the ZIP; 40 comparable units currently listed for rent nearby; rentals at typical pace (median 21d on market — plan ~3-4 weeks tenant-placement turnaround); solid renter incomes; 3,974 units permitted in Palm Beach County in 2024 (1,012 in 5+ unit buildings).
Forward outlook
- Local home prices are declining (-3.0%/yr); year-one equity from $923 of loan paydown is wiped out by about $4k of value loss. Plan a longer hold.
- Palm Beach County population projected at +30% by 2050 — long-run rental-demand tailwind backs the buy-and-hold thesis.
Negotiation context
- It's been on market 361 days — a 12% lower offer ($117k) is reasonable based on typical stale-listing flexibility.
- 4 sale attempts since 11y ago with the ask held roughly flat each time — persistent listings suggest the price (not the market) is what's stuck; bring a comps-based counter.
- Current owner paid $59k; list at $134k implies a 126% gain — meaningful room to come down on a strong offer.
Risks & watch-outs
- Watch-outs: HOA is 27% of rent.
- Climate carrying-cost: severe wind risk, 99% chance of damaging wind over 30y; extreme-heat days projected 7→27/yr by 2055 (HVAC capex compounding) — expect insurance premiums to compound above CPI over the hold.
Questions for the listing agent
- It's been on market 361 days. Have you received any prior offers? Is the seller open to a 12% concession, seller financing, or rate buy-down credit?
- What does the HOA fee cover, when was the last increase, and are there any pending special assessments or reserve-fund shortfalls?
- Any open or pending special assessments — roof, HVAC, plumbing, elevator, façade? What's the per-unit balance and payoff schedule, and is the seller paying it off at close or rolling it to the buyer?
- Why hasn't it sold? Are there any deal-killer items the seller is aware of (foundation, flood, title, zoning, code violations)?
- Is there a deadline driving the sale (1031 exchange, divorce, estate, relocation)? That informs how much negotiation room exists.
- Schools are D-rated, which usually means shorter tenancies and higher turnover. Who's the typical renter profile here, and what's been the actual vacancy rate?
- What's the average days-on-market for RENTAL listings here right now (not sales)? A rising rental-DOM trend means longer vacancies and softer asking-rent achievability than the comps imply.
- What's the recent tenant-quality profile in this submarket — average credit score on applications, eviction rate, late-payment / NSF rate, and stable-employment percentage? A property-management company in the area should have these aggregated.
- How much new apartment / multifamily construction is in the pipeline within 1–3 miles? Heavy new supply (>2% of stock underway) typically softens rents 12–24 months out; light construction supports rent growth.
Investment metrics
- 1% rule
- 1.57% ✓
- Cap rate
- 8.97%
- Cash-on-cash
- 9.56%
- DSCR
- 1.43
- GRM
- 5.3
CMA / ARV
No comps found within radius.
Projected returns pro-forma
-3.0% appreciation · 0.0% rent growth · sell at horizon
- IRR
- -6.4%
- Equity multiple
- 0.77×
- Total profit
- $-8,509
- Equity at exit
- $19,905
- IRR
- -2.7%
- Equity multiple
- 0.85×
- Total profit
- $-5,485
- Equity at exit
- $11,543
Cash invested: $37,380 (down + closing). Projections, not guarantees.
Landlord ↔ Tenant lean methodology
- Overall (STATE)
- 87 Strongly Landlord-Friendly
- State Florida
- 87 Strongly Landlord-Friendly · R+3
- County
- — inherits STATE
- City
- — inherits STATE
ZIP-level market 33467
- Rents YoY
- -0.4%
- Active inventory
- 651
- Price-to-rent
- 5.3×
Monthly cashflow live
- Estimated rent
- $2,092 high interval (Pro) →
- Mortgage (P&I)
- −$700
- Tax from tax record
- −$24 /mo · $294/yr
- Insurance
- −$56
- HOA
- −$575
- Vacancy / Maint / Mgmt
- −$439
- Net cashflow
- $298
Break-even live
UW: 25.0% down · 7.5% · 30yr · 1.5% tax · 5.0% vac · 8.0% maint · 8.0% mgmt
Financing live
Cash to close
- Down payment
- $33,375
- Closing costs
- $4,005
- Reserves months
- —
- Total cash needed
- —
Loan-product check · same deal, 3 products live
Conventional
25% down · 7.5% · 30yr
- Down + closing
- —
- Monthly P&I
- —
- Monthly cashflow
- —
- DSCR
- —
- Eligible?
- —
Personal DTI + credit; lowest rate.
DSCR
20% down · 8.5% · 30yr
- Down + closing
- —
- Monthly P&I
- —
- Monthly cashflow
- —
- DSCR
- —
- Eligible?
- —
No personal income docs; deal must DSCR.
Hard money
10% down · 12.0% · 12mo
- Down + closing
- —
- Monthly P&I
- —
- Monthly cashflow
- —
- DSCR
- —
- Eligible?
- —
Short-term bridge; refi at stabilization.
Rent comps 40 comps
| Address | Beds | Baths | Sqft | Rent | $/sqft | DOM | Units | Dist |
|---|---|---|---|---|---|---|---|---|
| 4735 Lucerne Lakes Blvd E #410 Lake Worth, FL | 2.0 | 2.0 | 1330 | $1,700 | $1.28 | 24d | 1 | 0.07mi |
| 4725 Lucerne Lakes Blvd E Lake Worth, FL | 2.0 | 2.0 | 1330 | $1,950 | $1.47 | 7d | 2 | 0.08mi |
| 4725 Lucerne Lakes Blvd E Lake Worth, FL | 2.0 | 2.0 | 1330 | $1,950 | $1.47 | 20d | 2 | 0.08mi |
| 7593 Tahiti Ln #205 Lake Worth, FL | 2.0 | 2.0 | 1186 | $1,800 | $1.52 | 24d | 1 | 0.09mi |
| 4735 Lucerne Lakes Blvd W Unit 410 Greenacres, FL | 2.0 | 2.0 | 1330 | $1,700 | $1.28 | 22d | 1 | 0.13mi |
| 4640 Lucerne Lakes Blvd W #605 Lake Worth, FL | 2.0 | 1.0 | 900 | $1,600 | $1.78 | 15d | 1 | 0.17mi |
| 7178 Golf Colony Ct #101 Lake Worth, FL | 2.0 | 2.0 | 735 | $1,700 | $2.31 | 24d | 1 | 0.17mi |
| 7118 Golf Colony Ct #103 Lake Worth, FL | 2.0 | 2.0 | 790 | $1,725 | $2.18 | 24d | 1 | 0.17mi |
| 7281 Golf Colony Ct #204 Lake Worth, FL | 1.0 | 1.0 | 857 | $1,450 | $1.69 | 12d | 1 | 0.18mi |
| 7250 Golf Colony Ct #104 Lake Worth, FL | 2.0 | 2.0 | 815 | $1,985 | $2.44 | 24d | 1 | 0.19mi |
| 4698 Lucerne Lakes Blvd E #103 Lake Worth, FL | 2.0 | 2.0 | 1244 | $2,100 | $1.69 | 24d | 1 | 0.19mi |
| 7137 Golf Colony Ct #202 Lake Worth, FL | 2.0 | 2.0 | 735 | $1,995 | $2.71 | 15d | 1 | 0.23mi |
| 7137 Golf Colony Ct #202 Lake Worth, FL | 2.0 | 2.0 | 735 | $2,000 | $2.72 | 4d | 1 | 0.23mi |
| 4682 Lucerne Lakes Blvd E #202 Lake Worth, FL | 2.0 | 2.0 | 872 | $1,800 | $2.06 | 20d | 1 | 0.24mi |
| 4760 Lucerne Lakes Blvd W #405 Lake Worth, FL | 1.0 | 1.5 | 1000 | $1,490 | $1.49 | 24d | 1 | 0.25mi |
| 7091 Golf Colony Ct #201 Lake Worth, FL | 2.0 | 2.0 | 735 | $1,850 | $2.52 | 14d | 1 | 0.25mi |
| 7257 Golf Colony Ct #203 Lake Worth, FL | 2.0 | 2.0 | 790 | $1,950 | $2.47 | 7d | 1 | 0.25mi |
| 7149 Golf Colony Ct Lake Worth, FL | 2.0 | 2.0 | 823 | $2,075 | $2.52 | 2d | 3 | 0.25mi |
| 7149 Golf Colony Ct Lake Worth, FL | 2.0 | 2.0 | 823 | $2,098 | $2.55 | 12d | 2 | 0.25mi |
| 7149 Golf Colony Ct #104 Lake Worth, FL | 2.0 | 2.0 | 790 | $2,300 | $2.91 | 24d | 1 | 0.25mi |
| 7101 Golf Colony Ct #102 Lake Worth, FL | 2.0 | 2.0 | 790 | $2,500 | $3.16 | 24d | 1 | 0.27mi |
| 4640 Lucerne Lakes Blvd W Lake Worth, FL | 2.0 | 1.0–2.0 | 960 | $1,525 | $1.59 | 4d | 2 | 0.29mi |
| 4598 Lucerne Lakes Blvd E #101 Lake Worth, FL | 2.0 | 2.0 | 872 | $2,250 | $2.58 | 24d | 1 | 0.32mi |
| 4598 Lucerne Lakes Blvd E #101 Lake Worth, FL | 2.0 | 2.0 | 872 | $2,250 | $2.58 | 5d | 1 | 0.32mi |
| 4489 Luxemburg Ct #101 Lake Worth, FL | 2.0 | 2.0 | 1005 | $2,000 | $1.99 | 24d | 1 | 0.32mi |
| 4483 Luxemburg Ct #201 Lake Worth, FL | 3.0 | 2.0 | 1265 | $2,800 | $2.21 | 24d | 1 | 0.33mi |
| 4471 Luxemburg Ct Lake Worth, FL | 2.0 | 2.0 | 1005 | $2,150 | $2.14 | 24d | 2 | 0.36mi |
| 4471 Luxemburg Ct #101 Lake Worth, FL | 2.0 | 2.0 | 1005 | $2,300 | $2.29 | 18d | 1 | 0.36mi |
| 4539 Luxemburg Ct Lake Worth, FL | 2.0 | 2.0 | 1027 | $2,250 | $2.19 | 5d | 1 | 0.37mi |
| 4539 Luxemburg Ct Lake Worth, FL | 2.0 | 2.0 | 1005 | $2,250 | $2.24 | 24d | 1 | 0.37mi |
| 4575 Lucerne Lakes Blvd W #104 Lake Worth, FL | 1.0 | 1.0 | 900 | $1,240 | $1.38 | 12d | 1 | 0.38mi |
| 4575 Lucerne Lakes Blvd W #104 Lake Worth, FL | 1.0 | 1.0 | 900 | $1,275 | $1.42 | 7d | 1 | 0.38mi |
| 4557 Luxemburg Ct Lake Worth, FL | 2.0 | 1.5 | 1065 | $2,400 | $2.25 | 24d | 1 | 0.38mi |
| 4657 Fountains Dr S #206 Lake Worth, FL | 1.0 | 1.0 | 882 | $1,650 | $1.87 | 12d | 1 | 0.56mi |
| 4702 Fountains Dr S #207 Lake Worth, FL | 2.0 | 2.5 | 1434 | $2,600 | $1.81 | 24d | 1 | 0.57mi |
| 4702 Fountains Dr S #207 Lake Worth, FL | 2.0 | 2.5 | 1434 | $2,600 | $1.81 | 1d | 1 | 0.57mi |
| 4770 Fountains Dr S #303 Lake Worth, FL | 2.0 | 2.0 | 1434 | $2,200 | $1.53 | 2d | 1 | 0.59mi |
| 4801 Esedra Ct Lake Worth, FL | 2.0 | 2.0 | 1027 | $2,075 | $2.02 | 11d | 2 | 0.68mi |
| 4801 Esedra Ct #201 Lake Worth, FL | 2.0 | 2.0 | 1005 | $2,300 | $2.29 | 24d | 1 | 0.68mi |
| 4345 Trevi Ct #204 Lake Worth, FL | 2.0 | 2.0 | 1005 | $2,100 | $2.09 | 20d | 1 | 0.68mi |
HOA detail condo
- Monthly dues
- $575 · $6,900/yr
- Likely covers
- watersewertrashcable
- Assessments
- None detected in remarks — confirm with the listing agent.
Listing history 23 events
-
2026-06-18days on market $133,500 Active 361 DOM
-
2026-06-17days on market $133,500 Active 360 DOM
-
2026-06-16days on market $133,500 Active 359 DOM
-
2026-06-15days on market $133,500 Active 358 DOM
-
2026-06-13days on market $133,500 Active 356 DOM
-
2026-06-09days on market $133,500 Active 352 DOM
-
2026-06-07days on market $133,500 Active 350 DOM
-
2026-06-04days on market $133,500 Active 347 DOM
-
2026-06-03days on market $133,500 Active 346 DOM
-
2026-06-01days on market $133,500 Active 344 DOM
-
2026-05-31days on market $133,500 Active 343 DOM
-
2026-01-29price $133,500
-
2025-06-22$140,000 Active
-
2024-11-24historical
-
2024-08-03price $165,000
-
2024-05-23$175,000 Active
-
2024-05-14historical
-
2023-11-15$175,000 Active
-
2015-12-17soldstatus $59,000 Closed
-
2015-10-29historical Contingent
-
2015-10-02$57,900 Active
-
1996-07-03soldstatus $45,500
-
1994-05-24soldstatus $42,500
ⓘ Source: listings_history table (triggers on properties + properties_extension) + one-shot
backfill from property_details.listing_events for pre-trigger history.
Tax reassessment forecast FL · Resets to sale price
- Current annual tax
- $294 · $24/mo
- Projected year-2 tax
- $1,108 · $92/mo
- Expected delta
- +$815/yr (+$68/mo · 277.5%)
ⓘ Screening estimate from a state-policy table — verify with the county assessor before closing.
Climate risk First Street
- Flood 1/10 Low FEMA zone X (unshaded) · 0% chance over 30 yrs
- Wildfire 1/10 Low
- Heat 10/10 Extreme 7 d/yr ≥106°F today · 27 d/yr by 30 yrs out
- Wind 10/10 Extreme 99% chance of damaging wind over 30 yrs
- Air quality 2/10 Low 0 unhealthy d/yr today · 2 by 30 yrs out
Nearby sold comps map
Loading sold comps map…
Walkable amenities ~0.75 mi
Loading nearby amenities…
Taxation est. · year 1
- Rental income
- $25,106
- − Mortgage interest
- −$7,478
- − Property taxes
- −$294
- − Insurance
- −$668
- − Repairs & maintenance
- −$2,009
- − Management
- −$2,009
- − HOA
- −$6,900
- − Depreciation
- −$3,884
- Taxable income
- $1,867
- Est. tax owed @ 24.0%
- −$448
- After-tax cash flow
- $3,124/yr
For passive investors: Depreciation is non-cash, so a rental often shows a tax loss while cash-flowing — sheltering income. Rental losses are passive: they offset passive income freely, and up to $25,000/yr can offset ordinary (W-2) income if you actively participate and your MAGI is under $100k (phasing out to $0 by $150k); unused losses carry forward. On sale, claimed depreciation is recaptured at up to 25%, and gains may owe capital-gains tax (a 1031 exchange can defer both). Figures are a year-1 estimate at your 24.0% rate — not tax advice; consult a CPA.
Schools (NCES district)
- District
- Palm Beach
- NCES district ID
- 1201500
- Math proficiency
- 46% ▼ -16.00%
- Reading proficiency
- 53% ▼ -4.00%
- Median HH income
- $53,943
- Composite
- 42.72/100
- National rank
- #3160
- State rank
- #34 of 73 in FL
Livability — Greenacres
- Score
- 69/100
- State rank
- #490
- US rank
- #9008
Category grades
Schools grade is shown separately in the Schools card above.
Census & demographics
- County
- Palm Beach County · 1,438,312 people
- City population
- 65,478
- Metro
- Miami-Fort Lauderdale-Pompano Beach, FL
- Population (ZIP)
- 58,411
- Household income
- $95,739
- Rent vs Own
- Severe rent burden
- 960.0
Population outlook (Palm Beach County) Hauer SSP2
- Today (2025)
- 1,637,487 people
- By 2030
- 1,743,255 · +6.5%
- By 2040
- 1,948,712 · +19.0%
- By 2050
- 2,132,979 · +30.3%
- By 2075
- 2,530,027 · +54.5%
- By 2100
- 2,706,979 · +65.3%
Race, ethnicity, and origin ACS 2023
- Neighborhood character
- Diverse neighborhood (Simpson 0.59)
- Race & ethnicity
- White 59% Hispanic / Latino 22% Two or more races 13% Black 10% Asian 4%
- Hispanic origin (detail)
- Mexican 2% Puerto Rican 4% Cuban 4% Dominican 2%
- Common ancestry
- Romanian 4% Scotch-Irish 3% Hispanic 3%
- Foreign-born
- 24% · Canada, Jamaica, Vietnam
- Languages at home
- 71% English-only · Spanish 17% French/Haitian/Cajun 5% Other Indo-European 3%
Political lean MEDSL · Palm Beach
- 2024 margin
- Toss-up / Even · D 50.0% · R 49.2%
- 2008→2024 swing
- -22.1pp toward R · 2008: 22.9pp · 2024: 0.8pp
- All cycles
- 2024: D+0.8 2020: D+12.8 2016: D+15.3 2012: D+17.0 2008: D+22.9
Not yet ingested
- Civics
- —
Market trends
- HPI YoY
- ▼ -288.94%
- Current HPI
- 343.7738
- Rent YoY
- ▼ -0.40%
- Metro
- Miami-Fort Lauderdale-Pompano Beach, FL
- State GDP YoY
- ▲ 3.28%
- F500 in state
- 36
Industry mix (Fortune 500 HQ in FL)
| Industry | F500 HQs | Revenue |
|---|---|---|
| Industrial Technology | 2 | $29B |
|
||
| Insurance | 2 | $17B |
|
||
| Retail | 1 | $60B |
|
||
| Technology Distribution | 1 | $58B |
|
||
| Homebuilding | 1 | $35B |
|
||
| Technology Manufacturing | 1 | $35B |
|
||
Price history
+214.1% since first listed12 events — show timeline
- 2026-01-29 Price Changed $133,500 Beaches MLS
- 2025-06-22 Listed $140,000 Beaches MLS
- 2024-11-24 Listing Removed — Beaches MLS
- 2024-08-03 Price Changed $165,000 Beaches MLS
- 2024-05-23 Listed $175,000 Beaches MLS
- 2024-05-14 Listing Removed — Beaches MLS
- 2023-11-15 Listed $175,000 Beaches MLS
- 2015-12-17 Sold (MLS) $59,000 Beaches MLS
- 2015-10-29 Contingent — Beaches MLS
- 2015-10-02 Listed $57,900 Beaches MLS
- 1996-07-03 Sold (Public Records) $45,500 Public Records
- 1994-05-24 Sold (Public Records) $42,500 Public Records
Property tax history
-2.3%/yrLatest (2025): $294 · +2.8% YoY. Source: county tax records.
Cash-flow waterfall
monthlySold comps — $/sqft
last 12 mo · ≤1 miLoading sold comps…