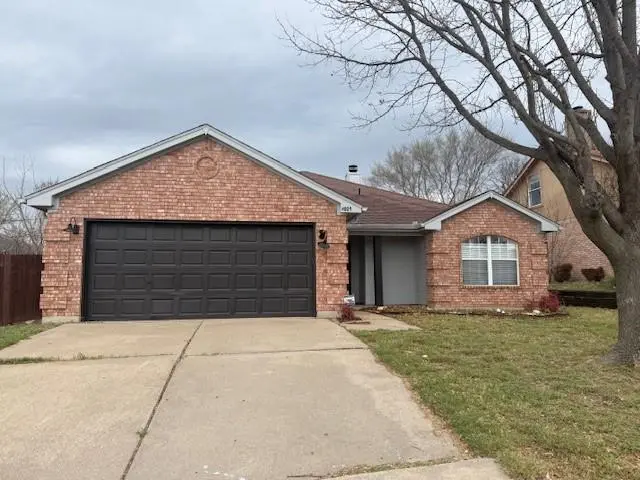
4809 Maryannes Meadow Dr · Fort Worth, TX
Flood risk 1/10 · Minimal
- FEMA flood zone
- X (unshaded)
- Chance of flooding over 30 yrs
- 0.0%
- Est. flood insurance / yr
- $507 – $1,088
Fire risk 4/10 · Minor
- Est. fire insurance / yr
- $1,222 – $2,270
Heat risk 7/10 · Major
- Hot days now (above 109°F)
- 7 days/yr
- Hot days in 30 yrs
- 24 days/yr
Wind risk 4/10 · Minor
- Chance of severe wind over 30 yrs
- 24.0%
Air-quality risk 3/10 · Minor
- Unhealthy air days now
- 3 days/yr
- Unhealthy air days in 30 yrs
- 4 days/yr
Risk factors via First Street. Map © Google.
Why this score? — see what drove the D+ grade
The composite is a weighted blend of 9 inputs, each scored 0–100. Each bar is that input's sub-score; the figure is the points it added to the 100-point composite (weight × sub-score).
- ARV discount +13.1/15.0
- Cash flow +12.7/30.0
- 1% rule +4.9/10.0
- Livability +4.0/5.0
- DSCR +3.8/10.0
- Schools +3.5/10.0
- Rent growth +2.6/5.0
- Condition / age +2.5/5.0
- Appreciation +0.0/10.0
$199,900
🖨 Deal sheet (PDF) 📄 Offer letter ✓ Due diligence
Listing remarks
Charming 3-bedroom, 2-bath home offering 1,418 sqft of potential in a convenient location. The inviting layout features a living room that opens seamlessly to the kitchen, creating a functional space for everyday living and entertaining. Outside, you’ll find a generously sized backyard with plenty of room to enjoy, garden, or expand your outdoor vision. Situated within walking distance to J. T. Hinkle Park and with easy access to Loop 820, this home combines location and opportunity. A great chance to make it your own and add personal touches to truly shine. * * * * BEST and FINAL requested today, Thursday April 23, by 5pm * * * *
Key facts
- Convenient location
- 6,926 sq ft lot
- 2 garage spots
Tags
Neighborhood map
What this means for you Summary
Snapshot
- This is a 3-bed/2.0-bath single-family listed at $200k.
Deal economics
- At list price, monthly cash flow is $-21 ($-255/yr) — negative.
- To cash-flow at today's rent, offer at most $196k (1.9% below list).
- To meet the 1% rule (rent ≥ 1% of price), the offer needs to be $199k (0.6% below list).
- Recommended offer: $196k (1.9% below list) — sets the bar for cash-flow.
- Cap rate 6.2% vs local median 3.9% in Fort Worth — top-decile yield for the area; either an underpriced asset or a hidden risk that comps aren't pricing in. Stress-test before assuming the spread holds.
Location & tenants
- Location reads 80/100 on livability (#49 in TX, #1,954 nationally) — a professional / high-income tenant draw. Strengths: amenities A+, cost of living A+, housing A+; Watch: crime F.
- Eagle Mt-Saginaw ISD (urban): math 35% / reading 42% proficiency, ranked #361 of 826 in TX (top 44%) — families likely to look elsewhere, expect single-tenant / working-renter base with shorter leases.
- Zoned schools: Greenfield El (math 47% / reading 48%, grade D, #989 of 4,322 statewide, top 23%, 690 students, 49% FRL); Ed Willkie Middle (math 35% / reading 43%, grade F, #690 of 1,662 statewide, top 42%, 730 students, 48% FRL); Chisholm Trail H S (math 27% / reading 55%, grade F, #774 of 1,632 statewide, top 49%, 2,493 students, 48% FRL).
- Market conditions: Rents flat; 160 active listings in the ZIP; 36 comparable units currently listed for rent nearby; rentals at typical pace (median 23d on market — plan ~3-4 weeks tenant-placement turnaround); 18,938 units permitted in Tarrant County in 2024 (8,336 in 5+ unit buildings).
- This rent runs 32% of the median local income ($75k/yr) — at the standard rent-burdened threshold; future hikes will face affordability resistance.
Forward outlook
- Local home prices are declining (-3.0%/yr); year-one equity from $1k of loan paydown is wiped out by about $6k of value loss. Plan a longer hold.
- Tarrant County population projected at +41% by 2050 — long-run rental-demand tailwind backs the buy-and-hold thesis.
Negotiation context
- Only 7 days on market — expect competitive offers; lowballing is unlikely to land.
- 3 sale attempts since 3y ago with the ask held roughly flat each time — persistent listings suggest the price (not the market) is what's stuck; bring a comps-based counter.
Risks & watch-outs
- Watch-outs: property tax is 2.8% of price.
- Climate carrying-cost: extreme-heat days projected 7→24/yr by 2055 (HVAC capex compounding) — expect insurance premiums to compound above CPI over the hold.
Questions for the listing agent
- What do current leases actually rent for vs. the listed asking? Can we see a recent rent roll and the last 12 months of T-12 income?
- Property tax is high relative to price — has the assessment been appealed recently, and will the sale trigger a re-assessment?
- Is there a deadline driving the sale (1031 exchange, divorce, estate, relocation)? That informs how much negotiation room exists.
- Schools are D-rated, which usually means shorter tenancies and higher turnover. Who's the typical renter profile here, and what's been the actual vacancy rate?
- Crime grade is F in this area — have there been break-ins, vandalism, or insurance claims at this property in the last 3 years? What carrier currently insures it and at what premium?
- The area grade is low — what's the realistic commute time and amenity access for the typical tenant pool here? Any planned neighborhood developments (good or bad) we should know about?
- What's the average days-on-market for RENTAL listings here right now (not sales)? A rising rental-DOM trend means longer vacancies and softer asking-rent achievability than the comps imply.
- What's the recent tenant-quality profile in this submarket — average credit score on applications, eviction rate, late-payment / NSF rate, and stable-employment percentage? A property-management company in the area should have these aggregated.
- How much new for-sale + rental construction is in the pipeline within 1–3 miles? Heavy new supply typically softens prices + rents 12–24 months out; constrained supply supports both.
Investment metrics
- 1% rule
- 0.99% ✗
- Cap rate
- 6.17%
- Cash-on-cash
- -0.46%
- DSCR
- 0.98
- GRM
- 8.4
CMA / ARV
- ARV (on-the-fly)
- $228,298
- Comps found
- 12
Show comp detail 12 sales within ~0.75 mi
| Address | Dist | Beds/Ba | Sqft | Sold | Price | $/sf | Match |
|---|---|---|---|---|---|---|---|
| 4809 Maryannes Meadow Dr | 0.00mi | 3/2.0 | 1,418 (0%) | 1mo | $199,900 | $141 | 99 |
| 6401 Loydhill Ln | 0.25mi | 3/2.0 | 1,299 (-8%) | 0mo | $249,975 | $192 | 74 |
| 4809 Brianhill Dr | 0.12mi | 3/2.0 | 1,239 (-13%) | 1mo | $199,900 | $161 | 72 |
| 4536 Hodgkins Rd | 0.48mi | 3/2.0 | 1,442 (+2%) | 5mo | $269,900 | $187 | 70 |
| 4501 Norris Valley Dr | 0.30mi | 3/2.0 | 1,291 (-9%) | 2mo | $208,000 | $161 | 70 |
| 4901 Camille Ct | 0.36mi | 3/2.0 | 1,299 (-8%) | 3mo | $249,000 | $192 | 67 |
| 4908 Camille Ct | 0.40mi | 3/1.0 | 1,321 (-7%) | 3mo | $189,999 | $144 | 64 |
| 4907 Camille Ct | 0.37mi | 3/1.0 | 1,299 (-8%) | 3mo | $199,999 | $154 | 62 |
| 6364 Basswood Dr | 0.35mi | 3/1.0 | 1,296 (-9%) | 5mo | $159,900 | $123 | 61 |
| 5240 Hill Ridge Dr | 0.55mi | 3/2.0 | 1,533 (+8%) | 2mo | $288,000 | $188 | 59 |
| 4859 Ivy Hill Ct | 0.43mi | 3/1.0 | 1,308 (-8%) | 6mo | $250,000 | $191 | 58 |
| 7000 Alice Rd | 0.70mi | 3/2.0 | 1,589 (+12%) | 5mo | $250,000 | $157 | 43 |
Match score weights: distance 35% · size 25% · config 20% · recency 20%. Top-matched comps best support the ARV.
Projected returns pro-forma
-3.0% appreciation · 0.48% rent growth · sell at horizon
- IRR
- -20.3%
- Equity multiple
- 0.31×
- Total profit
- $-38,500
- Equity at exit
- $29,806
- IRR
- -21.3%
- Equity multiple
- 0.04×
- Total profit
- $-53,793
- Equity at exit
- $17,284
Cash invested: $55,972 (down + closing). Projections, not guarantees.
Landlord ↔ Tenant lean methodology
- Overall (STATE)
- 87 Strongly Landlord-Friendly
- State Texas
- 87 Strongly Landlord-Friendly · R+5
- County
- — inherits STATE
- City
- — inherits STATE
ZIP-level market 76135
- Home prices YoY
- -17.3%
- Rents YoY
- 0.5%
- Active inventory
- 160
- Price-to-rent
- 8.4×
Monthly cashflow live
- Estimated rent
- $1,987 high interval (Pro) →
- Mortgage (P&I)
- −$1,048
- Tax from tax record
- −$459 /mo · $5,509/yr
- Insurance
- −$83
- HOA
- −$0
- Vacancy / Maint / Mgmt
- −$417
- Net cashflow
- $-21
Break-even live
Sensitivity live
| Price | -10% $92 | -5% $35 | +0% $-21 | +5% $-78 | +10% $-134 |
|---|---|---|---|---|---|
| Rent | -10% $-178 | -5% $-100 | +0% $-21 | +5% $57 | +10% $136 |
| Rate | -1.0pp $79 | -0.5pp $30 | base $-21 | +0.5pp $-73 | +1.0pp $-126 |
UW: 25.0% down · 7.5% · 30yr · 1.5% tax · 5.0% vac · 8.0% maint · 8.0% mgmt
Financing live
Cash to close
- Down payment
- $49,975
- Closing costs
- $5,997
- Reserves months
- —
- Total cash needed
- —
Loan-product check · same deal, 3 products live
Conventional
25% down · 7.5% · 30yr
- Down + closing
- —
- Monthly P&I
- —
- Monthly cashflow
- —
- DSCR
- —
- Eligible?
- —
Personal DTI + credit; lowest rate.
DSCR
20% down · 8.5% · 30yr
- Down + closing
- —
- Monthly P&I
- —
- Monthly cashflow
- —
- DSCR
- —
- Eligible?
- —
No personal income docs; deal must DSCR.
Hard money
10% down · 12.0% · 12mo
- Down + closing
- —
- Monthly P&I
- —
- Monthly cashflow
- —
- DSCR
- —
- Eligible?
- —
Short-term bridge; refi at stabilization.
Rent comps 36 comps
| Address | Beds | Baths | Sqft | Rent | $/sqft | DOM | Units | Dist |
|---|---|---|---|---|---|---|---|---|
| 4809 Maryannes Meadow Dr Fort Worth, TX | 3.0 | 2.5 | 1418 | $2,200 | $1.55 | 9d | 1 | 0.02mi |
| 4804 Deal Dr Fort Worth, TX | 3.0 | 2.0 | 1325 | $1,995 | $1.51 | 8d | 1 | 0.07mi |
| 4804 Saint Thomas Pl Fort Worth, TX | 3.0 | 2.0 | 1776 | $2,070 | $1.17 | 1d | 1 | 0.11mi |
| 4920 Lemon Grove Dr Fort Worth, TX | 3.0 | 2.0 | 1608 | $2,075 | $1.29 | 22d | 1 | 0.19mi |
| 6424 Canyon Trl Fort Worth, TX | 3.0 | 2.0 | 1801 | $2,160 | $1.20 | 14d | 1 | 0.37mi |
| 6251 Shadydell Dr Fort Worth, TX | 2.0 | 1.0 | 1009 | $1,695 | $1.68 | 19d | 1 | 0.39mi |
| 4109 Ridgecrest Cir Lake Worth, TX | 3.0 | 2.0 | 1640 | $1,850 | $1.13 | 22d | 1 | 0.59mi |
| 4400 Hodgkins Rd Lake Worth, TX | 4.0 | 1.0 | 1788 | $2,000 | $1.12 | 22d | 1 | 0.64mi |
| 4729 Oarlock Dr Fort Worth, TX | 3.0 | 2.0 | 1384 | $1,700 | $1.23 | 14d | 1 | 0.66mi |
| 5947 Shadydell Dr Fort Worth, TX | 2.0 | 1.5 | 1088 | $1,350 | $1.24 | 1d | 1 | 0.69mi |
| 5947 Shadydell Dr Fort Worth, TX | 2.0 | 1.5 | 1088 | $1,350 | $1.24 | 22d | 1 | 0.69mi |
| 5935 Shadydell Dr Fort Worth, TX | 2.0 | 1.5 | 1088 | $1,300 | $1.19 | 26d | 1 | 0.72mi |
| 4517 Compass Ct Fort Worth, TX | 2.0 | 2.0 | 1012 | $1,700 | $1.68 | 20d | 1 | 0.72mi |
| 4517 Compass Ct Fort Worth, TX | 2.0 | 2.0 | 981 | $1,700 | $1.73 | 4d | 1 | 0.72mi |
| 5911 Shadydell Dr Fort Worth, TX | 2.0 | 1.5 | 1088 | $1,350 | $1.24 | 26d | 1 | 0.77mi |
| 5837 Shadydell Dr Fort Worth, TX | 2.0 | 1.5 | 1155 | $1,500 | $1.30 | 24d | 1 | 0.85mi |
| 6201 Azle Ave Fort Worth, TX | 1.0–3.0 | 1.0–2.0 | 1039 | $2,177 | $2.09 | 0d | 22 | 0.86mi |
| 5829 Shadydell Dr Fort Worth, TX | 2.0 | 1.5 | 1088 | $1,400 | $1.29 | 26d | 1 | 0.87mi |
| 5825 Shadydell Dr #5829 Fort Worth, TX | 2.0 | 1.5 | 1088 | $1,400 | $1.29 | 26d | 1 | 0.87mi |
| 7104 Foster Dr Fort Worth, TX | 4.0 | 2.0 | 1476 | $1,925 | $1.30 | 9d | 1 | 0.99mi |
| 5743 Shadydell Dr Fort Worth, TX | 3.0 | 2.0 | 1012 | $1,795 | $1.77 | 26d | 1 | 1.00mi |
| 4025 Caddo Trl Fort Worth, TX | 3.0 | 2.0 | 1382 | $1,750 | $1.27 | 45d | 1 | 1.04mi |
| 4009 Caddo Trl Fort Worth, TX | 3.0 | 1.0 | 1237 | $1,850 | $1.50 | 45d | 1 | 1.07mi |
| 3901 Dakota Trl Fort Worth, TX | 3.0 | 2.0 | 1481 | $1,990 | $1.34 | 1d | 1 | 1.08mi |
| 3901 Dakota Trl Fort Worth, TX | 3.0 | 2.0 | 1481 | $1,990 | $1.34 | 45d | 1 | 1.08mi |
| 4009 Shawnee Trl Fort Worth, TX | 3.0 | 2.0 | 1496 | $1,801 | $1.20 | 45d | 1 | 1.12mi |
| 5817 Brookville Dr Fort Worth, TX | 3.0 | 2.0 | 1620 | $2,295 | $1.42 | 26d | 1 | 1.13mi |
| 3465 Vista Highlands Ln Fort Worth, TX | 3.0 | 2.5 | 1708 | $2,200 | $1.29 | 45d | 1 | 1.15mi |
| 6721 Lake Overlook Dr Fort Worth, TX | 3.0 | 2.0 | 1602 | $2,400 | $1.50 | 45d | 1 | 1.19mi |
| 5800 Pearl Oyster Ln Fort Worth, TX | 3.0 | 2.0 | 1858 | $2,050 | $1.10 | 20d | 1 | 1.25mi |
| 6655 Calgary Ln Fort Worth, TX | 1.0–3.0 | 1.0–2.0 | 949 | $1,359 | $1.43 | 45d | 1 | 1.28mi |
| 6037 Horse Trap Dr Fort Worth, TX | 3.0 | 2.0 | 1864 | $2,200 | $1.18 | 26d | 1 | 1.29mi |
| 5424 Royal Birkdale Dr Fort Worth, TX | 3.0 | 2.0 | 1560 | $1,820 | $1.17 | 45d | 1 | 1.31mi |
| 5308 Newcastle Ln Fort Worth, TX | 3.0 | 2.0 | 1640 | $1,781 | $1.09 | 17d | 1 | 1.35mi |
| 4700 Huffines Blvd Fort Worth, TX | 1.0–2.0 | 1.0–2.0 | 837 | $1,360 | $1.62 | 1d | 9 | 1.36mi |
| 5301 Prestwick Dr Fort Worth, TX | 3.0 | 2.0 | 1722 | $2,075 | $1.20 | 1d | 1 | 1.40mi |
Listing history 9 events
-
2026-04-24status Pending
-
2026-04-17$199,900 Active
-
2026-02-25soldstatus
-
2025-03-26$269,000 Active
-
2023-09-12historical Active Option Contract
-
2023-09-08$225,000 Active
-
2023-08-31soldstatus
-
2009-06-20soldstatus
-
1996-01-26soldstatus
ⓘ Source: listings_history table (triggers on properties + properties_extension) + one-shot
backfill from property_details.listing_events for pre-trigger history.
Tax reassessment forecast TX · Resets to sale price
- Current annual tax
- $5,509 · $459/mo
- Projected year-2 tax
- $5,509 · $459/mo
- Expected delta
- $0/yr ($0/mo · 0.0%)
ⓘ Screening estimate from a state-policy table — verify with the county assessor before closing.
Climate risk First Street
- Flood 1/10 Low FEMA zone X (unshaded) · 0% chance over 30 yrs
- Wildfire 4/10 Moderate
- Heat 7/10 Severe 7 d/yr ≥109°F today · 24 d/yr by 30 yrs out
- Wind 4/10 Moderate 24% chance of damaging wind over 30 yrs
- Air quality 3/10 Moderate 3 unhealthy d/yr today · 4 by 30 yrs out
Nearby sold comps map
Loading sold comps map…
Walkable amenities ~0.75 mi
Loading nearby amenities…
Taxation est. · year 1
- Rental income
- $23,840
- − Mortgage interest
- −$11,198
- − Property taxes
- −$5,509
- − Insurance
- −$1,000
- − Repairs & maintenance
- −$1,907
- − Management
- −$1,907
- − Depreciation
- −$5,815
- Taxable loss
- −$3,496
- Est. tax savings @ 24.0%
- +$839
- After-tax cash flow
- $584/yr
For passive investors: Depreciation is non-cash, so a rental often shows a tax loss while cash-flowing — sheltering income. Rental losses are passive: they offset passive income freely, and up to $25,000/yr can offset ordinary (W-2) income if you actively participate and your MAGI is under $100k (phasing out to $0 by $150k); unused losses carry forward. On sale, claimed depreciation is recaptured at up to 25%, and gains may owe capital-gains tax (a 1031 exchange can defer both). Figures are a year-1 estimate at your 24.0% rate — not tax advice; consult a CPA.
Schools (NCES district)
- District
- Eagle Mt-Saginaw ISD
- NCES district ID
- 4817700
- Math proficiency
- 35% ▼ -16.00%
- Reading proficiency
- 42% ▼ -9.00%
- Median HH income
- $72,781
- Composite
- 35.41/100
- National rank
- #4945
- State rank
- #361 of 826 in TX
Livability — Fort Worth
- Score
- 80/100
- State rank
- #49
- US rank
- #1954
Category grades
Schools grade is shown separately in the Schools card above.
Census & demographics
- Census place
- Fort Worth, TX
- County
- Tarrant County · 2,033,669 people
- City population
- 911,619
- Metro
- Dallas-Fort Worth-Arlington, TX
- Population (ZIP)
- 19,445
- Household income
- $74,621
- Rent vs Own
- Severe rent burden
- 798.0
Population outlook (Tarrant County) Hauer SSP2
- Today (2025)
- 2,380,417 people
- By 2030
- 2,578,900 · +8.3%
- By 2040
- 2,974,995 · +25.0%
- By 2050
- 3,350,489 · +40.8%
- By 2075
- 4,216,909 · +77.2%
- By 2100
- 4,741,527 · +99.2%
Race, ethnicity, and origin ACS 2023
- Neighborhood character
- Majority White (63%)
- Race & ethnicity
- White 63% Hispanic / Latino 26% Two or more races 11% Black 8%
- Hispanic origin (detail)
- Mexican 22%
- Common ancestry
- Italian 2% Romanian 2% Russian 2%
- Foreign-born
- 7% · Canada, Jamaica
- Languages at home
- 80% English-only · Spanish 19% Russian/Polish/Slavic 1%
Political lean MEDSL · Tarrant
- 2024 margin
- Lean R (+5.1) · D 46.7% · R 51.9% · Other 1.4%
- 2008→2024 swing
- +6.6pp toward D · 2008: -11.7pp · 2024: -5.1pp
- All cycles
- 2024: R+5.1 2020: D+0.2 2016: R+8.7 2012: R+15.7 2008: R+11.7
Not yet ingested
- Civics
- —
Market trends
- HPI YoY
- ▼ -63.93%
- Current HPI
- 305.0929
- Rent YoY
- ▲ 0.48%
- Metro
- Dallas-Fort Worth-Arlington, TX
- State GDP YoY
- ▲ 3.95%
- F500 in state
- 110
Industry mix (Fortune 500 HQ in TX)
| Industry | F500 HQs | Revenue |
|---|---|---|
| Energy | 16 | $1,198B |
|
||
| Technology | 5 | $198B |
|
||
| Engineering / Construction | 4 | $72B |
|
||
| Energy Services | 3 | $60B |
|
||
| Utilities | 3 | $41B |
|
||
| Healthcare | 2 | $330B |
|
||
Price history
-11.2% since first listed9 events — show timeline
- 2026-04-24 Pending — NTREIS
- 2026-04-17 Listed $199,900 NTREIS
- 2026-02-25 Sold (Public Records) — Public Records
- 2025-03-26 Listed $269,000 NTREIS
- 2023-09-12 Contingent — NTREIS
- 2023-09-08 Listed $225,000 NTREIS
- 2023-08-31 Sold (Public Records) — Public Records
- 2009-06-20 Sold (Public Records) — Public Records
- 1996-01-26 Sold (Public Records) — Public Records
Property tax history
+4.6%/yrLatest (2025): $5,509 · -8.8% YoY. Source: county tax records.
Cash-flow waterfall
monthlySold comps — $/sqft
last 12 mo · ≤1 miLoading sold comps…