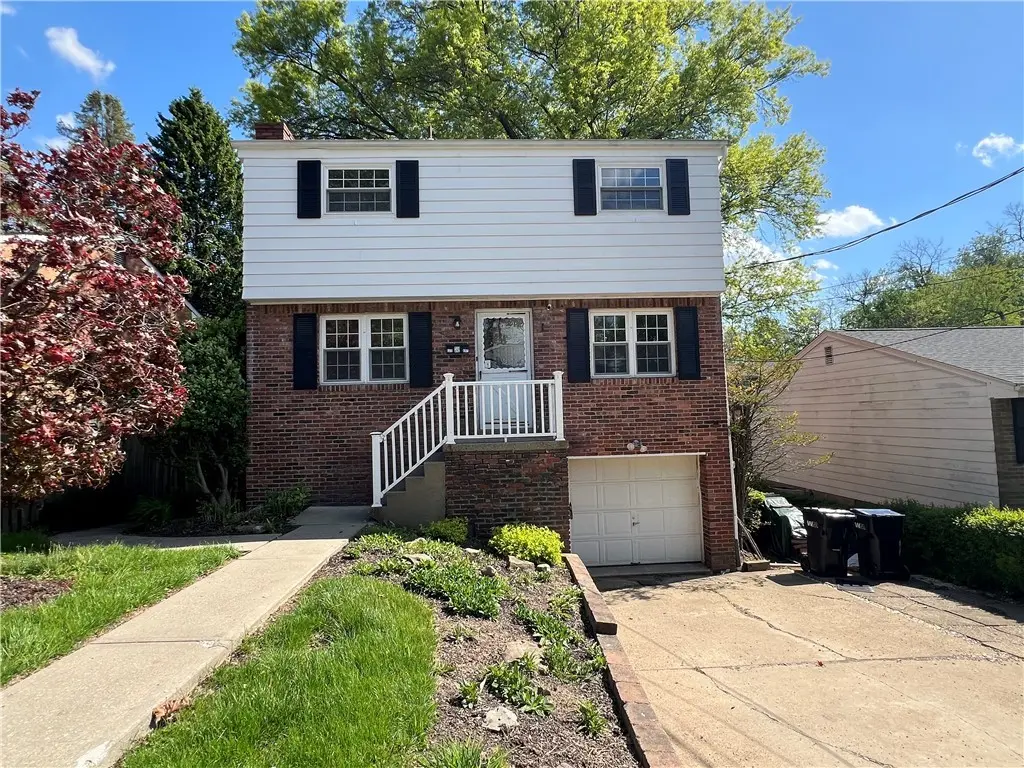
555 Lee Ave Ext · Franklin Park, PA
Flood risk 1/10 · Minimal
- FEMA flood zone
- X (unshaded)
- Chance of flooding over 30 yrs
- 0.0%
- Est. flood insurance / yr
- $473 – $860
Fire risk 1/10 · Minimal
- Est. fire insurance / yr
- $511 – $949
Heat risk 3/10 · Minor
- Hot days now (above 97°F)
- 7 days/yr
- Hot days in 30 yrs
- 17 days/yr
Wind risk 2/10 · Minimal
- Chance of severe wind over 30 yrs
- 0.0%
Air-quality risk 4/10 · Minor
- Unhealthy air days now
- 3 days/yr
- Unhealthy air days in 30 yrs
- 6 days/yr
Risk factors via First Street. Map © Google.
Why this score? — see what drove the C- grade
The composite is a weighted blend of 9 inputs, each scored 0–100. Each bar is that input's sub-score; the figure is the points it added to the 100-point composite (weight × sub-score).
- ARV discount +15.0/15.0
- Cash flow +13.5/30.0
- Schools +5.2/10.0
- 1% rule +4.3/10.0
- DSCR +4.1/10.0
- Livability +3.3/5.0
- Rent growth +3.0/5.0
- Condition / age +2.5/5.0
- Appreciation +0.0/10.0
$225,000
🖨 Deal sheet 📄 Offer letter ✓ Due diligence
Listing remarks
Welcome to 555 Lee Avenue Ext, a charming brick-and-siding Colonial home. Fantastic opportunity located in a wonderful North Hills community! Much larger than it appears with the added Great Room featuring vaulted ceilings and a floor to ceiling brick fireplace! Hardwood flooring, partial finished basement for a game room and bar area. Conveniently located off RT19 close to shopping and restaurants.
Key facts
- 5,009 sq ft lot
- Garage
- Built 1954
Property features AI
Exterior
- Parking: Attached garage with garage door opener; Built-in parking; Total of 1 parking space
- Utilities: Public water; Public sewer
- Home design: 2-story residence; Resale property
- Construction: Aluminum siding and brick exterior; Asphalt roof
- Exterior features: 50 x 100 (approx.) lot dimensions
Interior
- Kitchen: Stove; Dishwasher; Some gas appliances
- Bedrooms: Upper level bedroom — 11 x 8; Upper level bedroom — 13 x 10; Upper level bedroom — 14 x 10
- Flooring: Carpet; Hardwood; Vinyl
- Bathrooms: 1 full bathroom; 1 half bathroom
- Heating & cooling: Forced air gas heating; Central air conditioning
- Interior features: Partially finished walk-out basement; Fireplace in family/living/great room
- Laundry & utility: Has basement (utility space)
Neighborhood map
What this means for you Summary
Snapshot
- This is a 3-bed/1.0-bath single-family listed at $225k.
Deal economics
- At list price, monthly cash flow is $9 ($112/yr) — positive.
- The deal already cash-flows at list — no discount required.
- To meet the 1% rule (rent ≥ 1% of price), the offer needs to be $208k (7.5% below list).
- Recommended offer: $208k (7.5% below list) — sets the bar for 1% rule.
- Cap rate 6.3% vs local median 2.6% in Franklin Park — top-decile yield for the area; either an underpriced asset or a hidden risk that comps aren't pricing in. Stress-test before assuming the spread holds.
Location & tenants
- Location reads 66/100 on livability (#1,070 in PA) — a middle-class / working-renter tenant base. Strengths: crime A+, employment A+, housing A+; Watch: schools D, amenities F, commute F.
- North Hills SD (suburban): math 48% / reading 72% proficiency, ranked #70 of 539 in PA (top 13%) — acceptable for families but not a draw, mixed tenant base, ~2y average lease; only 20% free/reduced lunch — higher-income household profile.
- Market conditions: Rents rising (+2.2%/yr); 104 active listings in the ZIP; 5 comparable units currently listed for rent nearby; rentals at typical pace (median 24d on market — plan ~3-4 weeks tenant-placement turnaround); 40% of comp listings sitting > 30 days — soft ceiling on asking rent; solid renter incomes; 2,996 units permitted in Allegheny County in 2024 (1,588 in 5+ unit buildings).
Forward outlook
- Local home prices are declining (-3.0%/yr); year-one equity from $2k of loan paydown is wiped out by about $7k of value loss. Plan a longer hold.
Negotiation context
- Only 4 days on market — expect competitive offers; lowballing is unlikely to land.
Risks & watch-outs
- Watch-outs: built in 1954 — expect roof / HVAC / electrical / plumbing capex.
Questions for the listing agent
- Built in 1954 — when were the roof, HVAC, electrical panel, plumbing, and water heater last replaced?
- Is there a deadline driving the sale (1031 exchange, divorce, estate, relocation)? That informs how much negotiation room exists.
- Schools are D-rated, which usually means shorter tenancies and higher turnover. Who's the typical renter profile here, and what's been the actual vacancy rate?
- What's the average days-on-market for RENTAL listings here right now (not sales)? A rising rental-DOM trend means longer vacancies and softer asking-rent achievability than the comps imply.
- What's the recent tenant-quality profile in this submarket — average credit score on applications, eviction rate, late-payment / NSF rate, and stable-employment percentage? A property-management company in the area should have these aggregated.
- How much new for-sale + rental construction is in the pipeline within 1–3 miles? Heavy new supply typically softens prices + rents 12–24 months out; constrained supply supports both.
Investment metrics
- 1% rule
- 0.93% ✗
- Cap rate
- 6.34%
- Cash-on-cash
- 0.18%
- DSCR
- 1.01
- GRM
- 9.0
CMA / ARV
- ARV (median comp)
- $304,456
- List price
- $225,000
- Delta
- -26.10%
- Verdict
- UNDERPRICED
- Comps
- 20 within 1.0 mi
Show comp detail 12 sales within ~0.75 mi
| Address | Dist | Beds/Ba | Sqft | Sold | Price | $/sf | Match |
|---|---|---|---|---|---|---|---|
| 555 Lee Ave Ext | 0.00mi | 3/1.5 | 1,513 (0%) | 0mo | $265,000 | $175 | 98 |
| 7914 Hemlock St | 0.04mi | 3/1.5 | 1,512 (-0%) | 1mo | $275,900 | $182 | 95 |
| 605 Lee Ave Ext | 0.04mi | 3/1.0 | 1,366 (-10%) | 9mo | $250,000 | $183 | 74 |
| 518 Lincoln Ave | 0.12mi | 4/1.5 (+1) | 1,450 (-4%) | 7mo | $350,000 | $241 | 74 |
| 170 Mayer Dr | 0.18mi | 3/2.5 | 1,440 (-5%) | 8mo | $299,000 | $208 | 71 |
| 98 Buckhill Rd | 0.37mi | 3/2.5 | 1,480 (-2%) | 9mo | $325,000 | $220 | 66 |
| 8225 E Van Buren Dr | 0.40mi | 3/1.5 | 1,638 (+8%) | 2mo | $350,500 | $214 | 64 |
| 103 Buckhill Rd | 0.50mi | 3/2.5 | 1,398 (-8%) | 5mo | $299,900 | $215 | 54 |
| 388 Highview St | 0.57mi | 3/2.0 | 1,652 (+9%) | 1mo | $399,000 | $242 | 53 |
| 205 Sandle Ave | 0.46mi | 3/2.0 | 1,329 (-12%) | 3mo | $291,000 | $219 | 52 |
| 555 Madison St | 0.74mi | 3/2.0 | 1,547 (+2%) | 10mo | $400,000 | $259 | 49 |
| 103 Mayer Dr | 0.58mi | 2/3.0 (-1) | 1,575 (+4%) | 7mo | $325,000 | $206 | 47 |
Match score weights: distance 35% · size 25% · config 20% · recency 20%. Top-matched comps best support the ARV.
Projected returns pro-forma
-3.0% appreciation · 2.16% rent growth · sell at horizon
- IRR
- -17.0%
- Equity multiple
- 0.40×
- Total profit
- $-37,530
- Equity at exit
- $33,548
- IRR
- -10.5%
- Equity multiple
- 0.39×
- Total profit
- $-38,627
- Equity at exit
- $19,454
Cash invested: $63,000 (down + closing). Projections, not guarantees.
Landlord ↔ Tenant lean methodology
- Overall (STATE)
- 62 Landlord-Friendly
- State Pennsylvania
- 62 Landlord-Friendly · EVEN
- County
- — inherits STATE
- City
- — inherits STATE
ZIP-level market 15237
- Rents YoY
- 2.2%
- Active inventory
- 104
- Price-to-rent
- 9.0×
Monthly cashflow live
- Estimated rent
- $2,082 high interval (Pro) →
- Mortgage (P&I)
- −$1,180
- Tax from tax record
- −$362 /mo · $4,343/yr
- Insurance
- −$94
- HOA
- −$0
- Vacancy / Maint / Mgmt
- −$437
- Net cashflow
- $9
Break-even live
UW: 25.0% down · 7.5% · 30yr · 1.5% tax · 5.0% vac · 8.0% maint · 8.0% mgmt
Financing live
Cash to close
- Down payment
- $56,250
- Closing costs
- $6,750
- Reserves months
- —
- Total cash needed
- —
Loan-product check · same deal, 3 products live
Conventional
25% down · 7.5% · 30yr
- Down + closing
- —
- Monthly P&I
- —
- Monthly cashflow
- —
- DSCR
- —
- Eligible?
- —
Personal DTI + credit; lowest rate.
DSCR
20% down · 8.5% · 30yr
- Down + closing
- —
- Monthly P&I
- —
- Monthly cashflow
- —
- DSCR
- —
- Eligible?
- —
No personal income docs; deal must DSCR.
Hard money
10% down · 12.0% · 12mo
- Down + closing
- —
- Monthly P&I
- —
- Monthly cashflow
- —
- DSCR
- —
- Eligible?
- —
Short-term bridge; refi at stabilization.
Rent comps 5 comps
| Address | Beds | Baths | Sqft | Rent | $/sqft | DOM | Units | Dist |
|---|---|---|---|---|---|---|---|---|
| 180 Montclair Ave Pittsburgh, PA | 3.0 | 1.0 | 1050 | $1,895 | $1.80 | 23d | 1 | 0.77mi |
| 1050 N 19 Dr Pittsburgh, PA | 1.0–2.0 | 1.0–1.5 | 890 | $1,860 | $2.09 | 1d | 7 | 1.09mi |
| 143 Aberdeen Ct Pittsburgh, PA | 3.0 | 3.5 | 1400 | $2,600 | $1.86 | 4d | 1 | 1.11mi |
| 159 Mohican Ave Pittsburgh, PA | 3.0 | 2.0 | 1360 | $2,100 | $1.54 | 43d | 1 | 1.43mi |
| 114 Tally Dr Pittsburgh, PA | 1.0–3.0 | 1.0–2.0 | 847 | $1,450 | $1.71 | 43d | 5 | 1.47mi |
Listing history 2 events
-
2026-05-09status Pending 404-char remark
-
2026-05-05$225,000 Active 404-char remark
ⓘ Source: listings_history table (triggers on properties + properties_extension) + one-shot
backfill from property_details.listing_events for pre-trigger history.
Tax reassessment forecast PA · Partial reset (capped growth)
- Current annual tax
- $4,343 · $362/mo
- Projected year-2 tax
- $4,343 · $362/mo
- Expected delta
- $0/yr ($0/mo · 0.0%)
ⓘ Screening estimate from a state-policy table — verify with the county assessor before closing.
Climate risk First Street
- Flood 1/10 Low FEMA zone X (unshaded) · 0% chance over 30 yrs
- Wildfire 1/10 Low
- Heat 3/10 Moderate 7 d/yr ≥97°F today · 17 d/yr by 30 yrs out
- Wind 2/10 Low 0% chance of damaging wind over 30 yrs
- Air quality 4/10 Moderate 3 unhealthy d/yr today · 6 by 30 yrs out
Nearby sold comps map
Loading sold comps map…
Walkable amenities ~0.75 mi
Loading nearby amenities…
Taxation est. · year 1
- Rental income
- $24,986
- − Mortgage interest
- −$12,603
- − Property taxes
- −$4,343
- − Insurance
- −$1,125
- − Repairs & maintenance
- −$1,999
- − Management
- −$1,999
- − Depreciation
- −$6,545
- Taxable loss
- −$3,629
- Est. tax savings @ 24.0%
- +$871
- After-tax cash flow
- $983/yr
For passive investors: Depreciation is non-cash, so a rental often shows a tax loss while cash-flowing — sheltering income. Rental losses are passive: they offset passive income freely, and up to $25,000/yr can offset ordinary (W-2) income if you actively participate and your MAGI is under $100k (phasing out to $0 by $150k); unused losses carry forward. On sale, claimed depreciation is recaptured at up to 25%, and gains may owe capital-gains tax (a 1031 exchange can defer both). Figures are a year-1 estimate at your 24.0% rate — not tax advice; consult a CPA.
Schools (NCES district)
- District
- North Hills SD
- NCES district ID
- 4217220
- Math proficiency
- 48% ▼ -20.00%
- Reading proficiency
- 72% ▼ -10.00%
- Median HH income
- $60,841
- Composite
- 52.02/100
- National rank
- #1637
- State rank
- #70 of 539 in PA
Livability — Franklin Park
- Score
- 66/100
- State rank
- #1070
- US rank
- #12082
Category grades
Schools grade is shown separately in the Schools card above.
Census & demographics
- County
- Allegheny County · 1,022,028 people
- Metro
- Pittsburgh, PA
- Population (ZIP)
- 43,588
- Household income
- $109,895
- Rent vs Own
- Severe rent burden
- 693.0
Population outlook (Allegheny County) Hauer SSP2
- Today (2025)
- 1,250,282 people
- By 2030
- 1,256,482 · +0.5%
- By 2040
- 1,256,318 · +0.5%
- By 2050
- 1,244,169 · -0.5%
- By 2075
- 1,197,693 · -4.2%
- By 2100
- 1,093,187 · -12.6%
Race, ethnicity, and origin ACS 2023
- Neighborhood character
- Predominantly White (88%)
- Race & ethnicity
- White 88% Asian 6% Two or more races 3% Hispanic / Latino 3% Black 1%
- Common ancestry
- Romanian 8% Italian 2% Slovak 2%
- Foreign-born
- 8% · Canada, China
- Languages at home
- 90% English-only · Other Indo-European 2% Chinese 2% Spanish 2%
Political lean MEDSL · Allegheny
- 2024 margin
- Strong D (+20.3) · D 59.7% · R 39.4%
- 2008→2024 swing
- +4.8pp toward D · 2008: 15.5pp · 2024: 20.3pp
- All cycles
- 2024: D+20.3 2020: D+20.4 2016: D+16.4 2012: D+14.4 2008: D+15.5
Not yet ingested
- Civics
- —
Market trends
- HPI YoY
- ▼ -218.78%
- Current HPI
- 269.5446
- Rent YoY
- ▲ 2.16%
- Metro
- Pittsburgh, PA
- State GDP YoY
- ▲ 1.68%
- F500 in state
- 34
Industry mix (Fortune 500 HQ in PA)
| Industry | F500 HQs | Revenue |
|---|---|---|
| Healthcare | 2 | $309B |
|
||
| Insurance | 2 | $27B |
|
||
| Telecommunications / Media | 1 | $124B |
|
||
| Industrial Distribution | 1 | $22B |
|
||
| Financial Services | 1 | $20B |
|
||
| Chemicals / Materials | 1 | $18B |
|
||
Price history
+17.8% since first listed3 events — show timeline
- 2026-06-10 Sold (MLS) $265,000 West Penn MLS
- 2026-05-09 Pending — West Penn MLS
- 2026-05-05 Listed $225,000 West Penn MLS
Property tax history
+2.0%/yrLatest (2026): $4,343 · +1.0% YoY. Source: county tax records.
Cash-flow waterfall
monthlySold comps — $/sqft
last 12 mo · ≤1 miLoading sold comps…