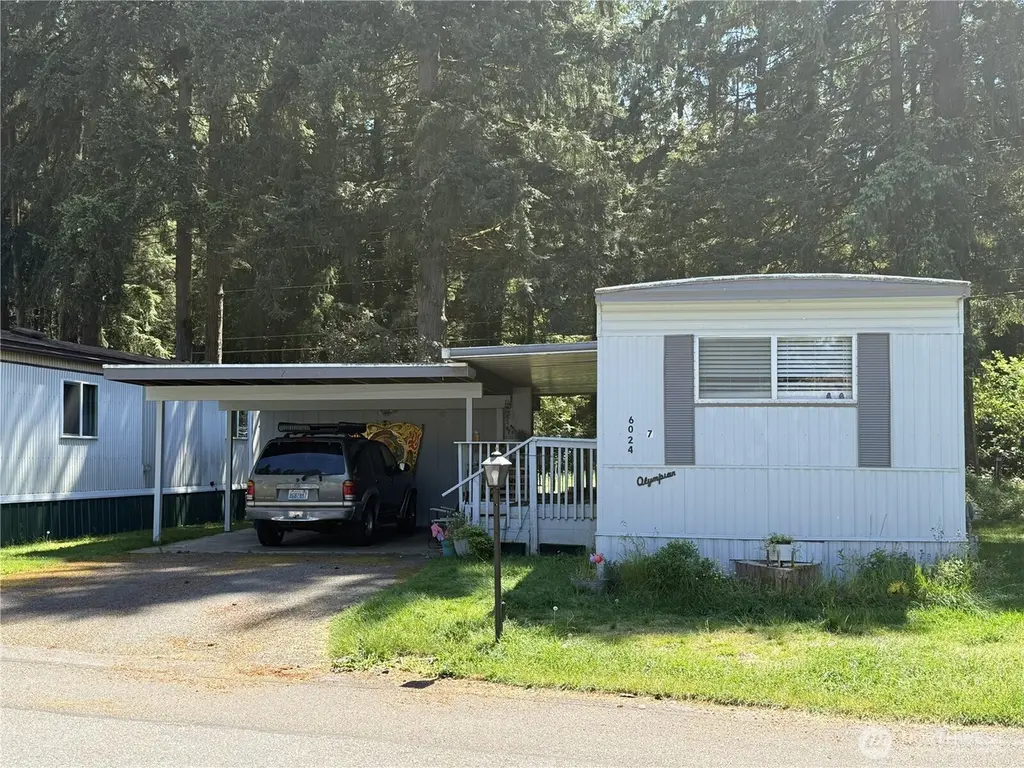
6024 79th Street Ct E #7 · Waller, WA
Flood risk 1/10 · Minimal
- FEMA flood zone
- X (unshaded)
- Chance of flooding over 30 yrs
- 0.0%
- Est. flood insurance / yr
- $507 – $1,088
Fire risk 1/10 · Minimal
- Est. fire insurance / yr
- $604 – $1,122
Heat risk 3/10 · Minor
- Hot days now (above 87°F)
- 7 days/yr
- Hot days in 30 yrs
- 15 days/yr
Wind risk 1/10 · Minimal
- Chance of severe wind over 30 yrs
- —
Air-quality risk 7/10 · Major
- Unhealthy air days now
- 11 days/yr
- Unhealthy air days in 30 yrs
- 12 days/yr
Risk factors via First Street. Map © Google.
Why this score? — see what drove the C- grade
The composite is a weighted blend of 9 inputs, each scored 0–100. Each bar is that input's sub-score; the figure is the points it added to the 100-point composite (weight × sub-score).
- Cash flow +15.0/30.0
- ARV discount +15.0/15.0
- Schools +5.4/10.0
- 1% rule +5.0/10.0
- DSCR +5.0/10.0
- Livability +3.5/5.0
- Rent growth +2.9/5.0
- Condition / age +2.5/5.0
- Appreciation +0.0/10.0
$29,950
🖨 Deal sheet 📄 Offer letter ✓ Due diligence
Listing remarks
Charming 55+ Crestview Community Single Wide - ready for you! Enjoy convenient single-level living with an open floor plan & plentiful natural light throughout. An open kitchen boasts plentiful space for pantry storage & meal preparation. Don't miss the beautiful built-ins through the dining room! The primary bedroom boasts ample closet space & an ensuite bathroom. An additional bedroom is ready to adapt to your various needs. Space rent covers Water & Sewer - Park Approval Required for Sale. The central location offers easy access to Downtown Puyallup, Canyon Rd, WA-512, and more!
Key facts
- Open floor plan
- Beautiful built-ins
- Ample closet space
Tags
Property features AI
Finance
- Other: Senior community; Power provided by Tacoma Public Utilities; Double pane windows (energy efficient)
- Financial info: Listing terms: Cash or Conventional
- HOA & community: Located in a manufactured home park (approved for sale); Park amenities: clubhouse, common area, laundry; Approximately 40 homes in the park; Land lease: $900/month; Mobile home remains
Exterior
- Parking: Carport
- Utilities: Electric power; Shared well water (water included in park dues); Sewer service included in park dues
- Home design: Manufactured single-wide home; One story; Northwest-facing; Good condition; Model: olympian
- Construction: Metal/vinyl construction materials; Metal roof; Tie down foundation; Manufactured house (single wide)
- Exterior features: Metal/vinyl exterior; Patio/Porch/Deck; Landscaped; Paved and secluded lot
Interior
- Kitchen: Dishwasher; Refrigerator; Stove/Range
- Bedrooms: 2 bedrooms
- Flooring: Vinyl; Carpet
- Bathrooms: 1 full bath (includes 1 bathtub and 1 shower)
- Heating & cooling: Forced air heating; Forced air cooling
- Interior features: Water heater (electric); Vaulted ceilings; Bath off primary; Dining room; Entry; Kitchen with eating space; Living room
- Laundry & utility: Washer; Dryer; Water heater located in utility closet
Neighborhood map
What this means for you Summary
Snapshot
- This is a 2-bed/2.0-bath manufactured listed at $30k.
Deal economics
- At list price, monthly cash flow is $1k ($14k/yr) — positive.
- The deal already cash-flows at list — no discount required.
- Meets the 1% rule at list price ($2k rent vs $30k).
- Cap rate 53.8% vs local median 2.1% in Waller — top-decile yield for the area; either an underpriced asset or a hidden risk that comps aren't pricing in. Stress-test before assuming the spread holds.
Location & tenants
- Location reads 69/100 on livability (#254 in WA) — a middle-class / working-renter tenant base. Strengths: employment A+, housing A+, crime B; Watch: health & safety C-, commute D+, schools D-.
- Puyallup School District (suburban): math 53% / reading 66% proficiency, ranked #52 of 291 in WA (top 18%) — acceptable for families but not a draw, mixed tenant base, ~2y average lease.
- Market conditions: Rents rising (+1.4%/yr); 227 active listings in the ZIP; solid renter incomes; 3,209 units permitted in Pierce County in 2024 (1,269 in 5+ unit buildings).
Forward outlook
- Local home prices are declining (-3.0%/yr); year-one equity from $208 of loan paydown is wiped out by about $898 of value loss. Plan a longer hold.
- Pierce County population projected at +26% by 2050 — long-run rental-demand tailwind backs the buy-and-hold thesis.
- At projected returns (-3.0% appreciation + 1.4% rent growth), your $8k cash investment doubles in ~1 year — after that, you're playing with house money.
Negotiation context
- Only 6 days on market — expect competitive offers; lowballing is unlikely to land.
Questions for the listing agent
- Built in 1972 — when were the roof, HVAC, electrical panel, plumbing, and water heater last replaced?
- Is there a deadline driving the sale (1031 exchange, divorce, estate, relocation)? That informs how much negotiation room exists.
- Schools are D-rated, which usually means shorter tenancies and higher turnover. Who's the typical renter profile here, and what's been the actual vacancy rate?
- What's the average days-on-market for RENTAL listings here right now (not sales)? A rising rental-DOM trend means longer vacancies and softer asking-rent achievability than the comps imply.
- What's the recent tenant-quality profile in this submarket — average credit score on applications, eviction rate, late-payment / NSF rate, and stable-employment percentage? A property-management company in the area should have these aggregated.
- How much new for-sale + rental construction is in the pipeline within 1–3 miles? Heavy new supply typically softens prices + rents 12–24 months out; constrained supply supports both.
Investment metrics
- 1% rule
- 5.87% ✓
- Cap rate
- 53.85%
- Cash-on-cash
- 169.83%
- DSCR
- 8.56
- GRM
- 1.4
CMA / ARV
- ARV (on-the-fly)
- $38,304
- Comps found
- 2
Show comp detail 2 sales within ~0.75 mi
| Address | Dist | Beds/Ba | Sqft | Sold | Price | $/sf | Match |
|---|---|---|---|---|---|---|---|
| 6016 79th Street Ct E #11 | 0.02mi | 2/1.0 | 672 (0%) | 3mo | $38,000 | $57 | 93 |
| 5911 79th Street Ct E #24 | 0.09mi | 2/1.0 | 720 (+7%) | 9mo | $30,000 | $42 | 73 |
Match score weights: distance 35% · size 25% · config 20% · recency 20%. Top-matched comps best support the ARV.
Projected returns pro-forma
-3.0% appreciation · 1.41% rent growth · sell at horizon
- IRR
- —
- Equity multiple
- 9.11×
- Total profit
- $67,993
- Equity at exit
- $4,466
- IRR
- —
- Equity multiple
- 18.37×
- Total profit
- $145,633
- Equity at exit
- $2,590
Cash invested: $8,386 (down + closing). Projections, not guarantees.
Landlord ↔ Tenant lean methodology
- Overall (STATE)
- 28 Tenant-Leaning
- State Washington
- 28 Tenant-Leaning · D+8
- County
- — inherits STATE
- City
- — inherits STATE
ZIP-level market 98371
- Rents YoY
- 1.4%
- Active inventory
- 227
- Price-to-rent
- 1.4×
Monthly cashflow live
- Estimated rent
- $1,759 medium interval (Pro) →
- Mortgage (P&I)
- −$157
- Tax from tax record
- −$33 /mo · $394/yr
- Insurance
- −$12
- HOA
- −$0
- Vacancy / Maint / Mgmt
- −$369
- Net cashflow
- $1,187
Break-even live
UW: 25.0% down · 7.5% · 30yr · 1.5% tax · 5.0% vac · 8.0% maint · 8.0% mgmt
Financing live
Cash to close
- Down payment
- $7,488
- Closing costs
- $898
- Reserves months
- —
- Total cash needed
- —
Loan-product check · same deal, 3 products live
Conventional
25% down · 7.5% · 30yr
- Down + closing
- —
- Monthly P&I
- —
- Monthly cashflow
- —
- DSCR
- —
- Eligible?
- —
Personal DTI + credit; lowest rate.
DSCR
20% down · 8.5% · 30yr
- Down + closing
- —
- Monthly P&I
- —
- Monthly cashflow
- —
- DSCR
- —
- Eligible?
- —
No personal income docs; deal must DSCR.
Hard money
10% down · 12.0% · 12mo
- Down + closing
- —
- Monthly P&I
- —
- Monthly cashflow
- —
- DSCR
- —
- Eligible?
- —
Short-term bridge; refi at stabilization.
Listing history 6 events
-
2026-06-18days on market $29,950 Active 6 DOM
-
2026-06-17days on market $29,950 Active 5 DOM
-
2026-06-16days on market $29,950 Active 4 DOM
-
2026-06-15days on market $29,950 Active 3 DOM
-
2026-06-13remarks 596-char remark
-
2026-06-13$29,950 Active 1 DOM
ⓘ Source: listings_history table (triggers on properties + properties_extension) + one-shot
backfill from property_details.listing_events for pre-trigger history.
Tax reassessment forecast WA · Resets to sale price
- Current annual tax
- $394 · $33/mo
- Projected year-2 tax
- $394 · $33/mo
- Expected delta
- $0/yr ($0/mo · 0.0%)
ⓘ Screening estimate from a state-policy table — verify with the county assessor before closing.
Climate risk First Street
- Flood 1/10 Low FEMA zone X (unshaded) · 0% chance over 30 yrs
- Wildfire 1/10 Low
- Heat 3/10 Moderate 7 d/yr ≥87°F today · 15 d/yr by 30 yrs out
- Wind 1/10 Low
- Air quality 7/10 Severe 11 unhealthy d/yr today · 12 by 30 yrs out
Nearby sold comps map
Loading sold comps map…
Walkable amenities ~0.75 mi
Loading nearby amenities…
Taxation est. · year 1
- Rental income
- $21,102
- − Mortgage interest
- −$1,678
- − Property taxes
- −$394
- − Insurance
- −$150
- − Repairs & maintenance
- −$1,688
- − Management
- −$1,688
- − Depreciation
- −$871
- Taxable income
- $14,633
- Est. tax owed @ 24.0%
- −$3,512
- After-tax cash flow
- $10,730/yr
For passive investors: Depreciation is non-cash, so a rental often shows a tax loss while cash-flowing — sheltering income. Rental losses are passive: they offset passive income freely, and up to $25,000/yr can offset ordinary (W-2) income if you actively participate and your MAGI is under $100k (phasing out to $0 by $150k); unused losses carry forward. On sale, claimed depreciation is recaptured at up to 25%, and gains may owe capital-gains tax (a 1031 exchange can defer both). Figures are a year-1 estimate at your 24.0% rate — not tax advice; consult a CPA.
Schools (NCES district)
- District
- Puyallup School District
- NCES district ID
- 5306960
- Math proficiency
- 53% ▬ 0.00%
- Reading proficiency
- 66% ▬ 0.00%
- Median HH income
- $68,291
- Composite
- 54.01/100
- National rank
- #3006
- State rank
- #52 of 291 in WA
Livability — Waller
- Score
- 69/100
- State rank
- #254
- US rank
- #8174
Category grades
Schools grade is shown separately in the Schools card above.
Census & demographics
- Census place
- Waller, WA
- County
- Pierce County · 788,257 people
- City population
- 5,787
- Metro
- Seattle-Tacoma-Bellevue, WA
- Population (ZIP)
- 24,682
- Household income
- $97,242
- Rent vs Own
- Severe rent burden
- 507.0
Population outlook (Pierce County) Hauer SSP2
- Today (2025)
- 956,648 people
- By 2030
- 1,010,862 · +5.7%
- By 2040
- 1,113,170 · +16.4%
- By 2050
- 1,206,524 · +26.1%
- By 2075
- 1,436,425 · +50.2%
- By 2100
- 1,563,654 · +63.5%
Race, ethnicity, and origin ACS 2023
- Neighborhood character
- Predominantly White (70%)
- Race & ethnicity
- White 70% Two or more races 12% Hispanic / Latino 11% Asian 6% Black 4%
- Hispanic origin (detail)
- Mexican 9%
- Common ancestry
- Portuguese 5% Slovak 3% Italian 2%
- Foreign-born
- 10% · Canada, South Korea, Vietnam
- Languages at home
- 85% English-only · Spanish 5% Korean 2% Vietnamese 2%
Political lean MEDSL · Pierce
- 2024 margin
- D (+10.8) · D 53.9% · R 43.1% · Other 3.0%
- 2008→2024 swing
- -1.4pp toward R · 2008: 12.2pp · 2024: 10.8pp
- All cycles
- 2024: D+10.8 2020: D+11.2 2016: D+7.5 2012: D+11.0 2008: D+12.2
Not yet ingested
- Civics
- —
Market trends
- HPI YoY
- ▼ -580.45%
- Current HPI
- 295.2143
- Rent YoY
- ▲ 1.41%
- Metro
- Seattle-Tacoma-Bellevue, WA
- State GDP YoY
- ▲ 4.65%
- F500 in state
- 22
Industry mix (Fortune 500 HQ in WA)
| Industry | F500 HQs | Revenue |
|---|---|---|
| Retail | 2 | $269B |
|
||
| Technology / Retail | 1 | $638B |
|
||
| Technology | 1 | $245B |
|
||
| Telecommunications | 1 | $38B |
|
||
| Food / Beverage | 1 | $36B |
|
||
| Automotive / Trucks | 1 | $34B |
|
||
Price history
1 event — show timeline
- 2026-06-12 Listed $29,950 NWMLS as Distributed by MLS Grid
Property tax history
+19.5%/yrLatest (2026): $394 · +16.9% YoY. Source: county tax records.
Cash-flow waterfall
monthlySold comps — $/sqft
last 12 mo · ≤1 miLoading sold comps…