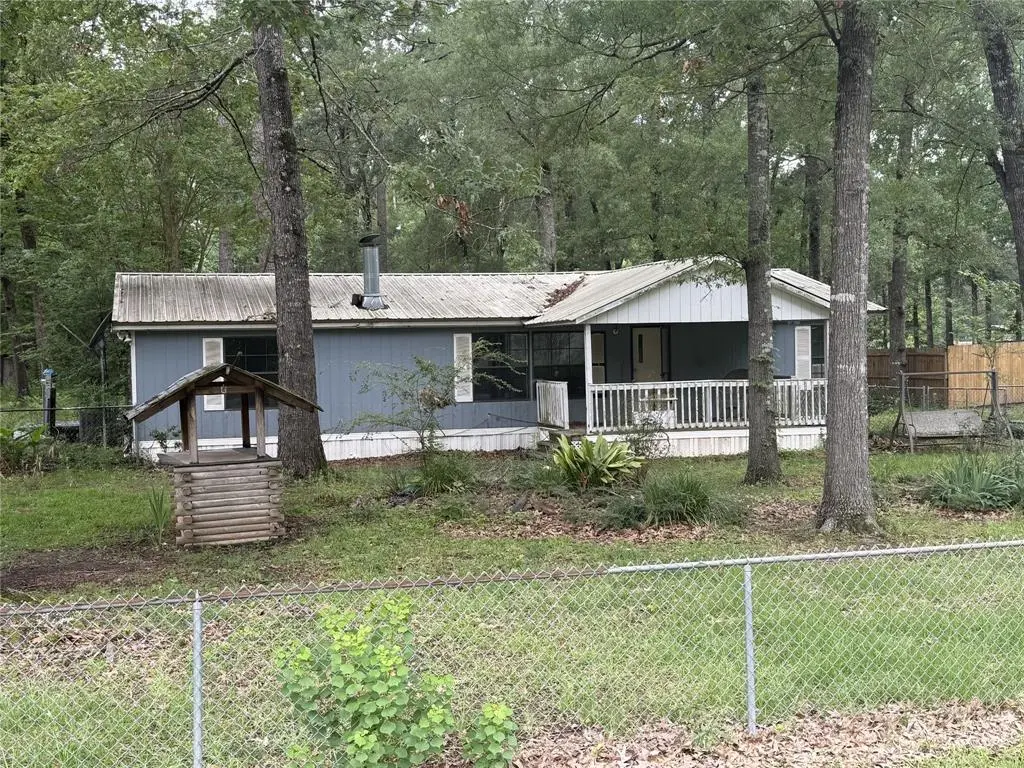
1001 Trey Ave · Benton, LA
Flood risk 1/10 · Minimal
- FEMA flood zone
- X (unshaded)
- Chance of flooding over 30 yrs
- 0.0%
- Est. flood insurance / yr
- $507 – $1,088
Fire risk 3/10 · Minor
- Est. fire insurance / yr
- $1,269 – $2,357
Heat risk 7/10 · Major
- Hot days now (above 111°F)
- 7 days/yr
- Hot days in 30 yrs
- 22 days/yr
Wind risk 6/10 · Moderate
- Chance of severe wind over 30 yrs
- 61.0%
Air-quality risk 1/10 · Minimal
- Unhealthy air days now
- 0 days/yr
- Unhealthy air days in 30 yrs
- 0 days/yr
Risk factors via First Street. Map © Google.
Why this score? — see what drove the B+ grade
The composite is a weighted blend of 9 inputs, each scored 0–100. Each bar is that input's sub-score; the figure is the points it added to the 100-point composite (weight × sub-score).
- Cash flow +30.0/30.0
- ARV discount +15.0/15.0
- DSCR +10.0/10.0
- 1% rule +9.9/10.0
- Schools +3.8/10.0
- Livability +3.6/5.0
- Rent growth +2.5/5.0
- Condition / age +2.5/5.0
- Appreciation +0.0/10.0
$110,000
🖨 Deal sheet 📄 Offer letter ✓ Due diligence
Listing remarks
Enjoy peaceful country living in the highly desirable Benton area! This well-maintained 3-bedroom, 2-bath manufactured home sits on nearly an acre, offering plenty of space to enjoy the outdoors while still being conveniently located near top-rated schools. Inside, you'll find a comfortable and functional layout designed for everyday living. The spacious lot provides endless possibilities for gardening, recreation, or simply relaxing and enjoying the quiet surroundings. Recent maintenance includes the septic system being professionally pumped in 2025, giving added peace of mind to the next owner. Whether you're looking for your first home, a place to downsize, or an investment opportunity,
Key facts
- Spacious lot
- Top-rated schools
- Quiet surroundings
Tags
Property features AI
Finance
- Financial info: Treat as clear loan type; No second mortgage
- HOA & community: No association
Exterior
- Parking: 2 covered parking spaces; 2-car garage; Driveway
- Utilities: Septic system; Well water; No municipal utility district
- Home design: Single family residence; One story; Residential property; Not attached to another property
- Construction: Built in 1994; Shingle roof; Pillar/post/pier foundation
- Exterior features: Patio; Lot in Cypress Forest subdivision; Lot approximately 0.89 acres
Interior
- Kitchen: Dishwasher; Electric cooktop; Electric oven; Refrigerator; Built-in cabinets; Eat-in kitchen
- Bedrooms: 3 bedrooms (all on the main level); Primary bedroom with ensuite bathroom (main level)
- Flooring: Carpet; Vinyl
- Bathrooms: 2 full bathrooms
- Heating & cooling: Central heating (electric); Central air conditioning (electric)
- Interior features: Built-in features; Eat-in kitchen; One living area; One dining area; Room count: 4; Fireplace (wood burning)
- Laundry & utility: Utility room
Neighborhood map
What this means for you Summary
Snapshot
- This is a 3-bed/2.0-bath manufactured listed at $110k.
Deal economics
- At list price, monthly cash flow is $537 ($6k/yr) — positive.
- The deal already cash-flows at list — no discount required.
- Meets the 1% rule at list price ($2k rent vs $110k).
- Recommended offer: $108k (1.5% below list) — sets the bar for market timing.
- Cap rate 12.2% vs local median 3.4% in Benton — top-decile yield for the area; either an underpriced asset or a hidden risk that comps aren't pricing in. Stress-test before assuming the spread holds.
Location & tenants
- Location reads 72/100 on livability (#41 in LA) — a middle-class / working-renter tenant base. Strengths: cost of living A+, housing A+, crime A; Watch: amenities F, commute F, health & safety F.
- Bossier Parish (urban): math 40% / reading 47% proficiency, ranked #17 of 98 in LA (top 17%) — families likely to look elsewhere, expect single-tenant / working-renter base with shorter leases.
- Zoned schools: Bossier Elementary School (math 8% / reading 17%, grade F, #550 of 646 statewide, top 88%, 222 students, 93% FRL) — zoned schools average 93% FRL vs 41% district-wide (52 pts higher); higher-poverty schools than district average — tighter screening recommended.
- Zoned-school proficiency averages 12% at this address vs 44% district-wide (-31 pts) — the specific schools serving this property underperform the Bossier Parish average; the district grade overstates school quality for this exact location.
- Market conditions: 201 active listings in the ZIP; 716 units permitted in Bossier Parish in 2024 (0 in 5+ unit buildings).
Forward outlook
- Local home prices are declining (-3.0%/yr); year-one equity from $761 of loan paydown is wiped out by about $3k of value loss. Plan a longer hold.
- Bossier County population projected at +28% by 2050 — long-run rental-demand tailwind backs the buy-and-hold thesis.
- At projected returns (-3.0% appreciation + 3.0% rent growth), your $31k cash investment doubles in ~6 years — after that, you're playing with house money.
Negotiation context
- It's been on market 16 days — a 2% lower offer ($108k) is reasonable based on typical stale-listing flexibility.
- Current owner paid $70k; list at $110k implies a 57% gain — meaningful room to come down on a strong offer.
Risks & watch-outs
- Climate carrying-cost: major wind risk, 61% chance of damaging wind over 30y; extreme-heat days projected 7→22/yr by 2055 (HVAC capex compounding) — expect insurance premiums to compound above CPI over the hold.
Questions for the listing agent
- Is there a deadline driving the sale (1031 exchange, divorce, estate, relocation)? That informs how much negotiation room exists.
- Schools are A-rated — typically a magnet for longer-tenancy family renters. What's the average tenant stay here, and is there a school-zone premium baked into asking?
- What's the average days-on-market for RENTAL listings here right now (not sales)? A rising rental-DOM trend means longer vacancies and softer asking-rent achievability than the comps imply.
- What's the recent tenant-quality profile in this submarket — average credit score on applications, eviction rate, late-payment / NSF rate, and stable-employment percentage? A property-management company in the area should have these aggregated.
- How much new for-sale + rental construction is in the pipeline within 1–3 miles? Heavy new supply typically softens prices + rents 12–24 months out; constrained supply supports both.
Investment metrics
- 1% rule
- 1.49% ✓
- Cap rate
- 12.15%
- Cash-on-cash
- 20.92%
- DSCR
- 1.93
- GRM
- 5.6
CMA / ARV
- ARV (on-the-fly)
- $135,378
- Comps found
- 1
Show comp detail 1 sale within ~0.75 mi
| Address | Dist | Beds/Ba | Sqft | Sold | Price | $/sf | Match |
|---|---|---|---|---|---|---|---|
| 1020 Chase Way | 0.38mi | 3/2.0 | 1,280 (+3%) | 18mo | $140,000 | $109 | 62 |
Match score weights: distance 35% · size 25% · config 20% · recency 20%. Top-matched comps best support the ARV.
Projected returns pro-forma
-3.0% appreciation · 3.0% rent growth · sell at horizon
- IRR
- 13.3%
- Equity multiple
- 1.53×
- Total profit
- $16,402
- Equity at exit
- $16,401
- IRR
- 22.2%
- Equity multiple
- 2.90×
- Total profit
- $58,423
- Equity at exit
- $9,511
Cash invested: $30,800 (down + closing). Projections, not guarantees.
Landlord ↔ Tenant lean methodology
- Overall (STATE)
- 90 Strongly Landlord-Friendly
- State Louisiana
- 90 Strongly Landlord-Friendly · R+12
- County
- — inherits STATE
- City
- — inherits STATE
ZIP-level market 71006
- Home prices YoY
- -30.4%
- Active inventory
- 201
- Price-to-rent
- 5.6×
Monthly cashflow live
- Estimated rent
- $1,642 medium interval (Pro) →
- Mortgage (P&I)
- −$577
- Tax est. 1.5%
- −$138 /mo · $1,650/yr
- Insurance
- −$46
- HOA
- −$0
- Vacancy / Maint / Mgmt
- −$345
- Net cashflow
- $537
Break-even live
UW: 25.0% down · 7.5% · 30yr · 1.5% tax · 5.0% vac · 8.0% maint · 8.0% mgmt
Financing live
Cash to close
- Down payment
- $27,500
- Closing costs
- $3,300
- Reserves months
- —
- Total cash needed
- —
Loan-product check · same deal, 3 products live
Conventional
25% down · 7.5% · 30yr
- Down + closing
- —
- Monthly P&I
- —
- Monthly cashflow
- —
- DSCR
- —
- Eligible?
- —
Personal DTI + credit; lowest rate.
DSCR
20% down · 8.5% · 30yr
- Down + closing
- —
- Monthly P&I
- —
- Monthly cashflow
- —
- DSCR
- —
- Eligible?
- —
No personal income docs; deal must DSCR.
Hard money
10% down · 12.0% · 12mo
- Down + closing
- —
- Monthly P&I
- —
- Monthly cashflow
- —
- DSCR
- —
- Eligible?
- —
Short-term bridge; refi at stabilization.
Listing history 12 events
-
2026-06-18days on market $110,000 Active 16 DOM
-
2026-06-17days on market $110,000 Active 15 DOM
-
2026-06-16days on market $110,000 Active 14 DOM
-
2026-06-15days on market $110,000 Active 13 DOM
-
2026-06-14days on market $110,000 Active 11 DOM
-
2026-06-13days on market $110,000 Active 10 DOM
-
2026-06-10days on market $110,000 Active 8 DOM
-
2026-06-09days on market $110,000 Active 7 DOM
-
2026-06-08days on market $110,000 Active 6 DOM
-
2026-06-07days on market $110,000 Active 5 DOM
-
2026-06-03remarks 699-char remark
-
2026-06-03$110,000 Active 1 DOM
ⓘ Source: listings_history table (triggers on properties + properties_extension) + one-shot
backfill from property_details.listing_events for pre-trigger history.
Climate risk First Street
- Flood 1/10 Low FEMA zone X (unshaded) · 0% chance over 30 yrs
- Wildfire 3/10 Moderate
- Heat 7/10 Severe 7 d/yr ≥111°F today · 22 d/yr by 30 yrs out
- Wind 6/10 Major 61% chance of damaging wind over 30 yrs
- Air quality 1/10 Low 0 unhealthy d/yr today · 0 by 30 yrs out
Nearby sold comps map
Loading sold comps map…
Walkable amenities ~0.75 mi
Loading nearby amenities…
Taxation est. · year 1
- Rental income
- $19,704
- − Mortgage interest
- −$6,162
- − Property taxes
- −$1,650
- − Insurance
- −$550
- − Repairs & maintenance
- −$1,576
- − Management
- −$1,576
- − Depreciation
- −$3,200
- Taxable income
- $4,990
- Est. tax owed @ 24.0%
- −$1,198
- After-tax cash flow
- $5,246/yr
For passive investors: Depreciation is non-cash, so a rental often shows a tax loss while cash-flowing — sheltering income. Rental losses are passive: they offset passive income freely, and up to $25,000/yr can offset ordinary (W-2) income if you actively participate and your MAGI is under $100k (phasing out to $0 by $150k); unused losses carry forward. On sale, claimed depreciation is recaptured at up to 25%, and gains may owe capital-gains tax (a 1031 exchange can defer both). Figures are a year-1 estimate at your 24.0% rate — not tax advice; consult a CPA.
Schools (NCES district)
- District
- Bossier Parish
- NCES district ID
- 2200270
- Math proficiency
- 40% ▼ -32.00%
- Reading proficiency
- 47% ▼ -28.00%
- Median HH income
- $51,326
- Composite
- 37.5/100
- National rank
- #4402
- State rank
- #17 of 98 in LA
Livability — Benton
- Score
- 72/100
- State rank
- #41
- US rank
- #6159
Category grades
Schools grade is shown separately in the Schools card above.
Census & demographics
- Population (ZIP)
- 15,341
Population outlook (Bossier County) Hauer SSP2
- Today (2025)
- 143,247 people
- By 2030
- 151,802 · +6.0%
- By 2040
- 168,194 · +17.4%
- By 2050
- 183,533 · +28.1%
- By 2075
- 217,009 · +51.5%
- By 2100
- 230,091 · +60.6%
Race, ethnicity, and origin ACS 2023
- Neighborhood character
- Predominantly White (77%)
- Race & ethnicity
- White 77% Two or more races 11% Black 9% Hispanic / Latino 3%
- Common ancestry
- Italian 7% Lithuanian 4% Iranian 2%
- Foreign-born
- 1% · Vietnam, Canada
- Languages at home
- 98% English-only · Spanish 1% Vietnamese 1%
Political lean MEDSL · Bossier
- 2024 margin
- Solid R (+43.3) · D 27.7% · R 71.0% · Other 1.3%
- 2008→2024 swing
- +0.3pp no change · 2008: -43.7pp · 2024: -43.3pp
- All cycles
- 2024: R+43.3 2020: R+41.0 2016: R+45.8 2012: R+45.4 2008: R+43.7
Not yet ingested
- Civics
- —
Market trends
- HPI YoY
- ▼ -72.62%
- Current HPI
- 166.3435
- Rent YoY
- —
- Metro
- —
- State GDP YoY
- ▲ 3.29%
- F500 in state
- 10
Industry mix (Fortune 500 HQ in LA)
| Industry | F500 HQs | Revenue |
|---|---|---|
| Telecommunications | 2 | $23B |
|
||
| Utilities | 1 | $12B |
|
||
| Wholesale / Distribution | 1 | $5B |
|
||
| Advertising | 1 | $2B |
|
||
Price history
+120.0% since first listed3 events — show timeline
- 2026-06-02 Listed $110,000 NTREIS
- 2006-05-05 Sold (Public Records) $70,000 Public Records
- 1997-04-14 Sold (Public Records) $50,000 Public Records
Property tax history
-20.0%/yrLatest (2025): $36 · +0.0% YoY. Source: county tax records.
Cash-flow waterfall
monthlySold comps — $/sqft
last 12 mo · ≤1 miLoading sold comps…