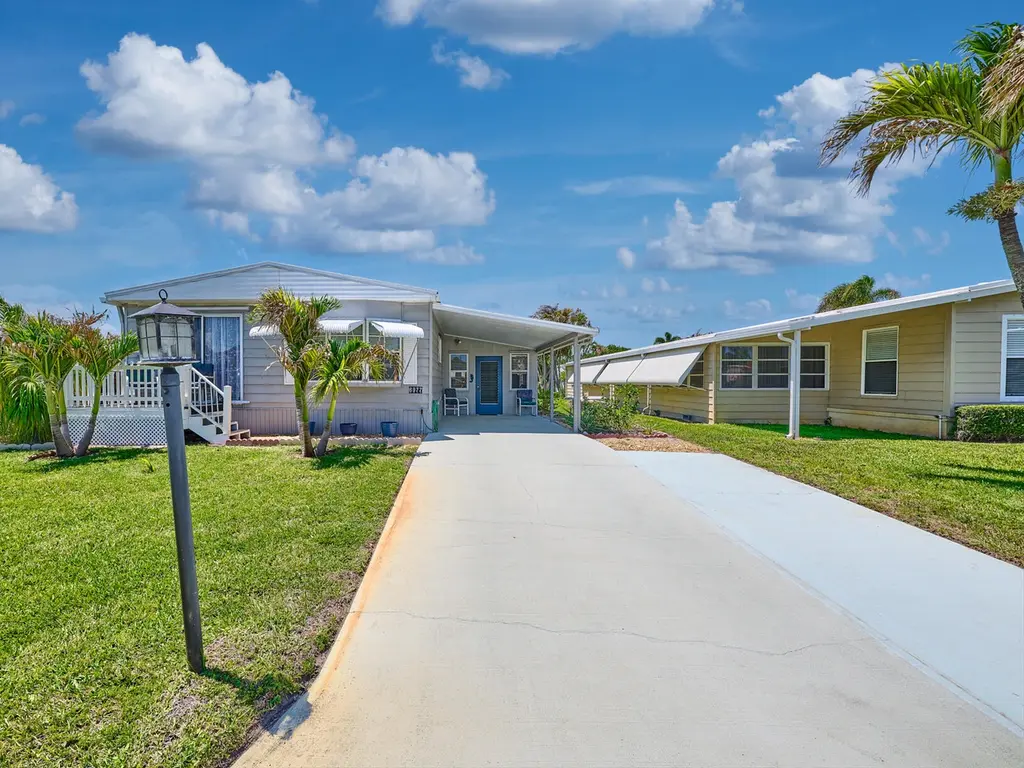
6977 SE Delegate St · Hobe Sound, FL
Flood risk 1/10 · Minimal
- FEMA flood zone
- X (unshaded)
- Chance of flooding over 30 yrs
- 0.0%
- Est. flood insurance / yr
- $507 – $1,088
Fire risk 3/10 · Minor
- Est. fire insurance / yr
- $947 – $1,759
Heat risk 10/10 · Severe
- Hot days now (above 106°F)
- 7 days/yr
- Hot days in 30 yrs
- 24 days/yr
Wind risk 10/10 · Severe
- Chance of severe wind over 30 yrs
- 99.0%
Air-quality risk 2/10 · Minimal
- Unhealthy air days now
- 1 days/yr
- Unhealthy air days in 30 yrs
- 1 days/yr
Risk factors via First Street. Map © Google.
Why this score? — see what drove the D+ grade
The composite is a weighted blend of 9 inputs, each scored 0–100. Each bar is that input's sub-score; the figure is the points it added to the 100-point composite (weight × sub-score).
- Cash flow +20.1/30.0
- DSCR +6.4/10.0
- 1% rule +5.2/10.0
- Schools +4.5/10.0
- Livability +3.5/5.0
- Rent growth +3.0/5.0
- Condition / age +2.5/5.0
- ARV discount +0.0/15.0
- Appreciation +0.0/10.0
$225,000
🖨 Deal sheet 📄 Offer letter ✓ Due diligence
Listing remarks
Charming, Seaside Cottage feeling, doublewide in Cambridge, 55 + community in Hobe Sound. Coastal paint colors throughout! Sunny front porch to enjoy the sunrises & sunsets while having your morning coffee or evening refreshmentsl. The Living Room & Dining Area are light filled w a Bay window & Slider to the outside facing South. The Galley kitchen is so convenient w lots of cabinets. The owners have many Friends visiting so made many different areas to welcome them. The flooring throughout is luxury vinyl planking adding to the beachy feel. The Primary Bedrm spans the entire width of the home w a huge walk in closet, & another bay window & ensuite bath. The 2nd
Key facts
- Galley kitchen
- Bay window
- Sunny front porch
Tags
Property features AI
Finance
- Other: Directions to property provided by listing
- Financial info: Pets allowed with no restrictions
- HOA & community: Has association (Heritage Ridge South POA); Monthly HOA fee of $125; HOA covers cable TV, common areas, recreation facility; Association amenities include pool, fitness center, billiard room, shuffleboard court, community room, library, recreation facilities; Senior community
Exterior
- Parking: 3 total parking spaces; Attached carport (1 covered carport space); 2 open parking spaces; Concrete parking surface
- Security: No specific security features listed
- Utilities: Public water; Public sewer and septic tank; Cable available
- Home design: Manufactured home; One story; Resale condition; Faces south
- Construction: Pre-fab construction / other construction materials; Roof over
- Exterior features: Fruit tree(s); No waterfront
Interior
- Kitchen: Electric range; Microwave; Refrigerator; Electric water heater
- Bedrooms: 2 bedrooms on main level
- Flooring: Ceramic tile; Vinyl
- Bathrooms: 2 full bathrooms on main level
- Heating & cooling: Central electric heating; Central air; Ceiling fan(s)
- Interior features: Walk-in closet(s); Sliding windows; Partially furnished
- Laundry & utility: Washer/dryer details not provided
Neighborhood map
What this means for you Summary
Snapshot
- This is a 2-bed/2.0-bath manufactured listed at $225k.
Deal economics
- At list price, monthly cash flow is $278 ($3k/yr) — positive.
- The deal already cash-flows at list — no discount required.
- Meets the 1% rule at list price ($2k rent vs $225k).
- Recommended offer: $222k (1.5% below list) — sets the bar for market timing.
- Cap rate 7.8% vs local median 3.5% in Hobe Sound — top-decile yield for the area; either an underpriced asset or a hidden risk that comps aren't pricing in. Stress-test before assuming the spread holds.
Location & tenants
- Location reads 69/100 on livability (#497 in FL) — a middle-class / working-renter tenant base. Strengths: housing A+, crime A, cost of living A; Watch: employment C-, amenities F, commute F.
- Martin (suburban): math 52% / reading 53% proficiency, ranked #24 of 73 in FL (top 33%) — acceptable for families but not a draw, mixed tenant base, ~2y average lease.
- Zoned schools: Murray Middle School (math 45% / reading 43%, grade D, #327 of 571 statewide, top 57%, 616 students, 69% FRL); South Fork High School (math 36% / reading 48%, grade F, #275 of 667 statewide, top 42%, 1,810 students, 51% FRL) — zoned schools average 60% FRL vs 41% district-wide (19 pts higher); higher-poverty schools than district average — tighter screening recommended.
- Market conditions: Rents rising (+1.8%/yr); 279 active listings in the ZIP; 21 comparable units currently listed for rent nearby; rentals at typical pace (median 24d on market — plan ~3-4 weeks tenant-placement turnaround); 737 units permitted in Martin County in 2024 (167 in 5+ unit buildings).
- This rent runs 39% of the median local income ($70k/yr) — at the standard rent-burdened threshold; future hikes will face affordability resistance.
Forward outlook
- Local home prices are declining (-3.0%/yr); year-one equity from $2k of loan paydown is wiped out by about $7k of value loss. Plan a longer hold.
- Martin County population projected at +19% by 2050 — long-run rental-demand tailwind backs the buy-and-hold thesis.
Negotiation context
- It's been on market 25 days — a 2% lower offer ($222k) is reasonable based on typical stale-listing flexibility.
- 3 sale attempts since 23y ago with the ask held roughly flat each time — persistent listings suggest the price (not the market) is what's stuck; bring a comps-based counter.
- Current owner paid $180k; 25% above their basis — modest negotiation headroom, anchor on the comps not their cost.
Risks & watch-outs
- Climate carrying-cost: severe wind risk, 99% chance of damaging wind over 30y; extreme-heat days projected 7→24/yr by 2055 (HVAC capex compounding) — expect insurance premiums to compound above CPI over the hold.
Questions for the listing agent
- Built in 1979 — when were the roof, HVAC, electrical panel, plumbing, and water heater last replaced?
- What does the HOA fee cover, when was the last increase, and are there any pending special assessments or reserve-fund shortfalls?
- Is there a deadline driving the sale (1031 exchange, divorce, estate, relocation)? That informs how much negotiation room exists.
- The area grade is low — what's the realistic commute time and amenity access for the typical tenant pool here? Any planned neighborhood developments (good or bad) we should know about?
- What's the average days-on-market for RENTAL listings here right now (not sales)? A rising rental-DOM trend means longer vacancies and softer asking-rent achievability than the comps imply.
- What's the recent tenant-quality profile in this submarket — average credit score on applications, eviction rate, late-payment / NSF rate, and stable-employment percentage? A property-management company in the area should have these aggregated.
- How much new for-sale + rental construction is in the pipeline within 1–3 miles? Heavy new supply typically softens prices + rents 12–24 months out; constrained supply supports both.
Investment metrics
- 1% rule
- 1.02% ✓
- Cap rate
- 7.78%
- Cash-on-cash
- 5.30%
- DSCR
- 1.24
- GRM
- 8.2
CMA / ARV
- ARV (on-the-fly)
- $190,256
- Comps found
- 12
Show comp detail 12 sales within ~0.75 mi
| Address | Dist | Beds/Ba | Sqft | Sold | Price | $/sf | Match |
|---|---|---|---|---|---|---|---|
| 7184 SE Redbird Cir | 0.30mi | 2/2.0 | 1,080 (-0%) | 2mo | $190,000 | $176 | 84 |
| 7878 SE Swan Ave | 0.26mi | 2/2.0 | 999 (-8%) | 2mo | $154,000 | $154 | 74 |
| 6900 SE Congress St | 0.11mi | 2/2.0 | 960 (-11%) | 3mo | $138,000 | $144 | 74 |
| 7829 SE Eagle Ave | 0.32mi | 2/2.0 | 1,152 (+7%) | 2mo | $207,000 | $180 | 73 |
| 8217 SE Swan Ave | 0.19mi | 2/2.0 | 960 (-11%) | 2mo | $196,000 | $204 | 70 |
| 8301 SE Skylark Ave | 0.39mi | 2/1.0 | 1,020 (-6%) | 1mo | $213,000 | $209 | 67 |
| 7148 SE Seahawk St | 0.33mi | 3/2.0 (+1) | 1,180 (+9%) | 1mo | $205,000 | $174 | 63 |
| 7107 SE Seahawk St | 0.30mi | 2/2.0 | 1,236 (+14%) | 1mo | $215,000 | $174 | 61 |
| 8500 SE Eagle Ave | 0.42mi | 2/2.0 | 960 (-11%) | 4mo | $135,000 | $141 | 58 |
| 7338 SE Redbird Cir | 0.32mi | 3/2.0 (+1) | 1,224 (+13%) | 1mo | $202,000 | $165 | 57 |
| 7667 SE Swan Ave | 0.44mi | 2/1.0 | 920 (-15%) | 1mo | $185,000 | $201 | 50 |
| 7359 SE Eagle Ave | 0.70mi | 2/2.0 | 958 (-11%) | 2mo | $220,000 | $230 | 47 |
Match score weights: distance 35% · size 25% · config 20% · recency 20%. Top-matched comps best support the ARV.
Projected returns pro-forma
-3.0% appreciation · 1.8% rent growth · sell at horizon
- IRR
- -9.4%
- Equity multiple
- 0.66×
- Total profit
- $-21,462
- Equity at exit
- $33,548
- IRR
- -1.7%
- Equity multiple
- 0.89×
- Total profit
- $-6,757
- Equity at exit
- $19,454
Cash invested: $63,000 (down + closing). Projections, not guarantees.
Landlord ↔ Tenant lean methodology
- Overall (STATE)
- 87 Strongly Landlord-Friendly
- State Florida
- 87 Strongly Landlord-Friendly · R+3
- County
- — inherits STATE
- City
- — inherits STATE
ZIP-level market 33455
- Rents YoY
- 1.8%
- Active inventory
- 279
- Price-to-rent
- 8.2×
Monthly cashflow live
- Estimated rent
- $2,295 high interval (Pro) →
- Mortgage (P&I)
- −$1,180
- Tax from tax record
- −$136 /mo · $1,635/yr
- Insurance
- −$94
- HOA
- −$125
- Vacancy / Maint / Mgmt
- −$482
- Net cashflow
- $278
Break-even live
UW: 25.0% down · 7.5% · 30yr · 1.5% tax · 5.0% vac · 8.0% maint · 8.0% mgmt
Financing live
Cash to close
- Down payment
- $56,250
- Closing costs
- $6,750
- Reserves months
- —
- Total cash needed
- —
Loan-product check · same deal, 3 products live
Conventional
25% down · 7.5% · 30yr
- Down + closing
- —
- Monthly P&I
- —
- Monthly cashflow
- —
- DSCR
- —
- Eligible?
- —
Personal DTI + credit; lowest rate.
DSCR
20% down · 8.5% · 30yr
- Down + closing
- —
- Monthly P&I
- —
- Monthly cashflow
- —
- DSCR
- —
- Eligible?
- —
No personal income docs; deal must DSCR.
Hard money
10% down · 12.0% · 12mo
- Down + closing
- —
- Monthly P&I
- —
- Monthly cashflow
- —
- DSCR
- —
- Eligible?
- —
Short-term bridge; refi at stabilization.
Rent comps 21 comps
| Address | Beds | Baths | Sqft | Rent | $/sqft | DOM | Units | Dist |
|---|---|---|---|---|---|---|---|---|
| 6948 SE Delegate St Hobe Sound, FL | 2.0 | 2.0 | 840 | $1,775 | $2.11 | 23d | 1 | 0.06mi |
| 7030 SE Ridgeway Ter Hobe Sound, FL | 3.0 | 2.0 | 1296 | $2,500 | $1.93 | 23d | 1 | 0.25mi |
| 8002 SE Skylark Ave Hobe Sound, FL | 3.0 | 2.0 | 990 | $2,000 | $2.02 | 23d | 1 | 0.28mi |
| 7894 SE Saratoga Dr Hobe Sound, FL | 2.0 | 2.0 | 1248 | $2,100 | $1.68 | 23d | 1 | 0.29mi |
| 7568 SE Swan Ave Hobe Sound, FL | 2.0 | 2.0 | 1052 | $2,300 | $2.19 | 23d | 1 | 0.49mi |
| 7462 SE Jamestown Ter Hobe Sound, FL | 2.0 | 2.0 | 1384 | $2,500 | $1.81 | 23d | 1 | 0.62mi |
| 7607 SE Hobe Ter Hobe Sound, FL | 2.0 | 2.0 | 1156 | $2,200 | $1.90 | 14d | 1 | 0.62mi |
| 7442 SE Jamestown Ter Hobe Sound, FL | 2.0 | 2.0 | 1384 | $1,800 | $1.30 | 23d | 1 | 0.66mi |
| 7445 SE Independence Ave Hobe Sound, FL | 2.0 | 2.0 | 1198 | $1,900 | $1.59 | 23d | 1 | 0.69mi |
| 8905 SE Sandy Ln Hobe Sound, FL | 2.0 | 2.0 | 1006 | $1,850 | $1.84 | 23d | 1 | 0.82mi |
| 8997 SE Sandy Ln Hobe Sound, FL | 2.0 | 1.0 | 900 | $2,000 | $2.22 | 23d | 1 | 0.89mi |
| 9073 SE Hobe Ridge Ave Hobe Sound, FL | 2.0 | 2.0 | 1029 | $2,100 | $2.04 | 14d | 1 | 0.97mi |
| 6215 SE Georgetown Pl Hobe Sound, FL | 2.0 | 2.0 | 1202 | $2,600 | $2.16 | 23d | 1 | 1.08mi |
| 8014 SE Carlton St Hobe Sound, FL | 3.0 | 2.0 | 1463 | $3,500 | $2.39 | 23d | 1 | 1.17mi |
| 7959 SE Woodview Ter Hobe Sound, FL | 1.0 | 1.0 | 700 | $1,675 | $2.39 | 23d | 4 | 1.25mi |
| 7920 SE Woodview Ter Unit 792007 Hobe Sound, FL | 1.0 | 1.0 | 700 | $1,675 | $2.39 | 23d | 1 | 1.27mi |
| 9650 SE Eagle Ave Hobe Sound, FL | 2.0 | 2.0–2.5 | 1241 | $2,330 | $1.88 | 23d | 5 | 1.40mi |
| 8455 SE Palm St Hobe Sound, FL | 2.0 | 2.0 | 1423 | $4,700 | $3.30 | 14d | 1 | 1.40mi |
| 8585 SE Palm St Hobe Sound, FL | 2.0 | 2.0 | 1304 | $10,000 | $7.67 | 23d | 1 | 1.48mi |
| 8585 SE Palm St Hobe Sound, FL | 2.0 | 2.0 | 1304 | $10,000 | $7.67 | 14d | 1 | 1.48mi |
| 9627 Crest Ct Hobe Sound, FL | 2.0 | 2.0 | 1400 | $2,500 | $1.79 | 14d | 1 | 1.50mi |
HOA detail
- Monthly dues
- $125 · $1,500/yr
Listing history 25 events
-
2026-06-18days on market $225,000 Active 25 DOM
-
2026-06-17days on market $225,000 Active 24 DOM
-
2026-06-16days on market $225,000 Active 23 DOM
-
2026-06-15days on market $225,000 Active 22 DOM
-
2026-06-14days on market $225,000 Active 20 DOM
-
2026-06-13days on market $225,000 Active 19 DOM
-
2026-06-10days on market $225,000 Active 17 DOM
-
2026-06-09days on market $225,000 Active 16 DOM
-
2026-06-08days on market $225,000 Active 15 DOM
-
2026-06-07days on market $225,000 Active 14 DOM
-
2026-06-03days on market $225,000 Active 10 DOM
-
2026-06-02days on market $225,000 Active 9 DOM
-
2026-06-01days on market $225,000 Active 8 DOM
-
2026-05-31days on market $225,000 Active 7 DOM
-
2026-05-31remarks 679-char remark
-
2026-05-31days on market $225,000 Active 6 DOM
-
2026-05-24$225,000 Active
-
2022-08-02soldstatus $180,000
-
2008-08-07historical
-
2008-02-07$84,900
-
2004-01-05soldstatus $78,000
-
2003-12-31soldstatus $78,000
-
2003-11-10$78,000
-
1990-06-28soldstatus $55,000
-
1979-06-01soldstatus $9,500
ⓘ Source: listings_history table (triggers on properties + properties_extension) + one-shot
backfill from property_details.listing_events for pre-trigger history.
Tax reassessment forecast FL · Resets to sale price
- Current annual tax
- $1,635 · $136/mo
- Projected year-2 tax
- $1,868 · $156/mo
- Expected delta
- +$232/yr (+$19/mo · 14.2%)
ⓘ Screening estimate from a state-policy table — verify with the county assessor before closing.
Climate risk First Street
- Flood 1/10 Low FEMA zone X (unshaded) · 0% chance over 30 yrs
- Wildfire 3/10 Moderate
- Heat 10/10 Extreme 7 d/yr ≥106°F today · 24 d/yr by 30 yrs out
- Wind 10/10 Extreme 99% chance of damaging wind over 30 yrs
- Air quality 2/10 Low 1 unhealthy d/yr today · 1 by 30 yrs out
Nearby sold comps map
Loading sold comps map…
Walkable amenities ~0.75 mi
Loading nearby amenities…
Taxation est. · year 1
- Rental income
- $27,540
- − Mortgage interest
- −$12,603
- − Property taxes
- −$1,635
- − Insurance
- −$1,125
- − Repairs & maintenance
- −$2,203
- − Management
- −$2,203
- − HOA
- −$1,500
- − Depreciation
- −$6,545
- Taxable loss
- −$275
- Est. tax savings @ 24.0%
- +$66
- After-tax cash flow
- $3,404/yr
For passive investors: Depreciation is non-cash, so a rental often shows a tax loss while cash-flowing — sheltering income. Rental losses are passive: they offset passive income freely, and up to $25,000/yr can offset ordinary (W-2) income if you actively participate and your MAGI is under $100k (phasing out to $0 by $150k); unused losses carry forward. On sale, claimed depreciation is recaptured at up to 25%, and gains may owe capital-gains tax (a 1031 exchange can defer both). Figures are a year-1 estimate at your 24.0% rate — not tax advice; consult a CPA.
Schools (NCES district)
- District
- Martin
- NCES district ID
- 1201290
- Math proficiency
- 52% ▼ -14.00%
- Reading proficiency
- 53% ▼ -4.00%
- Median HH income
- $52,482
- Composite
- 45.1/100
- National rank
- #2690
- State rank
- #24 of 73 in FL
Livability — Hobe Sound
- Score
- 69/100
- State rank
- #497
- US rank
- #8763
Category grades
Schools grade is shown separately in the Schools card above.
Census & demographics
- Census place
- Hobe Sound, FL
- County
- Martin County · 165,223 people
- City population
- 20,018
- Metro
- Port St. Lucie, FL
- Population (ZIP)
- 20,018
- Household income
- $70,389
- Rent vs Own
- Severe rent burden
- 317.0
Population outlook (Martin County) Hauer SSP2
- Today (2025)
- 172,383 people
- By 2030
- 180,192 · +4.5%
- By 2040
- 194,114 · +12.6%
- By 2050
- 204,992 · +18.9%
- By 2075
- 229,641 · +33.2%
- By 2100
- 232,146 · +34.7%
Race, ethnicity, and origin ACS 2023
- Neighborhood character
- Predominantly White (84%)
- Race & ethnicity
- White 84% Hispanic / Latino 8% Two or more races 6% Black 5% Asian 1%
- Hispanic origin (detail)
- Mexican 3% Dominican 1%
- Common ancestry
- Romanian 5% Italian 2% Slovak 2%
- Foreign-born
- 8% · Canada
- Languages at home
- 91% English-only · Spanish 6% Other Indo-European 1%
Political lean MEDSL · Martin
- 2024 margin
- Solid R (+31.1) · D 34.1% · R 65.2%
- 2008→2024 swing
- -17.5pp toward R · 2008: -13.6pp · 2024: -31.1pp
- All cycles
- 2024: R+31.1 2020: R+24.6 2016: R+26.9 2012: R+22.9 2008: R+13.6
Not yet ingested
- Civics
- —
Market trends
- HPI YoY
- ▼ -287.05%
- Current HPI
- 356.7273
- Rent YoY
- ▲ 1.80%
- Metro
- Port St. Lucie, FL
- State GDP YoY
- ▲ 3.28%
- F500 in state
- 36
Industry mix (Fortune 500 HQ in FL)
| Industry | F500 HQs | Revenue |
|---|---|---|
| Industrial Technology | 2 | $29B |
|
||
| Insurance | 2 | $17B |
|
||
| Retail | 1 | $60B |
|
||
| Technology Distribution | 1 | $58B |
|
||
| Homebuilding | 1 | $35B |
|
||
| Technology Manufacturing | 1 | $35B |
|
||
Price history
+2268.4% since first listed9 events — show timeline
- 2026-05-24 Listed $225,000 Beaches MLS
- 2022-08-02 Sold (Public Records) $180,000 Public Records
- 2008-08-07 Listing Removed — MCRTC
- 2008-02-07 Listed $84,900 MCRTC
- 2004-01-05 Sold (Public Records) $78,000 Public Records
- 2003-12-31 Sold (MLS) $78,000 MCRTC
- 2003-11-10 Listed $78,000 MCRTC
- 1990-06-28 Sold (Public Records) $55,000 Public Records
- 1979-06-01 Sold (Public Records) $9,500 Public Records
Property tax history
+10.4%/yrLatest (2025): $1,635 · +0.5% YoY. Source: county tax records.
Cash-flow waterfall
monthlySold comps — $/sqft
last 12 mo · ≤1 miLoading sold comps…