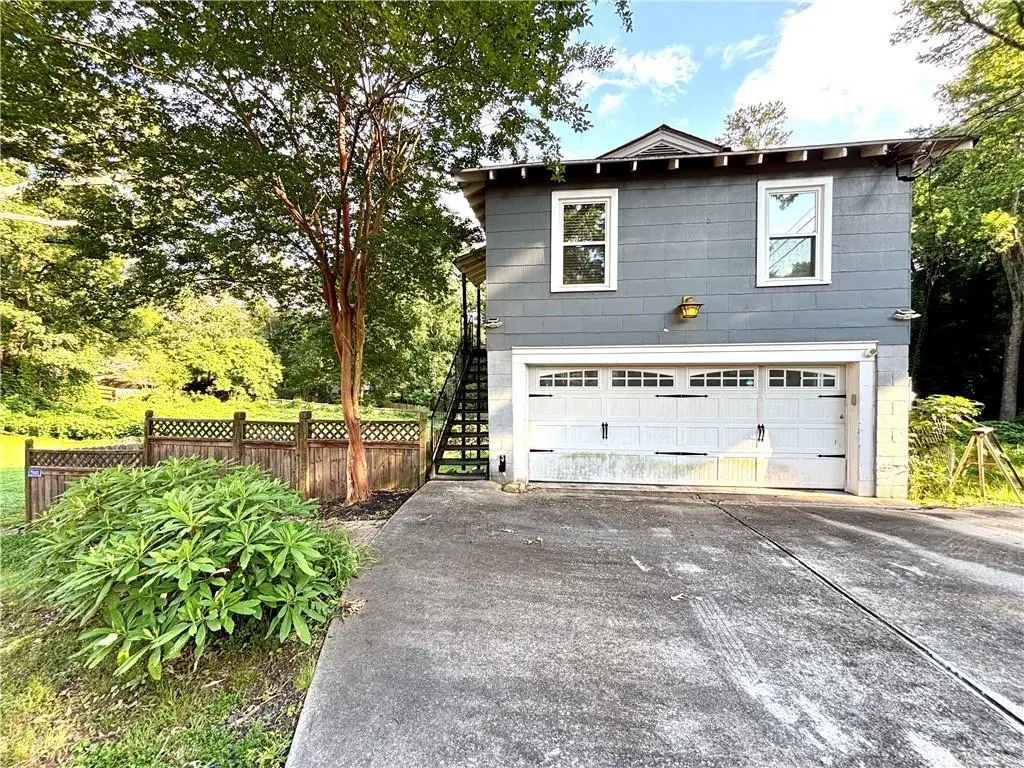
1920 Linwood Ave · Atlanta, GA
Flood risk 1/10 · Minimal
- FEMA flood zone
- X (unshaded)
- Chance of flooding over 30 yrs
- 0.0%
- Est. flood insurance / yr
- $473 – $860
Fire risk 1/10 · Minimal
- Est. fire insurance / yr
- $963 – $1,789
Heat risk 5/10 · Moderate
- Hot days now (above 103°F)
- 7 days/yr
- Hot days in 30 yrs
- 17 days/yr
Wind risk 6/10 · Moderate
- Chance of severe wind over 30 yrs
- 27.0%
Air-quality risk 5/10 · Moderate
- Unhealthy air days now
- 6 days/yr
- Unhealthy air days in 30 yrs
- 8 days/yr
Risk factors via First Street. Map © Google.
Why this score? — see what drove the D grade
The composite is a weighted blend of 9 inputs, each scored 0–100. Each bar is that input's sub-score; the figure is the points it added to the 100-point composite (weight × sub-score).
- Cash flow +12.4/30.0
- ARV discount +7.5/15.0
- 1% rule +5.2/10.0
- Livability +4.2/5.0
- DSCR +3.7/10.0
- Rent growth +2.8/5.0
- Schools +2.7/10.0
- Condition / age +2.5/5.0
- Appreciation +0.0/10.0
$200,000
🖨 Deal sheet 📄 Offer letter ✓ Due diligence
Listing remarks MLS
Discover character, charm, and privacy in this unique 2-bedroom, 1-bath home nestled in Atlanta's sought-after Historic Conley Hills neighborhood. Set on a beautifully landscaped lot with mature trees, this distinctive property offers a peaceful retreat just minutes from downtown Atlanta, Hartsfield-Jackson Airport, and the vibrant dining and entertainment options of College Park. Step inside to find a warm and inviting living space filled with natural light and timeless character. Outside, the fully fenced yard provides the perfect setting for pets, gardening, entertaining, or simply enjoying your own private outdoor oasis. The home's unique architectural details and elevated setting create a memorable curb appeal that stands out from the ordinary. Whether you're a first-time homebuyer, downsizing, or looking for a home with personality in a historic community, this Conley Hills gem offers a rare opportunity to own something truly special.
Key facts
- Fully fenced yard
- 7,649 sq ft lot
- 2 garage spots
Tags
Property features AI
Exterior
- Parking: Detached garage facing front; Two garage spaces (two total parking spaces)
- Utilities: Public water; Public sewer; Electricity available; Natural gas available; Cable available
- Home design: Two levels; Resale property
- Construction: Block and wood siding construction; Shingle roof; Slab foundation
- Exterior features: Fenced yard; Paved city street frontage; Near public transport; Near park
Interior
- Kitchen: Solid surface counters; Dishwasher; Electric range; Refrigerator
- Bedrooms: Two main-level bedrooms
- Flooring: Hardwood
- Bathrooms: One full bathroom (main level)
- Heating & cooling: Central heat; Central air
- Interior features: Sound system; Double-pane windows; No common walls
- Laundry & utility: Washer; Dryer; Laundry area in garage
Neighborhood map
What this means for you Summary
Snapshot
- This is a 2-bed/1.0-bath single-family listed at $200k.
Deal economics
- At list price, monthly cash flow is $-32 ($-380/yr) — negative.
- To cash-flow at today's rent, offer at most $194k (2.8% below list).
- Meets the 1% rule at list price ($2k rent vs $200k).
- Recommended offer: $194k (2.8% below list) — sets the bar for cash-flow.
- Cap rate 6.1% vs local median 3.1% in Atlanta — top-decile yield for the area; either an underpriced asset or a hidden risk that comps aren't pricing in. Stress-test before assuming the spread holds.
Location & tenants
- Location reads 83/100 on livability (#6 in GA, #919 nationally) — a professional / high-income tenant draw. Strengths: amenities A+, commute A+, housing A+; Watch: schools C-, cost of living C-.
- Atlanta Public Schools (urban): math 28% / reading 35% proficiency, ranked #80 of 174 in GA (top 46%) — families likely to look elsewhere, expect single-tenant / working-renter base with shorter leases; 71% free/reduced lunch — lower-income household profile, screen leases tightly.
- Market conditions: Rents rising (+1.4%/yr); 283 active listings in the ZIP; 37 comparable units currently listed for rent nearby; rentals leasing fast (median 2d on market — plan ~1-2 weeks tenant-placement turnaround); 11,565 units permitted in Fulton County in 2024 (8,159 in 5+ unit buildings).
- This rent runs 36% of the median local income ($68k/yr) — at the standard rent-burdened threshold; future hikes will face affordability resistance.
Forward outlook
- Local home prices are declining (-3.0%/yr); year-one equity from $1k of loan paydown is wiped out by about $6k of value loss. Plan a longer hold.
- Fulton County population projected at +38% by 2050 — long-run rental-demand tailwind backs the buy-and-hold thesis.
Negotiation context
- Only 6 days on market — expect competitive offers; lowballing is unlikely to land.
- 7 sale attempts since 16y ago with the ask held roughly flat each time — persistent listings suggest the price (not the market) is what's stuck; bring a comps-based counter.
- Current owner paid $89k; list at $200k implies a 125% gain — meaningful room to come down on a strong offer.
Risks & watch-outs
- Watch-outs: property tax is 3.0% of price; built in 1930 — expect roof / HVAC / electrical / plumbing capex.
- Climate carrying-cost: major wind risk, 27% chance of damaging wind over 30y; extreme-heat days projected 7→17/yr by 2055 (HVAC capex compounding) — expect insurance premiums to compound above CPI over the hold.
Questions for the listing agent
- What do current leases actually rent for vs. the listed asking? Can we see a recent rent roll and the last 12 months of T-12 income?
- Built in 1930 — when were the roof, HVAC, electrical panel, plumbing, and water heater last replaced?
- Property tax is high relative to price — has the assessment been appealed recently, and will the sale trigger a re-assessment?
- Is there a deadline driving the sale (1031 exchange, divorce, estate, relocation)? That informs how much negotiation room exists.
- The area grade is low — what's the realistic commute time and amenity access for the typical tenant pool here? Any planned neighborhood developments (good or bad) we should know about?
- What's the average days-on-market for RENTAL listings here right now (not sales)? A rising rental-DOM trend means longer vacancies and softer asking-rent achievability than the comps imply.
- What's the recent tenant-quality profile in this submarket — average credit score on applications, eviction rate, late-payment / NSF rate, and stable-employment percentage? A property-management company in the area should have these aggregated.
- How much new for-sale + rental construction is in the pipeline within 1–3 miles? Heavy new supply typically softens prices + rents 12–24 months out; constrained supply supports both.
Investment metrics
- 1% rule
- 1.02% ✓
- Cap rate
- 6.10%
- Cash-on-cash
- -0.68%
- DSCR
- 0.97
- GRM
- 8.2
CMA / ARV
No comps found within radius.
Projected returns pro-forma
-3.0% appreciation · 1.35% rent growth · sell at horizon
- IRR
- -19.5%
- Equity multiple
- 0.33×
- Total profit
- $-37,559
- Equity at exit
- $29,821
- IRR
- -16.8%
- Equity multiple
- 0.15×
- Total profit
- $-47,717
- Equity at exit
- $17,292
Cash invested: $56,000 (down + closing). Projections, not guarantees.
Landlord ↔ Tenant lean methodology
- Overall (STATE)
- 90 Strongly Landlord-Friendly
- State Georgia
- 90 Strongly Landlord-Friendly · R+3
- County
- — inherits STATE
- City
- — inherits STATE
ZIP-level market 30344
- Home prices YoY
- -31.0%
- Rents YoY
- 1.4%
- Active inventory
- 283
- Price-to-rent
- 8.2×
Monthly cashflow live
- Estimated rent
- $2,032 high interval (Pro) →
- Mortgage (P&I)
- −$1,049
- Tax from tax record
- −$504 /mo · $6,053/yr
- Insurance
- −$83
- HOA
- −$0
- Vacancy / Maint / Mgmt
- −$427
- Net cashflow
- $-32
Break-even live
UW: 25.0% down · 7.5% · 30yr · 1.5% tax · 5.0% vac · 8.0% maint · 8.0% mgmt
Financing live
Cash to close
- Down payment
- $50,000
- Closing costs
- $6,000
- Reserves months
- —
- Total cash needed
- —
Loan-product check · same deal, 3 products live
Conventional
25% down · 7.5% · 30yr
- Down + closing
- —
- Monthly P&I
- —
- Monthly cashflow
- —
- DSCR
- —
- Eligible?
- —
Personal DTI + credit; lowest rate.
DSCR
20% down · 8.5% · 30yr
- Down + closing
- —
- Monthly P&I
- —
- Monthly cashflow
- —
- DSCR
- —
- Eligible?
- —
No personal income docs; deal must DSCR.
Hard money
10% down · 12.0% · 12mo
- Down + closing
- —
- Monthly P&I
- —
- Monthly cashflow
- —
- DSCR
- —
- Eligible?
- —
Short-term bridge; refi at stabilization.
Rent comps 37 comps
| Address | Beds | Baths | Sqft | Rent | $/sqft | DOM | Units | Dist |
|---|---|---|---|---|---|---|---|---|
| 1900 N Druid Hills Rd NE Brookhaven, GA | 1.0–2.0 | 1.0–2.0 | 800 | $1,919 | $2.40 | 2d | 15 | 0.44mi |
| 3200 Lenox Rd NE Atlanta, GA | 3.0 | 1.0–2.0 | 1047 | $1,708 | $1.63 | 1d | 35 | 0.66mi |
| 960 E Paces Ferry Rd NE Atlanta, GA | 2.0 | 1.0–2.0 | 890 | $2,230 | $2.51 | 2d | 40 | 0.69mi |
| 3450 Roxboro Rd NE Atlanta, GA | 1.0–2.0 | 1.0–2.0 | 1053 | $3,237 | $3.07 | 1d | 31 | 0.71mi |
| 2716 Buford Hwy NE Atlanta, GA | 2.0 | 1.0 | 595 | $2,000 | $3.36 | 24d | 1 | 0.72mi |
| 1020 Lenox Park Blvd NE Atlanta, GA | 1.0–3.0 | 1.0–2.0 | 1101 | $1,882 | $1.71 | 1d | 54 | 0.73mi |
| 3478 Lakeside Dr NE Atlanta, GA | 1.0–3.0 | 1.0–2.0 | 1184 | $3,747 | $3.16 | 1d | 22 | 0.79mi |
| 3480 Lakeside Dr NE Atlanta, GA | 2.0 | 1.0–2.0 | 911 | $2,805 | $3.08 | 3d | 15 | 0.83mi |
| 7 Executive Park Dr NE Atlanta, GA | 1.0–2.0 | 1.0–2.0 | 884 | $2,289 | $2.59 | 1d | 21 | 0.91mi |
| 50 S Executive Park NE Atlanta, GA | 3.0 | 1.0–2.0 | 990 | $2,996 | $3.02 | 1d | 19 | 0.92mi |
| 1680 Chantilly Dr NE Atlanta, GA | 1.0–2.0 | 1.0–2.0 | 800 | $1,542 | $1.93 | 1d | 19 | 0.93mi |
| 2567 Lenox Rd NE Unit 165 L Atlanta, GA | 1.0 | 1.0 | 650 | $1,400 | $2.15 | 24d | 1 | 0.95mi |
| 2572 Lenox Rd NE Atlanta, GA | 1.0–3.0 | 1.0–2.0 | 936 | $1,600 | $1.71 | 24d | 1 | 1.02mi |
| — Atlanta, GA | 1.0 | 1.0 | 611 | $1,500 | $2.45 | 20d | 1 | 1.04mi |
| 1470 Sheridan Rd NE Atlanta, GA | 1.0–2.0 | 1.0–2.0 | 824 | $1,641 | $1.99 | 4d | 25 | 1.04mi |
| 2500 Pine Tree Rd NE Atlanta, GA | 1.0–2.0 | 1.0–2.0 | 875 | $1,879 | $2.15 | 24d | 1 | 1.05mi |
| 740 Sidney Marcus Blvd NE Atlanta, GA | 1.0–2.0 | 1.0–2.0 | 882 | $1,819 | $2.06 | 1d | 21 | 1.15mi |
| 3380 Peachtree Rd NE Atlanta, GA | 3.0 | 1.0–3.0 | 1051 | $2,700 | $2.57 | 1d | 35 | 1.23mi |
| 3372 Peachtree Rd NE Atlanta, GA | 3.0 | 1.0–2.5 | 1147 | $3,469 | $3.02 | 2d | 24 | 1.25mi |
| 3097 Maple Dr NE Atlanta, GA | 2.0 | 1.0–2.0 | 880 | $2,179 | $2.47 | 2d | 17 | 1.30mi |
| 530 E Paces Ferry Rd NE Atlanta, GA | 3.0 | 1.0–2.5 | 1193 | $3,099 | $2.60 | 1d | 29 | 1.30mi |
| 3390 Stratford Rd NE Atlanta, GA | 3.0 | 1.0–3.0 | 979 | $2,375 | $2.42 | 2d | 41 | 1.31mi |
| 505 Pharr Rd NE Atlanta, GA | 1.0–2.0 | 1.0–2.0 | 720 | $1,456 | $2.02 | 24d | 9 | 1.32mi |
| 505 Pharr Rd NE Atlanta, GA | 1.0–2.0 | 1.0–2.0 | 720 | $1,415 | $1.97 | 2d | 4 | 1.32mi |
| 3930 Peachtree Rd Brookhaven, GA | 3.0 | 1.0–2.5 | 1127 | $3,242 | $2.88 | 2d | 27 | 1.34mi |
| 20 Terminus Pl NE Atlanta, GA | 2.0 | 1.0–2.0 | 997 | $2,720 | $2.73 | 2d | 23 | 1.35mi |
| 600 Phipps Blvd NE Atlanta, GA | 3.0 | 1.0–3.0 | 1069 | $2,197 | $2.05 | 1d | 59 | 1.37mi |
| 3400 Stratford Rd NE Atlanta, GA | 2.0 | 1.0–2.0 | 1005 | $2,270 | $2.26 | 1d | 40 | 1.37mi |
| 761 Morosgo Dr NE Atlanta, GA | 2.0 | 1.0–2.0 | 980 | $2,109 | $2.15 | 1d | 15 | 1.38mi |
| 3242 Peachtree Rd NE Atlanta, GA | 2.0 | 1.0–2.5 | 1128 | $3,248 | $2.88 | 2d | 16 | 1.39mi |
| 3314 Piedmont Rd Atlanta, GA | 2.0 | 1.0–2.0 | 919 | $3,403 | $3.70 | 2d | 18 | 1.41mi |
| 2591 Piedmont Rd NE Atlanta, GA | 1.0–2.0 | 1.0–2.0 | 1019 | $2,038 | $2.00 | 1d | 20 | 1.42mi |
| 400 Pharr Rd NE Atlanta, GA | 2.0 | 1.0–2.0 | 940 | $2,579 | $2.74 | 1d | 14 | 1.42mi |
| 741 Morosgo Dr NE Atlanta, GA | 2.0 | 1.0–2.0 | 965 | $2,175 | $2.25 | 1d | 20 | 1.44mi |
| 1491 Druid Valley Dr NE Atlanta, GA | 1.0–3.0 | 1.0–2.0 | 975 | $1,563 | $1.60 | 1d | 76 | 1.46mi |
| 1111 Westchester Rdg NE Atlanta, GA | 1.0 | 1.0 | 700 | $1,330 | $1.90 | 43d | 1 | 1.46mi |
| 7000 Briarcliff Gables Cir NE Atlanta, GA | 1.0–2.0 | 1.0–2.0 | 830 | $1,663 | $2.00 | 1d | 23 | 1.50mi |
Listing history 6 events
-
2026-06-18days on market $200,000 Active 6 DOM
-
2026-06-17days on market $200,000 Active 5 DOM
-
2026-06-16days on market $200,000 Active 4 DOM
-
2026-06-15days on market $200,000 Active 3 DOM
-
2026-06-13remarks 699-char remark
-
2026-06-13$200,000 Active 1 DOM
ⓘ Source: listings_history table (triggers on properties + properties_extension) + one-shot
backfill from property_details.listing_events for pre-trigger history.
Tax reassessment forecast GA · Resets to sale price
- Current annual tax
- $6,053 · $504/mo
- Projected year-2 tax
- $6,053 · $504/mo
- Expected delta
- $0/yr ($0/mo · 0.0%)
ⓘ Screening estimate from a state-policy table — verify with the county assessor before closing.
Climate risk First Street
- Flood 1/10 Low FEMA zone X (unshaded) · 0% chance over 30 yrs
- Wildfire 1/10 Low
- Heat 5/10 Major 7 d/yr ≥103°F today · 17 d/yr by 30 yrs out
- Wind 6/10 Major 27% chance of damaging wind over 30 yrs
- Air quality 5/10 Major 6 unhealthy d/yr today · 8 by 30 yrs out
Nearby sold comps map
Loading sold comps map…
Walkable amenities ~0.75 mi
Loading nearby amenities…
Taxation est. · year 1
- Rental income
- $24,378
- − Mortgage interest
- −$11,203
- − Property taxes
- −$6,053
- − Insurance
- −$1,000
- − Repairs & maintenance
- −$1,950
- − Management
- −$1,950
- − Depreciation
- −$5,818
- Taxable loss
- −$3,597
- Est. tax savings @ 24.0%
- +$863
- After-tax cash flow
- $483/yr
For passive investors: Depreciation is non-cash, so a rental often shows a tax loss while cash-flowing — sheltering income. Rental losses are passive: they offset passive income freely, and up to $25,000/yr can offset ordinary (W-2) income if you actively participate and your MAGI is under $100k (phasing out to $0 by $150k); unused losses carry forward. On sale, claimed depreciation is recaptured at up to 25%, and gains may owe capital-gains tax (a 1031 exchange can defer both). Figures are a year-1 estimate at your 24.0% rate — not tax advice; consult a CPA.
Schools (NCES district)
- District
- Atlanta Public Schools
- NCES district ID
- 1300120
- Math proficiency
- 28% ▼ -6.00%
- Reading proficiency
- 35% ▼ -2.00%
- Median HH income
- $48,306
- Composite
- 27.27/100
- National rank
- #7006
- State rank
- #80 of 174 in GA
Livability — Atlanta
- Score
- 83/100
- State rank
- #6
- US rank
- #919
Category grades
Schools grade is shown separately in the Schools card above.
Census & demographics
- Census place
- Atlanta, GA
- County
- Fulton County · 1,094,430 people
- City population
- 629,525
- Metro
- Atlanta-Sandy Springs-Alpharetta, GA
- Population (ZIP)
- 35,456
- Household income
- $68,380
- Rent vs Own
- Severe rent burden
- 2226.0
Population outlook (Fulton County) Hauer SSP2
- Today (2025)
- 1,203,707 people
- By 2030
- 1,299,706 · +8.0%
- By 2040
- 1,488,256 · +23.6%
- By 2050
- 1,664,580 · +38.3%
- By 2075
- 2,036,072 · +69.2%
- By 2100
- 2,222,402 · +84.6%
Race, ethnicity, and origin ACS 2023
- Neighborhood character
- Predominantly Black (74%)
- Race & ethnicity
- Black 74% White 11% Hispanic / Latino 11% Two or more races 6%
- Hispanic origin (detail)
- Mexican 7% Puerto Rican 1%
- Common ancestry
- Italian 1% Swiss 1% Russian 1%
- Foreign-born
- 6% · Canada, Jamaica
- Languages at home
- 87% English-only · Spanish 9% Other Indo-European 1% German/W. Germanic 1%
Political lean MEDSL · Fulton
- 2024 margin
- Solid D (+44.9) · D 71.9% · R 27.0% · Other 1.1%
- 2008→2024 swing
- +9.8pp toward D · 2008: 35.0pp · 2024: 44.9pp
- All cycles
- 2024: D+44.9 2020: D+46.4 2016: D+42.1 2012: D+29.6 2008: D+35.0
Not yet ingested
- Civics
- —
Market trends
- HPI YoY
- ▼ -113.15%
- Current HPI
- 251.7916
- Rent YoY
- ▲ 1.35%
- Metro
- Atlanta-Sandy Springs-Alpharetta, GA
- State GDP YoY
- ▲ 2.66%
- F500 in state
- 28
Industry mix (Fortune 500 HQ in GA)
| Industry | F500 HQs | Revenue |
|---|---|---|
| Paper / Packaging | 2 | $29B |
|
||
| Retail | 1 | $160B |
|
||
| Transportation / Logistics | 1 | $91B |
|
||
| Airlines | 1 | $62B |
|
||
| Consumer Goods | 1 | $47B |
|
||
| Utilities | 1 | $25B |
|
||
Price history
+1500.0% since first listed22 events — show timeline
- 2026-06-12 Listed $200,000 GAMLS
- 2026-06-12 Listed $200,000 FMLS
- 2018-02-05 Sold (Public Records) $88,900 Public Records
- 2018-01-31 Sold (MLS) $88,900 GAMLS
- 2018-01-31 Sold (MLS) $88,900 FMLS
- 2018-01-20 Pending — FMLS
- 2018-01-19 Contingent — FMLS
- 2018-01-16 Pending — FMLS
- 2018-01-02 Contingent — FMLS
- 2018-01-02 Pending — GAMLS
- 2017-12-01 Relisted — GAMLS
- 2017-12-01 Relisted — FMLS
- 2017-11-20 Pending — GAMLS
- 2017-11-20 Contingent — FMLS
- 2017-11-16 Listed $99,900 GAMLS
- 2017-11-16 Listed $99,900 FMLS
- 2012-03-31 Sold (MLS) $59,900 GAMLS
- 2012-01-23 Listing Removed — GAMLS
- 2011-03-03 Pending — GAMLS
- 2010-11-24 Listed $59,900 GAMLS
- 2009-06-09 Sold (Public Records) $7,000 Public Records
- 2008-07-08 Sold (Public Records) $12,500 Public Records
Property tax history
+16.3%/yrLatest (2025): $6,053 · +872.1% YoY. Source: county tax records.
Cash-flow waterfall
monthlySold comps — $/sqft
last 12 mo · ≤1 miLoading sold comps…