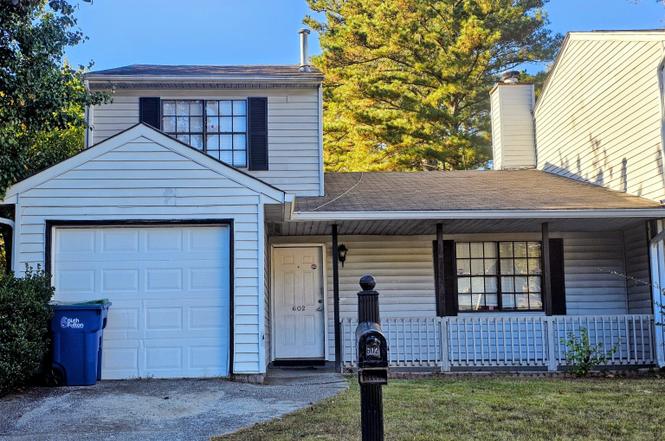
602 Pine Tree Trl · South Fulton, GA
Flood risk No data
- FEMA flood zone
- —
- Chance of flooding over 30 yrs
- —
- Est. flood insurance / yr
- —
Fire risk No data
- Est. fire insurance / yr
- —
Heat risk No data
- Hot days now (above threshold)
- —
- Hot days in 30 yrs
- —
Wind risk No data
- Chance of severe wind over 30 yrs
- —
Air-quality risk No data
- Unhealthy air days now
- —
- Unhealthy air days in 30 yrs
- —
Risk factors via First Street. Map © Google.
Why this score? — see what drove the A grade
The composite is a weighted blend of 9 inputs, each scored 0–100. Each bar is that input's sub-score; the figure is the points it added to the 100-point composite (weight × sub-score).
- Cash flow +30.0/30.0
- ARV discount +15.0/15.0
- DSCR +10.0/10.0
- Appreciation +10.0/10.0
- 1% rule +8.3/10.0
- Schools +4.5/10.0
- Rent growth +2.7/5.0
- Livability +2.5/5.0
- Condition / age +2.5/5.0
$150,000
🖨 Deal sheet 📄 Offer letter ✓ Due diligence
Listing remarks MLS
Spacious 4-bedroom, 2-bathroom townhome conveniently located just 10 minutes from Hartsfield-Jackson Atlanta International Airport! Perfectly situated near shopping, dining, and entertainment, this home offers both comfort and convenience. Great for Frist-Time Home Buyers or Investor-Friendly Opportunity - NO HOA Rental Restrictions, making it an ideal addition to your rental portfolio or a great long-term home.
Key facts
- $17 HOA
- Garage
- Built 1989
Neighborhood map
What this means for you Summary
Snapshot
- This is a 4-bed/2.5-bath townhouse listed at $150k.
Deal economics
- At list price, monthly cash flow is $578 ($7k/yr) — positive.
- The deal already cash-flows at list — no discount required.
- Meets the 1% rule at list price ($2k rent vs $150k).
- Recommended offer: $132k (12.0% below list) — sets the bar for market timing.
- Cap rate 10.9% vs local median 4.6% in South Fulton — top-decile yield for the area; either an underpriced asset or a hidden risk that comps aren't pricing in. Stress-test before assuming the spread holds.
Location & tenants
- Location reads: area grade A — affects rentability + tenant quality, not the cash-flow math above.
- Fulton County (suburban): math 49% / reading 53% proficiency, ranked #12 of 174 in GA (top 7%) — acceptable for families but not a draw, mixed tenant base, ~2y average lease.
- Market conditions: Rents flat; 651 active listings in the ZIP; 40 comparable units currently listed for rent nearby; rentals at typical pace (median 22d on market — plan ~3-4 weeks tenant-placement turnaround); 11,565 units permitted in Fulton County in 2024 (8,159 in 5+ unit buildings).
- This rent runs 36% of the median local income ($67k/yr) — at the standard rent-burdened threshold; future hikes will face affordability resistance.
Forward outlook
- In year one you build about $16k of equity ($1k loan paydown + $15k appreciation (10.0% local appreciation)).
- Fulton County population projected at +38% by 2050 — long-run rental-demand tailwind backs the buy-and-hold thesis.
- At projected returns (10.0% appreciation + 0.9% rent growth), your $42k cash investment doubles in ~2 years — after that, you're playing with house money.
- By year 3, paydown + projected appreciation supports a ~$41k cash-out refi (75% LTV) — recoverable capital for the next deal without selling this one.
Negotiation context
- It's been on market 237 days — a 12% lower offer ($132k) is reasonable based on typical stale-listing flexibility.
- 11 sale attempts since 5y ago with the ask held roughly flat each time — persistent listings suggest the price (not the market) is what's stuck; bring a comps-based counter.
Questions for the listing agent
- It's been on market 237 days. Have you received any prior offers? Is the seller open to a 12% concession, seller financing, or rate buy-down credit?
- What does the HOA fee cover, when was the last increase, and are there any pending special assessments or reserve-fund shortfalls?
- Why hasn't it sold? Are there any deal-killer items the seller is aware of (foundation, flood, title, zoning, code violations)?
- Is there a deadline driving the sale (1031 exchange, divorce, estate, relocation)? That informs how much negotiation room exists.
- What's the average days-on-market for RENTAL listings here right now (not sales)? A rising rental-DOM trend means longer vacancies and softer asking-rent achievability than the comps imply.
- What's the recent tenant-quality profile in this submarket — average credit score on applications, eviction rate, late-payment / NSF rate, and stable-employment percentage? A property-management company in the area should have these aggregated.
- How much new for-sale + rental construction is in the pipeline within 1–3 miles? Heavy new supply typically softens prices + rents 12–24 months out; constrained supply supports both.
Investment metrics
- 1% rule
- 1.33% ✓
- Cap rate
- 10.92%
- Cash-on-cash
- 16.53%
- DSCR
- 1.74
- GRM
- 6.2
CMA / ARV
- ARV (median comp)
- $288,540
- List price
- $150,000
- Delta
- -48.01%
- Verdict
- UNDERPRICED
- Comps
- 20 within 1.0 mi
Show comp detail 8 sales within ~0.75 mi
| Address | Dist | Beds/Ba | Sqft | Sold | Price | $/sf | Match |
|---|---|---|---|---|---|---|---|
| 1206 Creel Ln | 0.16mi | 3/2.5 (-1) | 1,652 (+5%) | 2mo | $240,000 | $145 | 77 |
| 7005 Livia Pt | 0.16mi | 3/2.5 (-1) | 1,568 (+0%) | 13mo | $255,000 | $163 | 76 |
| 1103 Pine Tree Trl | 0.13mi | 3/2.5 (-1) | 1,466 (-6%) | 4mo | $75,000 | $51 | 75 |
| 1901 Creel Ln | 0.22mi | 3/2.5 (-1) | 1,642 (+5%) | 3mo | $240,000 | $146 | 74 |
| 3008 Pine Tree Trl Unit 16D | 0.10mi | 3/2.5 (-1) | 1,466 (-6%) | 12mo | $126,000 | $86 | 70 |
| 1109 Pinetree Trl | 0.13mi | 3/2.5 (-1) | 1,466 (-6%) | 14mo | $105,100 | $72 | 67 |
| 2784 Haligan Pt | 0.21mi | 3/2.5 (-1) | 1,380 (-12%) | 1mo | $214,000 | $155 | 64 |
| 7002 Galloway Pt | 0.31mi | 3/2.5 (-1) | 1,428 (-9%) | 19mo | $225,000 | $158 | 50 |
Match score weights: distance 35% · size 25% · config 20% · recency 20%. Top-matched comps best support the ARV.
Projected returns pro-forma
10.0% appreciation · 0.95% rent growth · sell at horizon
- IRR
- 35.5%
- Equity multiple
- 3.73×
- Total profit
- $114,499
- Equity at exit
- $135,132
- IRR
- 29.9%
- Equity multiple
- 8.16×
- Total profit
- $300,687
- Equity at exit
- $291,417
Cash invested: $42,000 (down + closing). Projections, not guarantees.
Landlord ↔ Tenant lean methodology
- Overall (STATE)
- 90 Strongly Landlord-Friendly
- State Georgia
- 90 Strongly Landlord-Friendly · R+3
- County
- — inherits STATE
- City
- — inherits STATE
ZIP-level market 30349
- Home prices YoY
- 4.6%
- Rents YoY
- 0.9%
- Active inventory
- 651
- Price-to-rent
- 6.2×
Monthly cashflow live
- Estimated rent
- $2,001 high interval (Pro) →
- Mortgage (P&I)
- −$787
- Tax from tax record
- −$136 /mo · $1,636/yr
- Insurance
- −$62
- HOA
- −$17
- Vacancy / Maint / Mgmt
- −$420
- Net cashflow
- $578
Break-even live
UW: 25.0% down · 7.5% · 30yr · 1.5% tax · 5.0% vac · 8.0% maint · 8.0% mgmt
Financing live
Cash to close
- Down payment
- $37,500
- Closing costs
- $4,500
- Reserves months
- —
- Total cash needed
- —
Loan-product check · same deal, 3 products live
Conventional
25% down · 7.5% · 30yr
- Down + closing
- —
- Monthly P&I
- —
- Monthly cashflow
- —
- DSCR
- —
- Eligible?
- —
Personal DTI + credit; lowest rate.
DSCR
20% down · 8.5% · 30yr
- Down + closing
- —
- Monthly P&I
- —
- Monthly cashflow
- —
- DSCR
- —
- Eligible?
- —
No personal income docs; deal must DSCR.
Hard money
10% down · 12.0% · 12mo
- Down + closing
- —
- Monthly P&I
- —
- Monthly cashflow
- —
- DSCR
- —
- Eligible?
- —
Short-term bridge; refi at stabilization.
Rent comps 40 comps
| Address | Beds | Baths | Sqft | Rent | $/sqft | DOM | Units | Dist |
|---|---|---|---|---|---|---|---|---|
| 3206 Pine Tree Trl Unit 15C Atlanta, GA | 3.0 | 2.5 | 1466 | $1,950 | $1.33 | 4d | 1 | 0.06mi |
| 7060 Kimberly Mill Rd Atlanta, GA | 3.0 | 1.0 | 1056 | $1,425 | $1.35 | 5d | 1 | 0.27mi |
| 2550 Hallie Mill Rd Atlanta, GA | 3.0 | 2.0 | 1372 | $1,600 | $1.17 | 12d | 1 | 0.37mi |
| 7156 Tanger Blvd Riverdale, GA | 4.0 | 2.5 | 1984 | $2,229 | $1.12 | 3d | 1 | 0.39mi |
| 110 Fruitwood Trce Unit A Riverdale, GA | 3.0 | 2.0 | 1100 | $1,800 | $1.64 | 20d | 1 | 0.43mi |
| 7045 Birling Dr Atlanta, GA | 4.0 | 3.0 | 1488 | $1,765 | $1.19 | 43d | 1 | 0.43mi |
| 2820 Greenbower Ct Atlanta, GA | 3.0 | 2.0 | 1338 | $1,730 | $1.29 | 4d | 1 | 0.44mi |
| 2722 South Hills Riverdale, GA | 3.0 | 2.5 | 1722 | $2,200 | $1.28 | 5d | 1 | 0.49mi |
| 6870 Old Bethsaida Way Riverdale, GA | 4.0 | 2.5 | 1916 | $1,973 | $1.03 | 43d | 1 | 0.49mi |
| 2529 Wood Bend Ln Riverdale, GA | 3.0 | 2.5 | 1508 | $1,945 | $1.29 | 43d | 1 | 0.51mi |
| 2590 South Hills Riverdale, GA | 3.0 | 2.5 | 1850 | $2,005 | $1.08 | 12d | 1 | 0.51mi |
| 145 W Village Ct Riverdale, GA | 3.0 | 2.5 | 1284 | $1,865 | $1.45 | 5d | 1 | 0.54mi |
| 2625 Carolina Rdg Riverdale, GA | 4.0 | 2.5 | 1936 | $2,125 | $1.10 | 20d | 1 | 0.56mi |
| 336 Rocky Springs Ct Atlanta, GA | 4.0 | 2.0 | 1900 | $1,450 | $0.76 | 24d | 1 | 0.67mi |
| 2405 Wood Bend Ln Riverdale, GA | 3.0 | 2.5 | 1396 | $1,800 | $1.29 | 43d | 1 | 0.69mi |
| 6450 Peppermill Ln Atlanta, GA | 4.0 | 2.0 | 1188 | $1,531 | $1.29 | 24d | 1 | 0.80mi |
| 3325 Valley Bend Rd Atlanta, GA | 4.0 | 2.0 | 2000 | $1,995 | $1.00 | 5d | 1 | 0.93mi |
| 3325 Valley Bend Rd Atlanta, GA | 4.0 | 2.0 | 2000 | $1,995 | $1.00 | 17d | 1 | 0.93mi |
| 3105 Garnet Way Atlanta, GA | 3.0 | 2.0 | 1470 | $1,660 | $1.13 | 12d | 1 | 0.94mi |
| 3500 Keels Ln Atlanta, GA | 3.0 | 2.0 | 1272 | $1,755 | $1.38 | 2d | 1 | 0.94mi |
| 6345 Peppermill Ln Atlanta, GA | 3.0 | 2.5 | 1224 | $1,800 | $1.47 | 43d | 1 | 0.98mi |
| 6575 Smoke Ridge Dr Atlanta, GA | 4.0 | 2.0 | 1808 | $1,815 | $1.00 | 43d | 1 | 0.99mi |
| 2328 Creel Rd Atlanta, GA | 4.0 | 3.0 | 2100 | $1,895 | $0.90 | 43d | 1 | 1.01mi |
| 2667 Rocky Ct Atlanta, GA | 3.0 | 2.5 | 1432 | $2,200 | $1.54 | 43d | 1 | 1.03mi |
| 6500 Connell Rd Atlanta, GA | 3.0 | 2.0 | 1483 | $1,650 | $1.11 | 24d | 1 | 1.03mi |
| 6440 Connell Rd Atlanta, GA | 3.0 | 2.0 | 1391 | $1,695 | $1.22 | 24d | 1 | 1.10mi |
| 6445 Connell Rd Atlanta, GA | 3.0 | 2.0 | 1357 | $1,856 | $1.37 | 43d | 1 | 1.11mi |
| 855 Old Rocky Rd Atlanta, GA | 3.0 | 2.0 | 1310 | $1,710 | $1.31 | 24d | 1 | 1.12mi |
| 2373 Bigwood Trl Atlanta, GA | 3.0 | 2.5 | 1566 | $1,845 | $1.18 | 24d | 1 | 1.14mi |
| 325 Pointer Ct Atlanta, GA | 3.0 | 2.0 | 1474 | $1,620 | $1.10 | 5d | 1 | 1.15mi |
| 2285 Bigwood Trl Atlanta, GA | 3.0 | 2.5 | 1580 | $1,740 | $1.10 | 2d | 1 | 1.18mi |
| 6278 Rockaway Rd Atlanta, GA | 3.0 | 2.5 | 1524 | $2,000 | $1.31 | 43d | 1 | 1.19mi |
| 6560 Emerald Pointe Cir Atlanta, GA | 3.0 | 2.0 | 1309 | $1,500 | $1.15 | 22d | 1 | 1.21mi |
| 2310 Bigwood Trl Atlanta, GA | 3.0 | 2.5 | 1580 | $2,600 | $1.65 | 24d | 1 | 1.22mi |
| 6368 Olmadison Pl Atlanta, GA | 3.0 | 2.5 | 1428 | $1,656 | $1.16 | 11d | 1 | 1.22mi |
| 6370 Olmadison Pl Atlanta, GA | 3.0 | 2.5 | 1440 | $1,795 | $1.25 | 43d | 1 | 1.22mi |
| 2560 Foxlair Trl Atlanta, GA | 4.0 | 2.0 | 1485 | $1,795 | $1.21 | 24d | 1 | 1.24mi |
| 3800 Leisure Ln Atlanta, GA | 3.0 | 2.0 | 1198 | $2,350 | $1.96 | 22d | 1 | 1.27mi |
| 3760 Cedar Hurst Way Atlanta, GA | 4.0 | 2.5 | 1595 | $2,150 | $1.35 | 10d | 1 | 1.30mi |
| 6415 El Caudillo Ct Atlanta, GA | 3.0 | 3.0 | 1498 | $2,800 | $1.87 | 4d | 1 | 1.31mi |
HOA detail
- Monthly dues
- $17 · $204/yr
Listing history 39 events
-
2026-06-18days on market $150,000 Active 237 DOM
-
2026-06-17days on market $150,000 Active 236 DOM
-
2026-06-16days on market $150,000 Active 235 DOM
-
2026-06-15statusdays on market $150,000 Active 234 DOM
-
2026-06-13statusdays on market $150,000 Back On Market 232 DOM
-
2026-05-12historical On Hold 416-char remark
Show marketing remark (416 chars)
Spacious 4-bedroom, 2-bathroom townhome conveniently located just 10 minutes from Hartsfield-Jackson Atlanta International Airport! Perfectly situated near shopping, dining, and entertainment, this home offers both comfort and convenience. Great for Frist-Time Home Buyers or Investor-Friendly Opportunity - NO HOA Rental Restrictions, making it an ideal addition to your rental portfolio or a great long-term home.
-
2025-10-19$150,000 Active
-
2025-10-18historical
-
2025-09-25$150,000 New 416-char remark
Show marketing remark (416 chars)
Spacious 4-bedroom, 2-bathroom townhome conveniently located just 10 minutes from Hartsfield-Jackson Atlanta International Airport! Perfectly situated near shopping, dining, and entertainment, this home offers both comfort and convenience. Great for Frist-Time Home Buyers or Investor-Friendly Opportunity - NO HOA Rental Restrictions, making it an ideal addition to your rental portfolio or a great long-term home.
-
2025-09-25historical
Show marketing remark (416 chars)
Spacious 4-bedroom, 2-bathroom townhome conveniently located just 10 minutes from Hartsfield-Jackson Atlanta International Airport! Perfectly situated near shopping, dining, and entertainment, this home offers both comfort and convenience. Great for Frist-Time Home Buyers or Investor-Friendly Opportunity - NO HOA Rental Restrictions, making it an ideal addition to your rental portfolio or a great long-term home.
-
2025-05-19price $150,000
-
2025-04-22price $164,999
-
2025-03-04status Price Change
-
2025-03-04price $174,999
-
2025-03-03historical
-
2024-12-03price $175,000
-
2024-09-02$189,999 New
-
2022-02-24soldstatus $140,000
-
2022-02-22soldstatus $140,000 Closed
-
2022-02-22soldstatus $140,000 Sold
-
2022-01-21status Pending
-
2022-01-21status Under Contract
-
2021-12-29price $140,000
-
2021-12-29price $140,000
-
2021-12-26status Active
-
2021-12-23historical
-
2021-12-22status Active
-
2021-11-05status Under Contract
-
2021-10-29status Active
-
2021-10-26status Under Contract
-
2021-10-26status Pending
-
2021-10-18price $150,000
-
2021-10-18price $150,000
-
2021-09-16status Back on Market
-
2021-09-14status Active
-
2021-08-19historical
-
2021-08-16$130,000 New
-
2021-08-14$130,000 Active
-
2003-07-03soldstatus $79,000
ⓘ Source: listings_history table (triggers on properties + properties_extension) + one-shot
backfill from property_details.listing_events for pre-trigger history.
Tax reassessment forecast GA · Resets to sale price
- Current annual tax
- $1,636 · $136/mo
- Projected year-2 tax
- $1,636 · $136/mo
- Expected delta
- $0/yr ($0/mo · 0.0%)
ⓘ Screening estimate from a state-policy table — verify with the county assessor before closing.
Nearby sold comps map
Loading sold comps map…
Walkable amenities ~0.75 mi
Loading nearby amenities…
Taxation est. · year 1
- Rental income
- $24,013
- − Mortgage interest
- −$8,402
- − Property taxes
- −$1,636
- − Insurance
- −$750
- − Repairs & maintenance
- −$1,921
- − Management
- −$1,921
- − HOA
- −$204
- − Depreciation
- −$4,364
- Taxable income
- $4,815
- Est. tax owed @ 24.0%
- −$1,156
- After-tax cash flow
- $5,786/yr
For passive investors: Depreciation is non-cash, so a rental often shows a tax loss while cash-flowing — sheltering income. Rental losses are passive: they offset passive income freely, and up to $25,000/yr can offset ordinary (W-2) income if you actively participate and your MAGI is under $100k (phasing out to $0 by $150k); unused losses carry forward. On sale, claimed depreciation is recaptured at up to 25%, and gains may owe capital-gains tax (a 1031 exchange can defer both). Figures are a year-1 estimate at your 24.0% rate — not tax advice; consult a CPA.
Schools (NCES district)
- District
- Fulton County
- NCES district ID
- 1302280
- Math proficiency
- 49% ▼ -2.00%
- Reading proficiency
- 53% ▬ 0.00%
- Median HH income
- $68,035
- Composite
- 45.33/100
- National rank
- #2640
- State rank
- #12 of 174 in GA
Livability — South Fulton
No livability data for this city. (Only ~50 U.S. cities are tracked.)
Census & demographics
- Census place
- South Fulton, GA
- County
- Fulton County · 1,094,430 people
- City population
- 127,674
- Metro
- Atlanta-Sandy Springs-Alpharetta, GA
- Population (ZIP)
- 79,872
- Household income
- $67,023
- Rent vs Own
- Severe rent burden
- 4258.0
Population outlook (Fulton County) Hauer SSP2
- Today (2025)
- 1,203,707 people
- By 2030
- 1,299,706 · +8.0%
- By 2040
- 1,488,256 · +23.6%
- By 2050
- 1,664,580 · +38.3%
- By 2075
- 2,036,072 · +69.2%
- By 2100
- 2,222,402 · +84.6%
Race, ethnicity, and origin ACS 2023
- Neighborhood character
- Predominantly Black (89%)
- Race & ethnicity
- Black 89% Hispanic / Latino 5% Two or more races 4% White 3%
- Foreign-born
- 9% · Canada
- Languages at home
- 88% English-only · Spanish 6% French/Haitian/Cajun 1%
Political lean MEDSL · Fulton
- 2024 margin
- Solid D (+44.9) · D 71.9% · R 27.0% · Other 1.1%
- 2008→2024 swing
- +9.8pp toward D · 2008: 35.0pp · 2024: 44.9pp
- All cycles
- 2024: D+44.9 2020: D+46.4 2016: D+42.1 2012: D+29.6 2008: D+35.0
Not yet ingested
- Civics
- —
Market trends
- HPI YoY
- ▲ 18.01%
- Current HPI
- 407.99
- Rent YoY
- ▲ 0.95%
- Metro
- Atlanta-Sandy Springs-Alpharetta, GA
- State GDP YoY
- ▲ 2.66%
- F500 in state
- 28
Industry mix (Fortune 500 HQ in GA)
| Industry | F500 HQs | Revenue |
|---|---|---|
| Paper / Packaging | 2 | $29B |
|
||
| Retail | 1 | $160B |
|
||
| Transportation / Logistics | 1 | $91B |
|
||
| Airlines | 1 | $62B |
|
||
| Consumer Goods | 1 | $47B |
|
||
| Utilities | 1 | $25B |
|
||
Price history
+89.9% since first listed34 events — show timeline
- 2026-05-12 Delisted — GAMLS
- 2025-10-19 Listed $150,000 FMLS
- 2025-10-18 Coming Soon — FMLS
- 2025-09-25 Listing Removed — GAMLS
- 2025-09-25 Listed $150,000 GAMLS
- 2025-05-19 Price Changed $150,000 GAMLS
- 2025-04-22 Price Changed $164,999 GAMLS
- 2025-03-04 Relisted — GAMLS
- 2025-03-04 Price Changed $174,999 GAMLS
- 2025-03-03 Listing Removed — GAMLS
- 2024-12-03 Price Changed $175,000 GAMLS
- 2024-09-02 Listed $189,999 GAMLS
- 2022-02-24 Sold (Public Records) $140,000 Public Records
- 2022-02-22 Sold (MLS) $140,000 GAMLS
- 2022-02-22 Sold (MLS) $140,000 FMLS
- 2022-01-21 Pending — FMLS
- 2022-01-21 Pending — GAMLS
- 2021-12-29 Price Changed $140,000 FMLS
- 2021-12-29 Price Changed $140,000 GAMLS
- 2021-12-26 Relisted — GAMLS
- 2021-12-23 Listing Removed — GAMLS
- 2021-12-22 Relisted — FMLS
- 2021-11-05 Pending — GAMLS
- 2021-10-29 Relisted — GAMLS
- 2021-10-26 Pending — GAMLS
- 2021-10-26 Pending — FMLS
- 2021-10-18 Price Changed $150,000 FMLS
- 2021-10-18 Price Changed $150,000 GAMLS
- 2021-09-16 Relisted — GAMLS
- 2021-09-14 Relisted — FMLS
- 2021-08-19 Listing Removed — GAMLS
- 2021-08-16 Listed $130,000 GAMLS
- 2021-08-14 Listed $130,000 FMLS
- 2003-07-03 Sold (Public Records) $79,000 Public Records
Property tax history
+2.6%/yrLatest (2025): $1,636 · -4.7% YoY. Source: county tax records.
Cash-flow waterfall
monthlySold comps — $/sqft
last 12 mo · ≤1 miLoading sold comps…