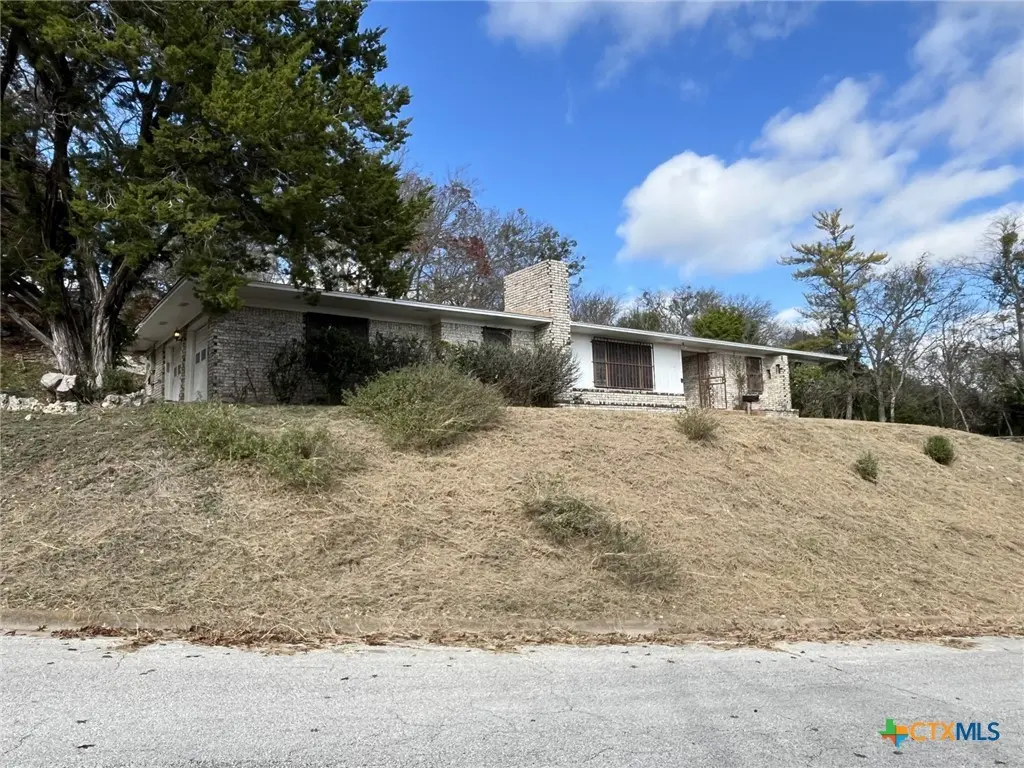
604 Yucca Dr · Copperas Cove, TX
Flood risk 1/10 · Minimal
- FEMA flood zone
- X (unshaded)
- Chance of flooding over 30 yrs
- 0.0%
- Est. flood insurance / yr
- $507 – $1,088
Fire risk 5/10 · Moderate
- Est. fire insurance / yr
- $1,222 – $2,270
Heat risk 7/10 · Major
- Hot days now (above 106°F)
- 6 days/yr
- Hot days in 30 yrs
- 20 days/yr
Wind risk 6/10 · Moderate
- Chance of severe wind over 30 yrs
- 51.0%
Air-quality risk 1/10 · Minimal
- Unhealthy air days now
- 0 days/yr
- Unhealthy air days in 30 yrs
- 0 days/yr
Risk factors via First Street. Map © Google.
Why this score? — see what drove the C- grade
The composite is a weighted blend of 9 inputs, each scored 0–100. Each bar is that input's sub-score; the figure is the points it added to the 100-point composite (weight × sub-score).
- Cash flow +16.8/30.0
- ARV discount +15.0/15.0
- 1% rule +6.2/10.0
- DSCR +5.2/10.0
- Schools +3.6/10.0
- Livability +3.2/5.0
- Condition / age +2.5/5.0
- Rent growth +2.4/5.0
- Appreciation +0.0/10.0
$144,900
🖨 Deal sheet 📄 Offer letter ✓ Due diligence
Listing remarks MLS
This 3 bedroom, 2 bathroom home offers great potential for buyers ready to update and add value. The property features a functional floor plan with spacious living areas and comfortable bedroom sizes. With some cosmetic updates and modern touches, this home could truly shine. Situated on a hill with a view & conveniently located near shopping, dining, and Fort Hood. This is a great opportunity for investors, flippers, or owner-occupants looking to customize a home to their taste. Priced to reflect needed updates—bring your vision and make it your own!
Key facts
- 0.74 acre lot
- 2 garage spots
- Built 1972
Tags
Neighborhood map
What this means for you Summary
Snapshot
- This is a 3-bed/2.0-bath single-family listed at $145k.
Deal economics
- At list price, monthly cash flow is $92 ($1k/yr) — positive.
- The deal already cash-flows at list — no discount required.
- Meets the 1% rule at list price ($2k rent vs $145k).
- Recommended offer: $128k (12.0% below list) — sets the bar for market timing.
- Cap rate 7.1% vs local median 3.4% in Copperas Cove — top-decile yield for the area; either an underpriced asset or a hidden risk that comps aren't pricing in. Stress-test before assuming the spread holds.
Location & tenants
- Location reads 65/100 on livability (#706 in TX) — a middle-class / working-renter tenant base. Strengths: cost of living A+, housing A+; Watch: schools C-, employment D+, amenities F.
- Copperas Cove ISD (suburban): math 41% / reading 42% proficiency, ranked #340 of 826 in TX (top 41%) — families likely to look elsewhere, expect single-tenant / working-renter base with shorter leases.
- Market conditions: Rents soft (-0.2%/yr); 605 active listings in the ZIP; 40 comparable units currently listed for rent nearby; rentals lingering (median 44d on market — plan ~5-8 weeks vacancy on turnover, expect pricing pressure); 55% of comp listings sitting > 30 days — soft ceiling on asking rent; 386 units permitted in Coryell County in 2024 (0 in 5+ unit buildings).
Forward outlook
- Local home prices are declining (-3.0%/yr); year-one equity from $1k of loan paydown is wiped out by about $4k of value loss. Plan a longer hold.
Negotiation context
- It's been on market 142 days — a 12% lower offer ($128k) is reasonable based on typical stale-listing flexibility.
Risks & watch-outs
- Watch-outs: property tax is 3.1% of price.
- Climate carrying-cost: major wind risk, 51% chance of damaging wind over 30y; moderate wildfire risk; extreme-heat days projected 6→20/yr by 2055 (HVAC capex compounding) — expect insurance premiums to compound above CPI over the hold.
Questions for the listing agent
- It's been on market 142 days. Have you received any prior offers? Is the seller open to a 12% concession, seller financing, or rate buy-down credit?
- Built in 1972 — when were the roof, HVAC, electrical panel, plumbing, and water heater last replaced?
- Property tax is high relative to price — has the assessment been appealed recently, and will the sale trigger a re-assessment?
- Why hasn't it sold? Are there any deal-killer items the seller is aware of (foundation, flood, title, zoning, code violations)?
- Is there a deadline driving the sale (1031 exchange, divorce, estate, relocation)? That informs how much negotiation room exists.
- What's the average days-on-market for RENTAL listings here right now (not sales)? A rising rental-DOM trend means longer vacancies and softer asking-rent achievability than the comps imply.
- What's the recent tenant-quality profile in this submarket — average credit score on applications, eviction rate, late-payment / NSF rate, and stable-employment percentage? A property-management company in the area should have these aggregated.
- How much new for-sale + rental construction is in the pipeline within 1–3 miles? Heavy new supply typically softens prices + rents 12–24 months out; constrained supply supports both.
Investment metrics
- 1% rule
- 1.12% ✓
- Cap rate
- 7.05%
- Cash-on-cash
- 2.72%
- DSCR
- 1.12
- GRM
- 7.4
CMA / ARV
- ARV (median comp)
- $203,788
- List price
- $144,900
- Delta
- -28.90%
- Verdict
- UNDERPRICED
- Comps
- 20 within 1.0 mi
Show comp detail 12 sales within ~0.75 mi
| Address | Dist | Beds/Ba | Sqft | Sold | Price | $/sf | Match |
|---|---|---|---|---|---|---|---|
| 604 Yucca Dr | 0.00mi | 3/2.0 | 1,724 (0%) | 1mo | $142,000 | $82 | 99 |
| 608 Allen St | 0.24mi | 3/2.0 | 1,736 (+1%) | 2mo | $210,000 | $121 | 86 |
| 306 Margaret Lee St | 0.19mi | 3/1.0 | 1,814 (+5%) | 5mo | $85,000 | $47 | 74 |
| 1005 Virginia Ave | 0.48mi | 3/2.0 | 1,748 (+1%) | 7mo | $220,000 | $126 | 70 |
| 710 Ash St | 0.19mi | 3/2.0 | 1,957 (+14%) | 6mo | $281,000 | $144 | 63 |
| 1302 Creek St | 0.58mi | 4/2.0 (+1) | 1,685 (-2%) | 7mo | $235,000 | $139 | 58 |
| 912 Risen Star Ln | 0.64mi | 4/2.0 (+1) | 1,701 (-1%) | 6mo | $240,000 | $141 | 58 |
| 1001 Gilmore St | 0.54mi | 3/2.0 | 1,575 (-9%) | 4mo | $167,000 | $106 | 57 |
| 905 Vernon Dr | 0.54mi | 4/2.0 (+1) | 1,560 (-10%) | 1mo | $230,000 | $147 | 53 |
| 904 Randa St | 0.72mi | 4/2.0 (+1) | 1,638 (-5%) | 4mo | $234,000 | $143 | 50 |
| 520 Judy Ln | 0.29mi | 4/2.0 (+1) | 1,499 (-13%) | 13mo | $210,000 | $140 | 49 |
| 1003 Joe Morse Dr | 0.57mi | 3/2.0 | 1,468 (-15%) | 6mo | $205,000 | $140 | 44 |
Match score weights: distance 35% · size 25% · config 20% · recency 20%. Top-matched comps best support the ARV.
Projected returns pro-forma
-3.0% appreciation · 0.0% rent growth · sell at horizon
- IRR
- -15.9%
- Equity multiple
- 0.45×
- Total profit
- $-22,245
- Equity at exit
- $21,605
- IRR
- -15.4%
- Equity multiple
- 0.27×
- Total profit
- $-29,646
- Equity at exit
- $12,528
Cash invested: $40,572 (down + closing). Projections, not guarantees.
Landlord ↔ Tenant lean methodology
- Overall (STATE)
- 87 Strongly Landlord-Friendly
- State Texas
- 87 Strongly Landlord-Friendly · R+5
- County
- — inherits STATE
- City
- — inherits STATE
ZIP-level market 76522
- Home prices YoY
- -22.4%
- Rents YoY
- -0.2%
- Active inventory
- 605
- Price-to-rent
- 7.4×
Monthly cashflow live
- Estimated rent
- $1,623 high interval (Pro) →
- Mortgage (P&I)
- −$760
- Tax from tax record
- −$370 /mo · $4,438/yr
- Insurance
- −$60
- HOA
- −$0
- Vacancy / Maint / Mgmt
- −$341
- Net cashflow
- $92
Break-even live
UW: 25.0% down · 7.5% · 30yr · 1.5% tax · 5.0% vac · 8.0% maint · 8.0% mgmt
Financing live
Cash to close
- Down payment
- $36,225
- Closing costs
- $4,347
- Reserves months
- —
- Total cash needed
- —
Loan-product check · same deal, 3 products live
Conventional
25% down · 7.5% · 30yr
- Down + closing
- —
- Monthly P&I
- —
- Monthly cashflow
- —
- DSCR
- —
- Eligible?
- —
Personal DTI + credit; lowest rate.
DSCR
20% down · 8.5% · 30yr
- Down + closing
- —
- Monthly P&I
- —
- Monthly cashflow
- —
- DSCR
- —
- Eligible?
- —
No personal income docs; deal must DSCR.
Hard money
10% down · 12.0% · 12mo
- Down + closing
- —
- Monthly P&I
- —
- Monthly cashflow
- —
- DSCR
- —
- Eligible?
- —
Short-term bridge; refi at stabilization.
Rent comps 40 comps
| Address | Beds | Baths | Sqft | Rent | $/sqft | DOM | Units | Dist |
|---|---|---|---|---|---|---|---|---|
| 613 Cedar Dr Copperas Cove, TX | 3.0 | 2.5 | 2108 | $2,750 | $1.30 | 43d | 1 | 0.03mi |
| 303 Margaret Lee St Copperas Cove, TX | 3.0 | 1.0 | 1124 | $915 | $0.81 | 13d | 1 | 0.26mi |
| 809 Shady Ln Copperas Cove, TX | 4.0 | 1.5 | 1900 | $1,600 | $0.84 | 13d | 1 | 0.32mi |
| 408 Allen St Copperas Cove, TX | 3.0 | 1.0 | 1300 | $1,095 | $0.84 | 23d | 1 | 0.32mi |
| 914 Chalk St Copperas Cove, TX | 3.0 | 2.0 | 1107 | $1,200 | $1.08 | 23d | 1 | 0.48mi |
| 518 Kate St Copperas Cove, TX | 4.0 | 1.5 | 1302 | $1,595 | $1.23 | 43d | 1 | 0.48mi |
| 1102 Creek St Copperas Cove, TX | 4.0 | 2.5 | 1834 | $1,675 | $0.91 | 43d | 1 | 0.50mi |
| 507 Kate St Copperas Cove, TX | 3.0 | 2.0 | 1280 | $1,295 | $1.01 | 23d | 1 | 0.53mi |
| 304 Oak St Copperas Cove, TX | 3.0 | 1.0 | 1627 | $1,350 | $0.83 | 43d | 1 | 0.56mi |
| 208 Oak St Copperas Cove, TX | 3.0 | 2.0 | 1822 | $1,495 | $0.82 | 23d | 1 | 0.58mi |
| 1306 Amthor Ave Copperas Cove, TX | 3.0 | 2.0 | 1366 | $1,399 | $1.02 | 43d | 1 | 0.68mi |
| 107 Nauert St Copperas Cove, TX | 3.0 | 2.0 | 1710 | $1,300 | $0.76 | 43d | 1 | 0.70mi |
| 105 Nauert St Copperas Cove, TX | 4.0 | 1.0 | 1346 | $1,395 | $1.04 | 23d | 1 | 0.71mi |
| 917 Whirlaway Dr Copperas Cove, TX | 3.0 | 2.0 | 1300 | $1,500 | $1.15 | 43d | 1 | 0.73mi |
| 912 Laurie Ln Copperas Cove, TX | 3.0 | 2.0 | 2080 | $1,700 | $0.82 | 13d | 1 | 0.81mi |
| 902 Lynn Ln Copperas Cove, TX | 3.0 | 2.0 | 1661 | $1,600 | $0.96 | 13d | 1 | 0.82mi |
| 924 Northern Dancer Dr Copperas Cove, TX | 4.0 | 2.0 | 1610 | $1,650 | $1.02 | 43d | 1 | 0.83mi |
| 1002 Northern Dancer Dr Copperas Cove, TX | 4.0 | 2.0 | 1605 | $1,750 | $1.09 | 43d | 1 | 0.83mi |
| 1202 S FM 116 Copperas Cove, TX | 1.0–3.0 | 1.0–2.0 | 922 | $1,560 | $1.69 | 13d | 12 | 0.85mi |
| 1202 S 3rd St Copperas Cove, TX | 3.0 | 2.0 | 1056 | $1,175 | $1.11 | 43d | 1 | 0.90mi |
| 604 N Main St Apt D Copperas Cove, TX | 3.0 | 1.5 | 1100 | $900 | $0.82 | 43d | 1 | 0.93mi |
| 105 E Reagan Ave Copperas Cove, TX | 2.0 | 1.0 | 1758 | $675 | $0.38 | 43d | 1 | 0.93mi |
| 504 Highway Ave Unit B Copperas Cove, TX | 2.0 | 1.0 | 1500 | $700 | $0.47 | 43d | 1 | 0.94mi |
| 704 Kim Ave Copperas Cove, TX | 3.0 | 2.0 | 1692 | $1,695 | $1.00 | 21d | 1 | 0.98mi |
| 1335 Liberation Ln Unit A Copperas Cove, TX | 3.0 | 2.0 | 1333 | $2,500 | $1.88 | 13d | 1 | 0.99mi |
| 1316 Liberation Ln Unit B Copperas Cove, TX | 3.0 | 2.0 | 1300 | $1,300 | $1.00 | 43d | 1 | 0.99mi |
| 1335 Liberation Ln Unit B Copperas Cove, TX | 3.0 | 2.0 | 1333 | $2,400 | $1.80 | 13d | 1 | 1.00mi |
| 1204 S 7th St Copperas Cove, TX | 3.0 | 2.0 | 1202 | $1,295 | $1.08 | 43d | 1 | 1.00mi |
| 211 E Hogan Dr Copperas Cove, TX | 3.0 | 2.0 | 1372 | $1,400 | $1.02 | 13d | 1 | 1.00mi |
| 1104 Cummings Ave Copperas Cove, TX | 3.0 | 2.0 | 1542 | $1,395 | $0.90 | 43d | 1 | 1.00mi |
| 1201 S 9th St Copperas Cove, TX | 3.0 | 2.0 | 1172 | $1,100 | $0.94 | 23d | 1 | 1.02mi |
| 412 West Avenue C Unit C Copperas Cove, TX | 3.0 | 2.0 | 1343 | $1,600 | $1.19 | 21d | 1 | 1.03mi |
| 414 West Avenue C Unit C Copperas Cove, TX | 3.0 | 2.0 | 1343 | $1,600 | $1.19 | 43d | 1 | 1.03mi |
| 1243 Liberation Ln Unit A Copperas Cove, TX | 3.0 | 2.0 | 1309 | $1,249 | $0.95 | 43d | 1 | 1.04mi |
| 418 Cottonwood Dr Copperas Cove, TX | 3.0 | 2.0 | 1208 | $1,495 | $1.24 | 43d | 1 | 1.04mi |
| 1005 S 11th St Copperas Cove, TX | 4.0 | 2.0 | 1236 | $1,090 | $0.88 | 43d | 1 | 1.05mi |
| 1904 Pleasant Ln Copperas Cove, TX | 3.0 | 2.0 | 1352 | $1,400 | $1.04 | 43d | 1 | 1.05mi |
| 604 S 11th St Copperas Cove, TX | 3.0 | 2.0 | 1119 | $1,300 | $1.16 | 43d | 1 | 1.05mi |
| 607 Curry Ave Copperas Cove, TX | 3.0 | 1.5 | 1192 | $935 | $0.78 | 23d | 1 | 1.06mi |
| 1564 Risen Star Ln Unit A Copperas Cove, TX | 3.0 | 2.0 | 1110 | $1,400 | $1.26 | 23d | 1 | 1.06mi |
Listing history 4 events
-
2026-05-14status Pending 569-char remark
Show marketing remark (569 chars)
This 3 bedroom, 2 bathroom home offers great potential for buyers ready to update and add value. The property features a functional floor plan with spacious living areas and comfortable bedroom sizes. With some cosmetic updates and modern touches, this home could truly shine. Situated on a hill with a view & conveniently located near shopping, dining, and Fort Hood. This is a great opportunity for investors, flippers, or owner-occupants looking to customize a home to their taste. Priced to reflect needed updates—bring your vision and make it your own!
-
2026-03-06price $144,900 569-char remark
Show marketing remark (569 chars)
This 3 bedroom, 2 bathroom home offers great potential for buyers ready to update and add value. The property features a functional floor plan with spacious living areas and comfortable bedroom sizes. With some cosmetic updates and modern touches, this home could truly shine. Situated on a hill with a view & conveniently located near shopping, dining, and Fort Hood. This is a great opportunity for investors, flippers, or owner-occupants looking to customize a home to their taste. Priced to reflect needed updates—bring your vision and make it your own!
-
2026-01-29price $149,900 569-char remark
Show marketing remark (569 chars)
This 3 bedroom, 2 bathroom home offers great potential for buyers ready to update and add value. The property features a functional floor plan with spacious living areas and comfortable bedroom sizes. With some cosmetic updates and modern touches, this home could truly shine. Situated on a hill with a view & conveniently located near shopping, dining, and Fort Hood. This is a great opportunity for investors, flippers, or owner-occupants looking to customize a home to their taste. Priced to reflect needed updates—bring your vision and make it your own!
-
2025-12-22$159,900 Active 569-char remark
Show marketing remark (569 chars)
This 3 bedroom, 2 bathroom home offers great potential for buyers ready to update and add value. The property features a functional floor plan with spacious living areas and comfortable bedroom sizes. With some cosmetic updates and modern touches, this home could truly shine. Situated on a hill with a view & conveniently located near shopping, dining, and Fort Hood. This is a great opportunity for investors, flippers, or owner-occupants looking to customize a home to their taste. Priced to reflect needed updates—bring your vision and make it your own!
ⓘ Source: listings_history table (triggers on properties + properties_extension) + one-shot
backfill from property_details.listing_events for pre-trigger history.
Tax reassessment forecast TX · Resets to sale price
- Current annual tax
- $4,438 · $370/mo
- Projected year-2 tax
- $4,438 · $370/mo
- Expected delta
- $0/yr ($0/mo · 0.0%)
ⓘ Screening estimate from a state-policy table — verify with the county assessor before closing.
Climate risk First Street
- Flood 1/10 Low FEMA zone X (unshaded) · 0% chance over 30 yrs
- Wildfire 5/10 Major
- Heat 7/10 Severe 6 d/yr ≥106°F today · 20 d/yr by 30 yrs out
- Wind 6/10 Major 51% chance of damaging wind over 30 yrs
- Air quality 1/10 Low 0 unhealthy d/yr today · 0 by 30 yrs out
Nearby sold comps map
Loading sold comps map…
Walkable amenities ~0.75 mi
Loading nearby amenities…
Taxation est. · year 1
- Rental income
- $19,473
- − Mortgage interest
- −$8,117
- − Property taxes
- −$4,438
- − Insurance
- −$724
- − Repairs & maintenance
- −$1,558
- − Management
- −$1,558
- − Depreciation
- −$4,215
- Taxable loss
- −$1,138
- Est. tax savings @ 24.0%
- +$273
- After-tax cash flow
- $1,375/yr
For passive investors: Depreciation is non-cash, so a rental often shows a tax loss while cash-flowing — sheltering income. Rental losses are passive: they offset passive income freely, and up to $25,000/yr can offset ordinary (W-2) income if you actively participate and your MAGI is under $100k (phasing out to $0 by $150k); unused losses carry forward. On sale, claimed depreciation is recaptured at up to 25%, and gains may owe capital-gains tax (a 1031 exchange can defer both). Figures are a year-1 estimate at your 24.0% rate — not tax advice; consult a CPA.
Schools (NCES district)
- District
- Copperas Cove ISD
- NCES district ID
- 4815240
- Math proficiency
- 41% ▼ -6.00%
- Reading proficiency
- 42% ▼ -2.00%
- Median HH income
- $51,072
- Composite
- 35.85/100
- National rank
- #4822
- State rank
- #340 of 826 in TX
Livability — Copperas Cove
- Score
- 65/100
- State rank
- #706
- US rank
- #13158
Category grades
Schools grade is shown separately in the Schools card above.
Census & demographics
- Census place
- Copperas Cove, TX
- County
- Coryell County · 61,053 people
- City population
- 42,118
- Metro
- Killeen-Temple, TX
- Population (ZIP)
- 42,118
- Household income
- $72,206
- Rent vs Own
- Severe rent burden
- 1019.0
Population outlook (Coryell County) Hauer SSP2
- Today (2025)
- 75,485 people
- By 2030
- 75,627 · +0.2%
- By 2040
- 74,898 · -0.8%
- By 2050
- 74,221 · -1.7%
- By 2075
- 72,688 · -3.7%
- By 2100
- 66,862 · -11.4%
Race, ethnicity, and origin ACS 2023
- Neighborhood character
- Diverse neighborhood (Simpson 0.66)
- Race & ethnicity
- White 53% Hispanic / Latino 21% Two or more races 20% Black 14% Asian 2%
- Hispanic origin (detail)
- Mexican 11% Puerto Rican 6%
- Common ancestry
- Romanian 2% Italian 2% Lithuanian 2%
- Foreign-born
- 7% · Canada, South Korea
- Languages at home
- 85% English-only · Spanish 10% German/W. Germanic 2% Other Asian/Pacific 1%
Political lean MEDSL · Coryell
- 2024 margin
- Solid R (+40.7) · D 29.1% · R 69.8% · Other 1.1%
- 2008→2024 swing
- -13.8pp toward R · 2008: -26.9pp · 2024: -40.7pp
- All cycles
- 2024: R+40.7 2020: R+33.5 2016: R+39.5 2012: R+36.6 2008: R+26.9
Not yet ingested
- Civics
- —
Market trends
- HPI YoY
- ▼ -53.11%
- Current HPI
- 183.9452
- Rent YoY
- ▼ -0.25%
- Metro
- Killeen-Temple, TX
- State GDP YoY
- ▲ 3.95%
- F500 in state
- 110
Industry mix (Fortune 500 HQ in TX)
| Industry | F500 HQs | Revenue |
|---|---|---|
| Energy | 16 | $1,198B |
|
||
| Technology | 5 | $198B |
|
||
| Engineering / Construction | 4 | $72B |
|
||
| Energy Services | 3 | $60B |
|
||
| Utilities | 3 | $41B |
|
||
| Healthcare | 2 | $330B |
|
||
Price history
-9.4% since first listed4 events — show timeline
- 2026-05-14 Pending — CTXMLS
- 2026-03-06 Price Changed $144,900 CTXMLS
- 2026-01-29 Price Changed $149,900 CTXMLS
- 2025-12-22 Listed $159,900 CTXMLS
Property tax history
+5.4%/yrLatest (2025): $4,438 · +12.2% YoY. Source: county tax records.
Cash-flow waterfall
monthlySold comps — $/sqft
last 12 mo · ≤1 miLoading sold comps…