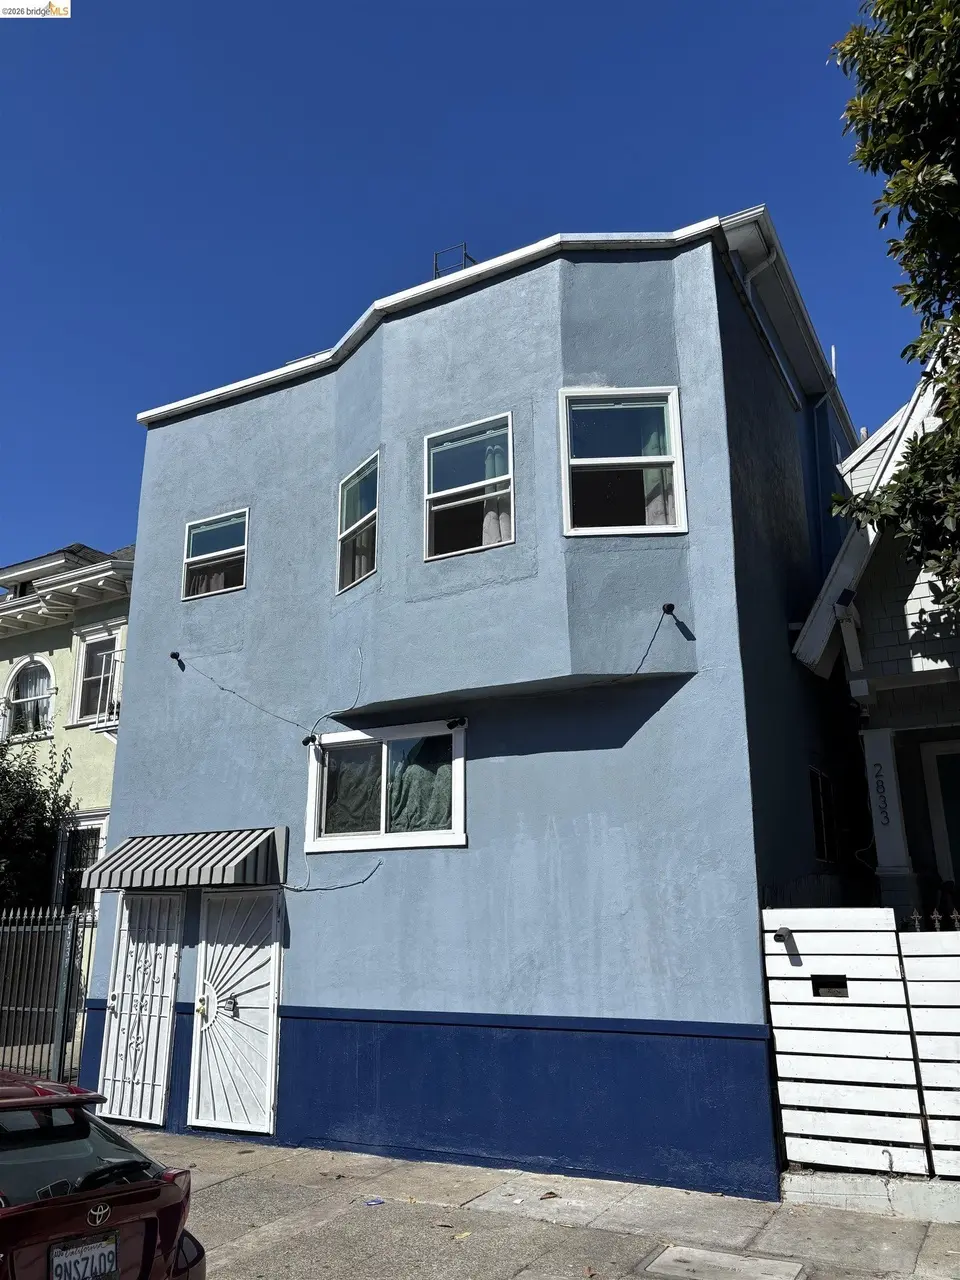
 5-Plex
2831 Martin Luther King Jr Way · Oakland, CA
Flood risk No data
- FEMA flood zone
- —
- Chance of flooding over 30 yrs
- —
- Est. flood insurance / yr
- —
Fire risk No data
- Est. fire insurance / yr
- —
Heat risk No data
- Hot days now (above threshold)
- —
- Hot days in 30 yrs
- —
Wind risk No data
- Chance of severe wind over 30 yrs
- —
Air-quality risk No data
- Unhealthy air days now
- —
- Unhealthy air days in 30 yrs
- —
Risk factors via First Street. Map © Google.
Why this score? — see what drove the B+ grade
The composite is a weighted blend of 9 inputs, each scored 0–100. Each bar is that input's sub-score; the figure is the points it added to the 100-point composite (weight × sub-score).
- Cash flow +30.0/30.0
- ARV discount +12.2/15.0
- DSCR +10.0/10.0
- 1% rule +9.7/10.0
- Rent growth +4.1/5.0
- Condition / age +3.8/5.0
- Livability +3.6/5.0
- Schools +3.0/10.0
- Appreciation +0.0/10.0
$849,000
🖨 Deal sheet 📄 Offer letter ✓ Due diligence
Multi-family units
County records classify this as Multi-Family (5+ Unit). Listing-text estimate: 5 units. confirmed
5+ unit building — per-unit beds/baths from public records are typically unavailable; the breakdown below (if shown) is an estimate from the listing text.
Listing remarks
This is a rare opportunity to acquire a fully occupied 5-unit multifamily property in one of Oakland's most established and desirable rental markets. Located in North Oakland near the Temescal District, MacArthur BART, Berkeley, and Emeryville, the property benefits from strong tenant demand, excellent commuter accessibility, and long-term appreciation potential. The property has undergone significant capital improvements, including remodeled units, a newer roof, and fresh exterior paint, creating a low-maintenance investment opportunity with stable in-place income. Tenants pay their own PG & E utilities, helping reduce ownership expenses and improve operational efficiency. Electric wat
Key facts
- Temescal district
- Remodeled units
- Macarthur bart
Tags
Property features AI
Finance
- Financial info: Five total units; Cap rate 8.35%
Exterior
- Parking: Two total parking spaces; On-street parking
- Security: Security gate
- Utilities: Sewer connected; Individual electric meters
- Home design: Multi-unit property (5+ units); Built in 1912
- Construction: Stucco construction
- Exterior features: Curb(s); Garden; Security gate
Interior
- Flooring: Hardwood floors; Laminate floors
- Heating & cooling: Electric heating; Heating configured for multi-unit building
- Interior features: Electric water heater
Neighborhood map
What this means for you Summary
Snapshot
- This is a 5 × 2-bed/1.5-bath units multifamily listed at $849k. Condition is rated good.
Deal economics
- At list price, monthly cash flow is $4k ($48k/yr) — positive. Per door: $793/mo.
- The deal already cash-flows at list — no discount required.
- Meets the 1% rule at list price ($12k rent vs $849k).
- Cap rate 11.9% vs local median 2.4% in Oakland — top-decile yield for the area; either an underpriced asset or a hidden risk that comps aren't pricing in. Stress-test before assuming the spread holds.
Location & tenants
- Location reads 71/100 on livability (#224 in CA) — a middle-class / working-renter tenant base. Strengths: amenities A+, commute A+, employment A+; Watch: schools C-, crime F, cost of living F.
- Oakland Unified (urban): math 27% / reading 33% proficiency, ranked #1,007 of 1,400 in CA (top 72%) — families likely to look elsewhere, expect single-tenant / working-renter base with shorter leases; 68% free/reduced lunch — lower-income household profile, screen leases tightly.
- Market conditions: Rents rising fast (+6.5%/yr); 85 active listings in the ZIP; solid renter incomes; 1,742 units permitted in Alameda County in 2024 (856 in 5+ unit buildings).
- At $12,447/mo this rent would consume 139% of the median local household income ($108k/yr) (locally 1721% of renters already pay >50% of income on rent) — very limited rent-growth headroom before tenants either downsize or default.
Forward outlook
- Local home prices are declining (-3.0%/yr); year-one equity from $6k of loan paydown is wiped out by about $25k of value loss. Plan a longer hold.
- Alameda County population projected at +34% by 2050 — long-run rental-demand tailwind backs the buy-and-hold thesis.
- At projected returns (-3.0% appreciation + 6.5% rent growth), your $238k cash investment doubles in ~6 years — after that, you're playing with house money.
Negotiation context
- Only 7 days on market — expect competitive offers; lowballing is unlikely to land.
Risks & watch-outs
- Watch-outs: built in 1912 — expect roof / HVAC / electrical / plumbing capex.
Questions for the listing agent
- Can we see the unit-by-unit rent roll, current vacancy, and any below-market leases? What's the average tenancy length?
- What capital expenditures (roof, boiler, parking lot, exteriors) have been made in the last 5 years, and what's planned in the next 2?
- Built in 1912 — when were the roof, HVAC, electrical panel, plumbing, and water heater last replaced?
- Is there a deadline driving the sale (1031 exchange, divorce, estate, relocation)? That informs how much negotiation room exists.
- Crime grade is F in this area — have there been break-ins, vandalism, or insurance claims at this property in the last 3 years? What carrier currently insures it and at what premium?
- What's the average days-on-market for RENTAL listings here right now (not sales)? A rising rental-DOM trend means longer vacancies and softer asking-rent achievability than the comps imply.
- What's the recent tenant-quality profile in this submarket — average credit score on applications, eviction rate, late-payment / NSF rate, and stable-employment percentage? A property-management company in the area should have these aggregated.
- How much new apartment / multifamily construction is in the pipeline within 1–3 miles? Heavy new supply (>2% of stock underway) typically softens rents 12–24 months out; light construction supports rent growth.
Investment metrics
- 1% rule
- 1.47% ✓
- Cap rate
- 11.90%
- Cash-on-cash
- 20.02%
- DSCR
- 1.89
- GRM
- 5.7
CMA / ARV
- ARV (on-the-fly)
- $947,835
- Comps found
- 8
Show comp detail 8 sales within ~0.75 mi
| Address | Dist | Beds/Ba | Sqft | Sold | Price | $/sf | Match |
|---|---|---|---|---|---|---|---|
| 719 35th St | 0.41mi | 11/6.0 | 3,233 (+1%) | 6mo | $925,000 | $286 | 75 |
| 2118 Linden St | 0.63mi | 4/4.0 | 3,159 (-2%) | 14mo | $835,000 | $264 | 56 |
| 2307 Harrison St | 0.68mi | 5/3.0 | 3,168 (-1%) | 14mo | $1,130,000 | $357 | 54 |
| 926 36th St | 0.61mi | 6/4.0 | 2,870 (-11%) | 0mo | $500,000 | $174 | 54 |
| 769 17th St | 0.73mi | 8/4.0 | 2,979 (-7%) | 1mo | $810,000 | $272 | 53 |
| 3508 Adeline St | 0.71mi | 5/5.0 | 3,629 (+13%) | 2mo | $1,100,000 | $303 | 43 |
| 2731 Harrison St | 0.70mi | 7/4.0 | 3,474 (+8%) | 19mo | $1,025,000 | $295 | 38 |
| 2719 Harrison St | 0.70mi | 8/4.0 | 3,648 (+14%) | 11mo | $1,500,000 | $411 | 36 |
Match score weights: distance 35% · size 25% · config 20% · recency 20%. Top-matched comps best support the ARV.
Projected returns pro-forma
-3.0% appreciation · 6.51% rent growth · sell at horizon
- IRR
- 16.1%
- Equity multiple
- 1.68×
- Total profit
- $160,707
- Equity at exit
- $126,589
- IRR
- 27.2%
- Equity multiple
- 3.80×
- Total profit
- $666,677
- Equity at exit
- $73,406
Cash invested: $237,720 (down + closing). Projections, not guarantees.
Landlord ↔ Tenant lean methodology
- Overall (CITY)
- 0 Strongly Tenant-Friendly
- State California
- 18 Strongly Tenant-Friendly · D+13
- County
- — inherits STATE
- City Oakland
- 0 Strongly Tenant-Friendly · D+62
ZIP-level market 94609
- Rents YoY
- 6.5%
- Active inventory
- 85
- Price-to-rent
- 28.4×
Monthly cashflow live
- Estimated rent
- $12,447 high interval (Pro) →
- Mortgage (P&I)
- −$4,452
- Tax est. 1.5%
- −$1,061 /mo · $12,735/yr
- Insurance
- −$354
- HOA
- −$0
- Vacancy / Maint / Mgmt
- −$2,614
- Net cashflow
- $3,966
Break-even live
5-unit breakdown (identical units grouped — click to expand)
| Units | Beds | Baths | Est. rent |
|---|---|---|---|
| 5× units | 2 | 1.5 | $12,445 |
| #1 | 2 | 1.5 | $2,489 |
| #2 | 2 | 1.5 | $2,489 |
| #3 | 2 | 1.5 | $2,489 |
| #4 | 2 | 1.5 | $2,489 |
| #5 | 2 | 1.5 | $2,489 |
| Total (5 units) | $12,447 | ||
UW: 25.0% down · 7.5% · 30yr · 1.5% tax · 5.0% vac · 8.0% maint · 8.0% mgmt
Financing live
Cash to close
- Down payment
- $212,250
- Closing costs
- $25,470
- Reserves months
- —
- Total cash needed
- —
Loan-product check · same deal, 3 products live
Conventional
25% down · 7.5% · 30yr
- Down + closing
- —
- Monthly P&I
- —
- Monthly cashflow
- —
- DSCR
- —
- Eligible?
- —
Personal DTI + credit; lowest rate.
DSCR
20% down · 8.5% · 30yr
- Down + closing
- —
- Monthly P&I
- —
- Monthly cashflow
- —
- DSCR
- —
- Eligible?
- —
No personal income docs; deal must DSCR.
Hard money
10% down · 12.0% · 12mo
- Down + closing
- —
- Monthly P&I
- —
- Monthly cashflow
- —
- DSCR
- —
- Eligible?
- —
Short-term bridge; refi at stabilization.
Listing history 7 events
-
2026-06-18days on market $849,000 Active 7 DOM
-
2026-06-17days on market $849,000 Active 6 DOM
-
2026-06-16days on market $849,000 Active 5 DOM
-
2026-06-15days on market $849,000 Active 4 DOM
-
2026-06-13days on market $849,000 Active 2 DOM
-
2026-06-13remarks 695-char remark
-
2026-06-13$849,000 Active 1 DOM
ⓘ Source: listings_history table (triggers on properties + properties_extension) + one-shot
backfill from property_details.listing_events for pre-trigger history.
Nearby sold comps map
Loading sold comps map…
Walkable amenities ~0.75 mi
Loading nearby amenities…
Taxation est. · year 1
- Rental income
- $149,364
- − Mortgage interest
- −$47,557
- − Property taxes
- −$12,735
- − Insurance
- −$4,245
- − Repairs & maintenance
- −$11,949
- − Management
- −$11,949
- − Depreciation
- −$24,698
- Taxable income
- $36,230
- Est. tax owed @ 24.0%
- −$8,695
- After-tax cash flow
- $38,895/yr
For passive investors: Depreciation is non-cash, so a rental often shows a tax loss while cash-flowing — sheltering income. Rental losses are passive: they offset passive income freely, and up to $25,000/yr can offset ordinary (W-2) income if you actively participate and your MAGI is under $100k (phasing out to $0 by $150k); unused losses carry forward. On sale, claimed depreciation is recaptured at up to 25%, and gains may owe capital-gains tax (a 1031 exchange can defer both). Figures are a year-1 estimate at your 24.0% rate — not tax advice; consult a CPA.
Condition & rehab AI · 8 photos
This fully occupied 5-unit multifamily property in North Oakland is in good condition with recent improvements, making it a low-maintenance investment opportunity with stable in-place income.
Value-add opportunities
- Both Landscaping improvements — Enhances curb appeal and property value
- Both Interior updates — Improves aesthetics and rental appeal
Renovation cost estimate screening
Value-add ROI direction
- Both Landscaping improvements — Enhances curb appeal and property value ↑
- Both Interior updates — Improves aesthetics and rental appeal ↑
ⓘ Cost ranges are severity-bucket heuristics (US national rule-of-thumb). Get contractor quotes + a written scope before underwriting a rehab budget.
Schools (NCES district)
- District
- Oakland Unified
- NCES district ID
- 0628050
- Math proficiency
- 27% ▬ 0.00%
- Reading proficiency
- 33% ▬ 0.00%
- Median HH income
- $55,194
- Composite
- 29.52/100
- National rank
- #11769
- State rank
- #1007 of 1400 in CA
Livability — Oakland
- Score
- 71/100
- State rank
- #224
- US rank
- #7245
Category grades
Schools grade is shown separately in the Schools card above.
Census & demographics
- Census place
- Oakland, CA
- County
- Alameda County · 1,614,355 people
- City population
- 385,993
- Metro
- San Francisco-Oakland-Berkeley, CA
- Population (ZIP)
- 23,928
- Household income
- $107,834
- Rent vs Own
- Severe rent burden
- 1721.0
Population outlook (Alameda County) Hauer SSP2
- Today (2025)
- 1,928,884 people
- By 2030
- 2,069,146 · +7.3%
- By 2040
- 2,338,405 · +21.2%
- By 2050
- 2,586,608 · +34.1%
- By 2075
- 3,061,911 · +58.7%
- By 2100
- 3,234,133 · +67.7%
Race, ethnicity, and origin ACS 2023
- Neighborhood character
- Highly diverse neighborhood (Simpson 0.74)
- Race & ethnicity
- White 41% Black 25% Hispanic / Latino 14% Two or more races 13% Asian 10%
- Hispanic origin (detail)
- Mexican 8%
- Common ancestry
- Italian 3% Romanian 2% Lithuanian 2%
- Foreign-born
- 18% · Canada, China, Vietnam
- Languages at home
- 76% English-only · Spanish 8% Other Indo-European 3% Chinese 2%
Political lean MEDSL · Alameda
- 2024 margin
- Solid D (+53.6) · D 74.6% · R 21.0% · Other 4.4%
- 2008→2024 swing
- -5.9pp toward R · 2008: 59.5pp · 2024: 53.6pp
- All cycles
- 2024: D+53.6 2020: D+62.5 2016: D+64.4 2012: D+59.8 2008: D+59.5
Not yet ingested
- Civics
- —
Market trends
- HPI YoY
- ▼ -765.68%
- Current HPI
- 327.2982
- Rent YoY
- ▲ 6.51%
- Metro
- San Francisco-Oakland-Berkeley, CA
- State GDP YoY
- ▲ 3.21%
- F500 in state
- 116
Industry mix (Fortune 500 HQ in CA)
| Industry | F500 HQs | Revenue |
|---|---|---|
| Technology | 27 | $1,492B |
|
||
| Financial Services | 3 | $174B |
|
||
| Retail | 3 | $44B |
|
||
| Insurance | 3 | $26B |
|
||
| Media / Entertainment | 2 | $115B |
|
||
| Pharmaceuticals / Biotech | 2 | $62B |
|
||
Price history
1 event — show timeline
- 2026-06-11 Listed $849,000 bridgeMLS, Bay East AOR, or Contra Costa AOR
Cash-flow waterfall
monthlySold comps — $/sqft
last 12 mo · ≤1 miLoading sold comps…