 Multi-family
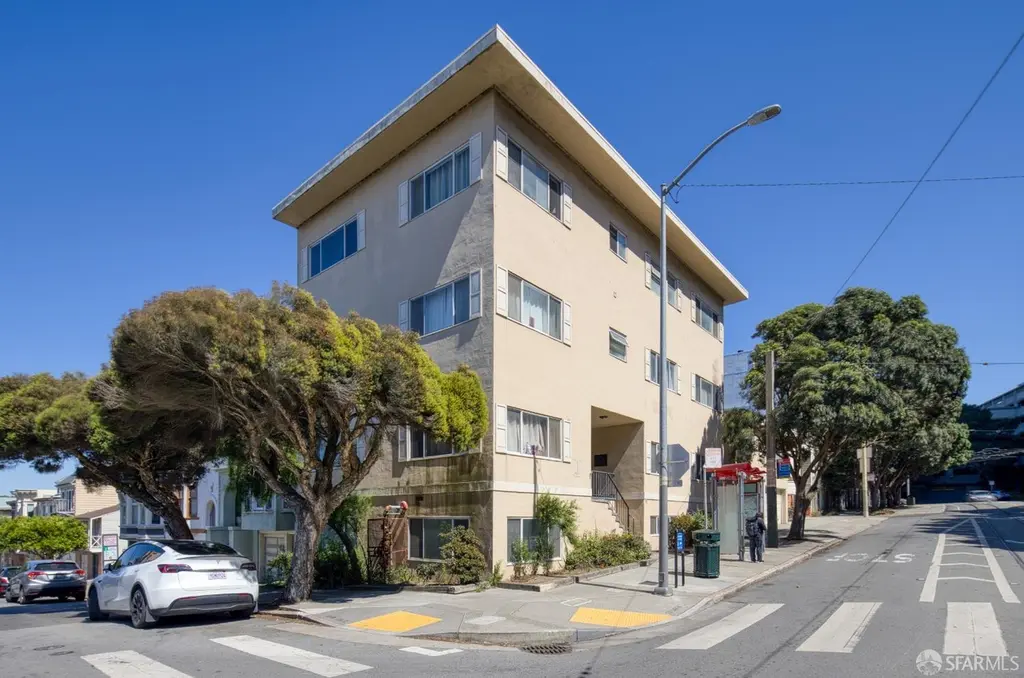
40 Irving St · San Francisco, CA
Flood risk 1/10 · Minimal
- FEMA flood zone
- X (unshaded)
- Chance of flooding over 30 yrs
- 0.0%
- Est. flood insurance / yr
- $507 – $1,088
Fire risk 1/10 · Minimal
- Est. fire insurance / yr
- $659 – $1,223
Heat risk 2/10 · Minimal
- Hot days now (above 74°F)
- 8 days/yr
- Hot days in 30 yrs
- 18 days/yr
Wind risk 1/10 · Minimal
- Chance of severe wind over 30 yrs
- —
Air-quality risk 7/10 · Major
- Unhealthy air days now
- 13 days/yr
- Unhealthy air days in 30 yrs
- 13 days/yr
Risk factors via First Street. Map © Google.
Why this score? — see what drove the D grade
The composite is a weighted blend of 9 inputs, each scored 0–100. Each bar is that input's sub-score; the figure is the points it added to the 100-point composite (weight × sub-score).
- Cash flow +19.4/30.0
- DSCR +6.1/10.0
- 1% rule +5.2/10.0
- Schools +5.0/10.0
- Livability +3.8/5.0
- Rent growth +2.5/5.0
- Condition / age +2.2/5.0
- ARV discount +0.0/15.0
- Appreciation +0.0/10.0
$3,800,000
🖨 Deal sheet (PDF) 📄 Offer letter ✓ Due diligence
Multi-family units
County records classify this as Multi-Family (2-4 Unit). Listing-text estimate: 1 unit. estimate disagrees with records
Listing remarks MLS
40-50 Irving Street is a 9,157 square foot multifamily property situated on a 3,325 square foot lot in San Francisco's highly sought-after Inner Sunset neighborhood. Built in 1908, the building comprises nine (9) units with a unique and diverse unit mix: one (1) studio, one (1) private room with bath, two (2) 1 BD / 1 BA units, two (2) 2 BD / 1 BA units, one (1) 3 BD / 1 BA unit, one (1) 5 BD / 2 BA unit, and one (1) 5 BD / 3 BA unit. The property also features four (4) parking spaces, in-building laundry, and a lobby with terrazzo and tile flooring. Interiors highlight granite countertops, shaker cabinetry, hardwood and tile flooring, recessed lighting, and excellent natural light. Many units include formal dining areas, spacious living rooms, and generous closet space. Recent improvements include updated windows, gas wall heating, and modernized electrical service. Located in the heart of the Inner Sunset, residents enjoy immediate access to Golden Gate Park, UCSF Medical Center, a wide array of restaurants, cafs, and neighborhood amenities, as well as excellent public transportation and tech shuttle access. 40-50 Irving Street presents a rare opportunity to acquire a classic, well-located San Francisco multifamily asset with historic character and modern upgrades.
Key facts
- Hardwood flooring
- In-building laundry
- Multifamily property
Tags
Neighborhood map
What this means for you Summary
Snapshot
- This is a 10-bed/?-bath multifamily listed at $3.80M. Condition is rated fair.
Deal economics
- At list price, monthly cash flow is $4k ($51k/yr) — positive.
- The deal already cash-flows at list — no discount required.
- Meets the 1% rule at list price ($39k rent vs $3.80M).
- Recommended offer: $3.34M (12.0% below list) — sets the bar for market timing.
- Cap rate 7.6% vs local median 2.1% in San Francisco — top-decile yield for the area; either an underpriced asset or a hidden risk that comps aren't pricing in. Stress-test before assuming the spread holds.
Location & tenants
- Location reads 76/100 on livability (#90 in CA, #3,143 nationally) — a middle-class / working-renter tenant base. Strengths: amenities A+, commute A+, employment A+; Watch: crime F, cost of living F.
- San Francisco Unified (urban): math 50% / reading 56% proficiency, ranked #322 of 1,400 in CA (top 23%) — acceptable for families but not a draw, mixed tenant base, ~2y average lease.
- Zoned schools: Lilienthal (Claire) Elementary (669 students, 19% FRL); Giannini (A.P.) Middle (1,192 students, 34% FRL); Lowell High (2,632 students, 37% FRL) — zoned schools average 30% FRL vs 49% district-wide (19 pts lower); this property's tenant base skews higher-income than the district average.
- Market conditions: 750 units permitted in San Francisco County in 2024 (688 in 5+ unit buildings).
Forward outlook
- Local home prices are declining (-3.0%/yr); year-one equity from $26k of loan paydown is wiped out by about $114k of value loss. Plan a longer hold.
- San Francisco County population projected at +39% by 2050 — long-run rental-demand tailwind backs the buy-and-hold thesis.
Negotiation context
- It's been on market 247 days — a 12% lower offer ($3.34M) is reasonable based on typical stale-listing flexibility.
- 2 sale attempts since 11y ago with the ask held roughly flat each time — persistent listings suggest the price (not the market) is what's stuck; bring a comps-based counter.
Risks & watch-outs
- Watch-outs: built in 1908 — expect roof / HVAC / electrical / plumbing capex.
Questions for the listing agent
- It's been on market 247 days. Have you received any prior offers? Is the seller open to a 12% concession, seller financing, or rate buy-down credit?
- Have any recent inspections been done? Can we get a copy of the seller's disclosures and any deferred-maintenance estimates?
- Built in 1908 — when were the roof, HVAC, electrical panel, plumbing, and water heater last replaced?
- Why hasn't it sold? Are there any deal-killer items the seller is aware of (foundation, flood, title, zoning, code violations)?
- Is there a deadline driving the sale (1031 exchange, divorce, estate, relocation)? That informs how much negotiation room exists.
- Schools are B-rated — typically a magnet for longer-tenancy family renters. What's the average tenant stay here, and is there a school-zone premium baked into asking?
- Crime grade is F in this area — have there been break-ins, vandalism, or insurance claims at this property in the last 3 years? What carrier currently insures it and at what premium?
- The area grade is low — what's the realistic commute time and amenity access for the typical tenant pool here? Any planned neighborhood developments (good or bad) we should know about?
- What's the average days-on-market for RENTAL listings here right now (not sales)? A rising rental-DOM trend means longer vacancies and softer asking-rent achievability than the comps imply.
- What's the recent tenant-quality profile in this submarket — average credit score on applications, eviction rate, late-payment / NSF rate, and stable-employment percentage? A property-management company in the area should have these aggregated.
- How much new apartment / multifamily construction is in the pipeline within 1–3 miles? Heavy new supply (>2% of stock underway) typically softens rents 12–24 months out; light construction supports rent growth.
Investment metrics
- 1% rule
- 1.02% ✓
- Cap rate
- 7.64%
- Cash-on-cash
- 4.82%
- DSCR
- 1.21
- GRM
- 8.2
CMA / ARV
- ARV (median comp)
- $3,159,228
- List price
- $3,800,000
- Delta
- 20.28%
- Verdict
- OVERPRICED
- Comps
- 7 within 1.0 mi
Projected returns pro-forma
-3.0% appreciation · 3.0% rent growth · sell at horizon
- IRR
- -8.8%
- Equity multiple
- 0.68×
- Total profit
- $-343,159
- Equity at exit
- $566,592
- IRR
- 0.7%
- Equity multiple
- 1.05×
- Total profit
- $53,822
- Equity at exit
- $328,555
Cash invested: $1,064,000 (down + closing). Projections, not guarantees.
Landlord ↔ Tenant lean methodology
- Overall (CITY)
- 0 Strongly Tenant-Friendly
- State California
- 18 Strongly Tenant-Friendly · D+13
- County
- — inherits STATE
- City San Francisco
- 0 Strongly Tenant-Friendly · D+57
ZIP-level market 01908
- Home prices YoY
- -21.5%
- Price-to-rent
- 74.2×
Monthly cashflow live
- Estimated rent
- $38,648 high interval (Pro) →
- Mortgage (P&I)
- −$19,928
- Tax est. 1.5%
- −$4,750 /mo · $57,000/yr
- Insurance
- −$1,583
- HOA
- −$0
- Vacancy / Maint / Mgmt
- −$8,116
- Net cashflow
- $4,271
Break-even live
Sensitivity live
| Price | -10% $6,897 | -5% $5,584 | +0% $4,271 | +5% $2,958 | +10% $1,645 |
|---|---|---|---|---|---|
| Rent | -10% $1,218 | -5% $2,744 | +0% $4,271 | +5% $5,798 | +10% $7,324 |
| Rate | -1.0pp $6,185 | -0.5pp $5,237 | base $4,271 | +0.5pp $3,286 | +1.0pp $2,285 |
9-unit breakdown (identical units grouped — click to expand)
| Units | Beds | Baths | Est. rent |
|---|---|---|---|
| 2× units | 1 | 1 | $8,538 |
| #1 | 1 | 1 | $4,269 |
| #2 | 1 | 1 | $4,269 |
| 4× units | 2 | 1 | $19,540 |
| #3 | 2 | 1 | $4,885 |
| #4 | 2 | 1 | $4,885 |
| #5 | 2 | 1 | $4,885 |
| #6 | 2 | 1 | $4,885 |
| 1× unit | 3 | 1 | $5,223 |
| 1× unit | 5 | 2 | $2,674 |
| 1× unit | 5 | 3 | $2,674 |
| Total (9 units) | $38,648 | ||
UW: 25.0% down · 7.5% · 30yr · 1.5% tax · 5.0% vac · 8.0% maint · 8.0% mgmt
Financing live
Cash to close
- Down payment
- $950,000
- Closing costs
- $114,000
- Reserves months
- —
- Total cash needed
- —
Loan-product check · same deal, 3 products live
Conventional
25% down · 7.5% · 30yr
- Down + closing
- —
- Monthly P&I
- —
- Monthly cashflow
- —
- DSCR
- —
- Eligible?
- —
Personal DTI + credit; lowest rate.
DSCR
20% down · 8.5% · 30yr
- Down + closing
- —
- Monthly P&I
- —
- Monthly cashflow
- —
- DSCR
- —
- Eligible?
- —
No personal income docs; deal must DSCR.
Hard money
10% down · 12.0% · 12mo
- Down + closing
- —
- Monthly P&I
- —
- Monthly cashflow
- —
- DSCR
- —
- Eligible?
- —
Short-term bridge; refi at stabilization.
Listing history 8 events
-
2026-06-03days on market $3,800,000 Active 247 DOM
-
2026-06-02days on market $3,800,000 Active 246 DOM
-
2026-06-01days on market $3,800,000 Active 245 DOM
-
2026-05-31days on market $3,800,000 Active 244 DOM
-
2025-09-29$3,800,000 Active 1287-char remark
Show marketing remark (1287 chars)
40-50 Irving Street is a 9,157 square foot multifamily property situated on a 3,325 square foot lot in San Francisco's highly sought-after Inner Sunset neighborhood. Built in 1908, the building comprises nine (9) units with a unique and diverse unit mix: one (1) studio, one (1) private room with bath, two (2) 1 BD / 1 BA units, two (2) 2 BD / 1 BA units, one (1) 3 BD / 1 BA unit, one (1) 5 BD / 2 BA unit, and one (1) 5 BD / 3 BA unit. The property also features four (4) parking spaces, in-building laundry, and a lobby with terrazzo and tile flooring. Interiors highlight granite countertops, shaker cabinetry, hardwood and tile flooring, recessed lighting, and excellent natural light. Many units include formal dining areas, spacious living rooms, and generous closet space. Recent improvements include updated windows, gas wall heating, and modernized electrical service. Located in the heart of the Inner Sunset, residents enjoy immediate access to Golden Gate Park, UCSF Medical Center, a wide array of restaurants, cafs, and neighborhood amenities, as well as excellent public transportation and tech shuttle access. 40-50 Irving Street presents a rare opportunity to acquire a classic, well-located San Francisco multifamily asset with historic character and modern upgrades.
-
2016-04-01soldstatus $4,000,000 Closed 473-char remark
Show marketing remark (473 chars)
40-50 Irving Street consists of 2 buildings comprised of a 10 bedroom group housing facility with 6 baths and a separate 2 bedroom/1 bath residence. The property is located in the Inner Sunset district of San Francisco. This is a unique opportunity for an investor to purchase a corner building directly across from the University of California Medical Center considered to be one of the top ten hospitals in the nation. The property will be delivered vacant in March 2016.
-
2015-03-19status Contingent - Show 473-char remark
Show marketing remark (473 chars)
40-50 Irving Street consists of 2 buildings comprised of a 10 bedroom group housing facility with 6 baths and a separate 2 bedroom/1 bath residence. The property is located in the Inner Sunset district of San Francisco. This is a unique opportunity for an investor to purchase a corner building directly across from the University of California Medical Center considered to be one of the top ten hospitals in the nation. The property will be delivered vacant in March 2016.
-
2015-03-05$4,000,000 Active 473-char remark
Show marketing remark (473 chars)
40-50 Irving Street consists of 2 buildings comprised of a 10 bedroom group housing facility with 6 baths and a separate 2 bedroom/1 bath residence. The property is located in the Inner Sunset district of San Francisco. This is a unique opportunity for an investor to purchase a corner building directly across from the University of California Medical Center considered to be one of the top ten hospitals in the nation. The property will be delivered vacant in March 2016.
ⓘ Source: listings_history table (triggers on properties + properties_extension) + one-shot
backfill from property_details.listing_events for pre-trigger history.
Climate risk First Street
- Flood 1/10 Low FEMA zone X (unshaded) · 0% chance over 30 yrs
- Wildfire 1/10 Low
- Heat 2/10 Low 8 d/yr ≥74°F today · 18 d/yr by 30 yrs out
- Wind 1/10 Low
- Air quality 7/10 Severe 13 unhealthy d/yr today · 13 by 30 yrs out
Nearby sold comps map
Loading sold comps map…
Walkable amenities ~0.75 mi
Loading nearby amenities…
Taxation est. · year 1
- Rental income
- $463,776
- − Mortgage interest
- −$212,859
- − Property taxes
- −$57,000
- − Insurance
- −$19,000
- − Repairs & maintenance
- −$37,102
- − Management
- −$37,102
- − Depreciation
- −$110,545
- Taxable loss
- −$9,833
- Est. tax savings @ 24.0%
- +$2,360
- After-tax cash flow
- $53,612/yr
For passive investors: Depreciation is non-cash, so a rental often shows a tax loss while cash-flowing — sheltering income. Rental losses are passive: they offset passive income freely, and up to $25,000/yr can offset ordinary (W-2) income if you actively participate and your MAGI is under $100k (phasing out to $0 by $150k); unused losses carry forward. On sale, claimed depreciation is recaptured at up to 25%, and gains may owe capital-gains tax (a 1031 exchange can defer both). Figures are a year-1 estimate at your 24.0% rate — not tax advice; consult a CPA.
Condition & rehab AI · 2 photos
The property requires moderate repairs to the exterior siding and landscaping, but is otherwise in fair condition. Painting and trimming the landscaping would significantly enhance its curb appeal and value.
Repairs flagged
- Moderate exterior siding — Weathered and discolored
- Minor landscaping — Overgrown vegetation
Value-add opportunities
- Both paint exterior — Enhances curb appeal and property value
- Both landscaping — Improves curb appeal and property value
Renovation cost estimate screening
| Repair item | Severity | Est. cost |
|---|---|---|
| exterior siding · Weathered and discolored | Moderate | $3,000–15,000 |
| landscaping · Overgrown vegetation | Minor | $500–3,000 |
| Total estimated repair cost · 2 items | $3,500–18,000 |
Value-add ROI direction
- Both paint exterior — Enhances curb appeal and property value ↑
- Both landscaping — Improves curb appeal and property value ↑
ⓘ Cost ranges are severity-bucket heuristics (US national rule-of-thumb). Get contractor quotes + a written scope before underwriting a rehab budget.
Schools (NCES district)
- District
- San Francisco Unified
- NCES district ID
- 0634410
- Math proficiency
- 50% ▬ 0.00%
- Reading proficiency
- 56% ▲ 1.00%
- Median HH income
- $81,249
- Composite
- 50.14/100
- National rank
- #4088
- State rank
- #322 of 1400 in CA
Livability — San Francisco
- Score
- 76/100
- State rank
- #90
- US rank
- #3143
Category grades
Schools grade is shown separately in the Schools card above.
Census & demographics
- Census place
- San Francisco, CA
- City population
- 827,552
- Population (ZIP)
- 3,328
Population outlook (San Francisco County) Hauer SSP2
- Today (2025)
- 1,030,936 people
- By 2030
- 1,110,409 · +7.7%
- By 2040
- 1,270,010 · +23.2%
- By 2050
- 1,435,001 · +39.2%
- By 2075
- 1,779,074 · +72.6%
- By 2100
- 1,966,767 · +90.8%
Race, ethnicity, and origin ACS 2023
- Neighborhood character
- Predominantly White (92%)
- Race & ethnicity
- White 92% Two or more races 5% Black 2% Hispanic / Latino 1%
- Common ancestry
- Slovak 6% Lithuanian 6% Romanian 4%
- Foreign-born
- 6% · Canada, China
- Languages at home
- 91% English-only · Other Indo-European 5% Russian/Polish/Slavic 2% French/Haitian/Cajun 1%
Political lean MEDSL · San Francisco
- 2024 margin
- Solid D (+64.8) · D 80.3% · R 15.5% · Other 4.1%
- 2008→2024 swing
- -5.7pp toward R · 2008: 70.5pp · 2024: 64.8pp
- All cycles
- 2024: D+64.8 2020: D+72.5 2016: D+76.1 2012: D+70.2 2008: D+70.5
Not yet ingested
- Civics
- —
Market trends
- HPI YoY
- ▼ -90.88%
- Current HPI
- 331.048
- Rent YoY
- —
- Metro
- —
- State GDP YoY
- ▲ 3.21%
- F500 in state
- 116
Industry mix (Fortune 500 HQ in CA)
| Industry | F500 HQs | Revenue |
|---|---|---|
| Technology | 27 | $1,492B |
|
||
| Financial Services | 3 | $174B |
|
||
| Retail | 3 | $44B |
|
||
| Insurance | 3 | $26B |
|
||
| Media / Entertainment | 2 | $115B |
|
||
| Pharmaceuticals / Biotech | 2 | $62B |
|
||
Price history
-5.0% since first listed4 events — show timeline
- 2025-09-29 Listed $3,800,000 San Francisco MLS
- 2016-04-01 Sold (MLS) $4,000,000 San Francisco MLS
- 2015-03-19 Pending — San Francisco MLS
- 2015-03-05 Listed $4,000,000 San Francisco MLS
Cash-flow waterfall
monthlySold comps — $/sqft
last 12 mo · ≤1 miLoading sold comps…