4993 Gateshead St · Detroit, MI
Flood risk 1/10 · Minimal
- FEMA flood zone
- X (unshaded)
- Chance of flooding over 30 yrs
- 0.0%
- Est. flood insurance / yr
- $473 – $860
Fire risk 1/10 · Minimal
- Est. fire insurance / yr
- $784 – $1,456
Heat risk 3/10 · Minor
- Hot days now (above 96°F)
- 7 days/yr
- Hot days in 30 yrs
- 15 days/yr
Wind risk 2/10 · Minimal
- Chance of severe wind over 30 yrs
- —
Air-quality risk 3/10 · Minor
- Unhealthy air days now
- 3 days/yr
- Unhealthy air days in 30 yrs
- 4 days/yr
Risk factors via First Street. Map © Google.
Why this score? — see what drove the D grade
The composite is a weighted blend of 9 inputs, each scored 0–100. Each bar is that input's sub-score; the figure is the points it added to the 100-point composite (weight × sub-score).
- Cash flow +13.9/30.0
- ARV discount +7.5/15.0
- 1% rule +6.7/10.0
- DSCR +4.2/10.0
- Livability +3.7/5.0
- Rent growth +2.5/5.0
- Condition / age +2.5/5.0
- Schools +1.3/10.0
- Appreciation +0.0/10.0
$87,900
🖨 Deal sheet 📄 Offer letter ✓ Due diligence
Listing remarks MLS
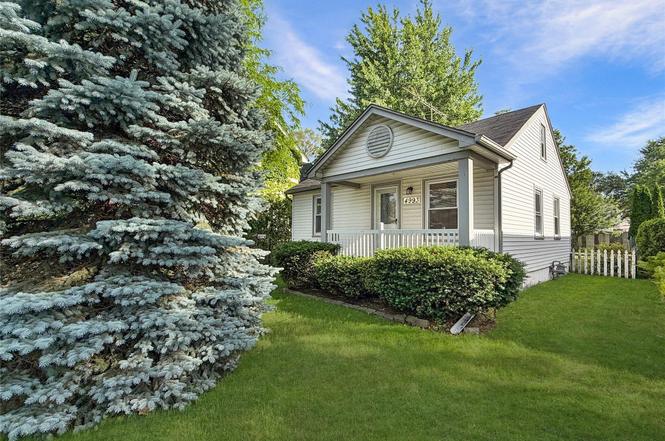
Welcome to 4993 Gateshead Street, a charming Detroit ranch that blends original character with everyday functionality. Hardwood floors run throughout the living room and bedrooms, while vinyl replacement windows provide abundant natural light. Classic details including a coved plaster ceiling, picture rail molding, and an arched built-in niche add warmth and character. The kitchen features white cabinetry, included appliances, and convenient access to the dining area. A sliding glass door opens to the fenced backyard. Two bedrooms offer hardwood flooring, ceiling fans, and closet space, while the full bathroom includes a tub/shower combination and exhaust fan. The full basement features glass block windows, washer and dryer, gas forced-air furnace, gas water heater, and excellent storage or workshop space. A walk-up attic provides additional storage. Outside, enjoy a detached 2-car garage, gated driveway, and fenced backyard. Conveniently located near Balduck Park, Chandler Park, the East Warren Avenue commercial corridor, Mack Avenue restaurants and shopping, Henry Ford St. John Hospital, Lake St. Clair, the Detroit River waterfront, the Conner Creek Greenway, and I-94. Located in the City of Detroit with a Grosse Pointe 48236 mailing address, this property offers an excellent opportunity for homeowners or investors.
Key facts
- Hardwood floors
- Picture rail molding
- White cabinetry
Tags
Property features AI
Exterior
- Parking: Detached 2-car garage
- Utilities: Public water; Public sewer
- Home design: Single family residence; One story; Ground-level entry with steps; Vinyl siding
- Construction: Asphalt roof; Block foundation; Built with vinyl siding
- Exterior features: Covered porch; Back yard fencing; Paved road access; Sidewalks in the community
Interior
- Kitchen: No kitchen appliance specifics listed
- Bedrooms: 5 total rooms (includes bedrooms and living spaces)
- Bathrooms: 1 full bathroom
- Heating & cooling: Forced air heating (natural gas); Ceiling fans; No central air listed
- Interior features: Gas water heater; Walk-out, daylight, full unfinished basement with interior entry
- Laundry & utility: Dedicated laundry room; Washer and dryer included
Neighborhood map
What this means for you Summary
Snapshot
- This is a 2-bed/1.0-bath single-family listed at $88k.
Deal economics
- At list price, monthly cash flow is $9 ($113/yr) — positive.
- The deal already cash-flows at list — no discount required.
- Meets the 1% rule at list price ($1k rent vs $88k).
- Cap rate 6.4% vs local median 10.2% in Detroit — below-typical yield; the buyer is paying a premium for something (appreciation thesis, condition, location) that the cap rate doesn't capture.
Location & tenants
- Location reads 73/100 on livability (#218 in MI) — a middle-class / working-renter tenant base. Strengths: amenities A+, commute A+, cost of living A+; Watch: schools F, crime F, employment F.
- Detroit Public Schools Community District (urban): math 10% / reading 24% proficiency, ranked #499 of 540 in MI (top 92%) — low school quality limits family demand, transient renter base, plan for 1-2y turnover; 90% free/reduced lunch — lower-income household profile, screen leases tightly.
- Market conditions: 159 active listings in the ZIP; 9 comparable units currently listed for rent nearby; rentals at typical pace (median 22d on market — plan ~3-4 weeks tenant-placement turnaround); 44% of comp listings sitting > 30 days — soft ceiling on asking rent; 2,639 units permitted in Wayne County in 2024 (1,216 in 5+ unit buildings).
Forward outlook
- Local home prices are declining (-3.0%/yr); year-one equity from $608 of loan paydown is wiped out by about $3k of value loss. Plan a longer hold.
- Wayne County population projected at -17% by 2050 — secular population decline; favor cash flow + early exit over multi-decade hold.
Negotiation context
- Only 2 days on market — expect competitive offers; lowballing is unlikely to land.
- 7 sale attempts since 12y ago with the ask held roughly flat each time — persistent listings suggest the price (not the market) is what's stuck; bring a comps-based counter.
- Current owner paid $50k; list at $88k implies a 74% gain — meaningful room to come down on a strong offer.
Risks & watch-outs
- Watch-outs: property tax is 4.2% of price; built in 1949 — expect roof / HVAC / electrical / plumbing capex.
Questions for the listing agent
- Built in 1949 — when were the roof, HVAC, electrical panel, plumbing, and water heater last replaced?
- Property tax is high relative to price — has the assessment been appealed recently, and will the sale trigger a re-assessment?
- Is there a deadline driving the sale (1031 exchange, divorce, estate, relocation)? That informs how much negotiation room exists.
- Schools are F-rated, which usually means shorter tenancies and higher turnover. Who's the typical renter profile here, and what's been the actual vacancy rate?
- Crime grade is F in this area — have there been break-ins, vandalism, or insurance claims at this property in the last 3 years? What carrier currently insures it and at what premium?
- The area grade is low — what's the realistic commute time and amenity access for the typical tenant pool here? Any planned neighborhood developments (good or bad) we should know about?
- What's the average days-on-market for RENTAL listings here right now (not sales)? A rising rental-DOM trend means longer vacancies and softer asking-rent achievability than the comps imply.
- What's the recent tenant-quality profile in this submarket — average credit score on applications, eviction rate, late-payment / NSF rate, and stable-employment percentage? A property-management company in the area should have these aggregated.
- How much new for-sale + rental construction is in the pipeline within 1–3 miles? Heavy new supply typically softens prices + rents 12–24 months out; constrained supply supports both.
Investment metrics
- 1% rule
- 1.17% ✓
- Cap rate
- 6.42%
- Cash-on-cash
- 0.46%
- DSCR
- 1.02
- GRM
- 7.1
CMA / ARV
- ARV (on-the-fly)
- $53,535
- Comps found
- 12
Show comp detail 12 sales within ~0.75 mi
| Address | Dist | Beds/Ba | Sqft | Sold | Price | $/sf | Match |
|---|---|---|---|---|---|---|---|
| 5031 Anatole St | 0.16mi | 2/1.0 | 654 (+1%) | 18mo | $85,000 | $130 | 75 |
| 5310 Lafontaine St | 0.21mi | 2/1.0 | 629 (-2%) | 16mo | $69,900 | $111 | 73 |
| 5558 Radnor St | 0.39mi | 2/1.0 | 660 (+2%) | 6mo | $18,000 | $27 | 73 |
| 5220 Lafontaine St | 0.14mi | 2/1.0 | 604 (-6%) | 14mo | $30,500 | $50 | 71 |
| 5036 Farmbrook St | 0.42mi | 2/1.0 | 670 (+4%) | 18mo | $28,000 | $42 | 59 |
| 4528 Marseilles St | 0.64mi | 3/1.0 (+1) | 637 (-1%) | 7mo | $77,500 | $122 | 57 |
| 4607 Radnor St | 0.49mi | 2/1.0 | 731 (+13%) | 2mo | $50,000 | $68 | 53 |
| 4811 Radnor St | 0.47mi | 2/1.0 | 719 (+12%) | 10mo | $50,000 | $70 | 51 |
| 5057 Anatole St | 0.18mi | 1/1.0 (-1) | 573 (-11%) | 22mo | $67,000 | $117 | 50 |
| 5290 University Pl | 0.58mi | 2/1.0 | 721 (+12%) | 5mo | $60,000 | $83 | 49 |
| 5298 Neff Ave | 0.73mi | 2/1.0 | 720 (+12%) | 2mo | $46,000 | $64 | 45 |
| 5546 Neff Ave | 0.74mi | 2/1.0 | 720 (+12%) | 14mo | $74,900 | $104 | 35 |
Match score weights: distance 35% · size 25% · config 20% · recency 20%. Top-matched comps best support the ARV.
Projected returns pro-forma
-3.0% appreciation · 3.0% rent growth · sell at horizon
- IRR
- -15.4%
- Equity multiple
- 0.45×
- Total profit
- $-13,507
- Equity at exit
- $13,106
- IRR
- -6.6%
- Equity multiple
- 0.58×
- Total profit
- $-10,436
- Equity at exit
- $7,600
Cash invested: $24,612 (down + closing). Projections, not guarantees.
Landlord ↔ Tenant lean methodology
- Overall (STATE)
- 62 Landlord-Friendly
- State Michigan
- 62 Landlord-Friendly · EVEN
- County
- — inherits STATE
- City
- — inherits STATE
ZIP-level market 48236
- Active inventory
- 159
- Price-to-rent
- 7.1×
Monthly cashflow live
- Estimated rent
- $1,028 high interval (Pro) →
- Mortgage (P&I)
- −$461
- Tax from tax record
- −$305 /mo · $3,661/yr
- Insurance
- −$37
- HOA
- −$0
- Vacancy / Maint / Mgmt
- −$216
- Net cashflow
- $9
Break-even live
UW: 25.0% down · 7.5% · 30yr · 1.5% tax · 5.0% vac · 8.0% maint · 8.0% mgmt
Financing live
Cash to close
- Down payment
- $21,975
- Closing costs
- $2,637
- Reserves months
- —
- Total cash needed
- —
Loan-product check · same deal, 3 products live
Conventional
25% down · 7.5% · 30yr
- Down + closing
- —
- Monthly P&I
- —
- Monthly cashflow
- —
- DSCR
- —
- Eligible?
- —
Personal DTI + credit; lowest rate.
DSCR
20% down · 8.5% · 30yr
- Down + closing
- —
- Monthly P&I
- —
- Monthly cashflow
- —
- DSCR
- —
- Eligible?
- —
No personal income docs; deal must DSCR.
Hard money
10% down · 12.0% · 12mo
- Down + closing
- —
- Monthly P&I
- —
- Monthly cashflow
- —
- DSCR
- —
- Eligible?
- —
Short-term bridge; refi at stabilization.
Rent comps 9 comps
| Address | Beds | Baths | Sqft | Rent | $/sqft | DOM | Units | Dist |
|---|---|---|---|---|---|---|---|---|
| 21301 Kingsville St Apt 108 Harper Woods, MI | 1.0 | 1.0 | 700 | $900 | $1.29 | 3d | 1 | 0.86mi |
| 4865 Cadieux Rd Unit 11 Detroit, MI | 2.0 | 1.0 | 630 | $1,200 | $1.90 | 43d | 1 | 1.04mi |
| 4837 Cadieux Rd Unit 9 Detroit, MI | 2.0 | 1.0 | 650 | $1,200 | $1.85 | 43d | 1 | 1.04mi |
| 4811 Cadieux Rd Unit 10 Detroit, MI | 2.0 | 1.0 | 663 | $1,200 | $1.81 | 43d | 1 | 1.05mi |
| 4811 Cadieux Rd Unit 11 Detroit, MI | 2.0 | 1.0 | 663 | $1,200 | $1.81 | 22d | 1 | 1.05mi |
| 4811 Cadieux Rd Unit 2 Detroit, MI | 1.0 | 1.0 | 600 | $950 | $1.58 | 43d | 1 | 1.05mi |
| 16927 Chandler Park Dr Unit 3_ Detroit, MI | 1.0 | 1.0 | 600 | $900 | $1.50 | 15d | 1 | 1.15mi |
| 17161 Denver St Detroit, MI | 1.0 | 1.0 | 700 | $800 | $1.14 | 12d | 1 | 1.26mi |
| 17161 Denver St Apt 10 Detroit, MI | 1.0 | 1.0 | 700 | $800 | $1.14 | 11d | 1 | 1.26mi |
Listing history 3 events
-
2026-06-18days on market $87,900 Active 2 DOM
-
2026-06-17remarks 699-char remark
-
2026-06-17$87,900 Active 1 DOM
ⓘ Source: listings_history table (triggers on properties + properties_extension) + one-shot
backfill from property_details.listing_events for pre-trigger history.
Tax reassessment forecast MI · Partial reset (capped growth)
- Current annual tax
- $3,661 · $305/mo
- Projected year-2 tax
- $3,661 · $305/mo
- Expected delta
- $0/yr ($0/mo · 0.0%)
ⓘ Screening estimate from a state-policy table — verify with the county assessor before closing.
Climate risk First Street
- Flood 1/10 Low FEMA zone X (unshaded) · 0% chance over 30 yrs
- Wildfire 1/10 Low
- Heat 3/10 Moderate 7 d/yr ≥96°F today · 15 d/yr by 30 yrs out
- Wind 2/10 Low
- Air quality 3/10 Moderate 3 unhealthy d/yr today · 4 by 30 yrs out
Nearby sold comps map
Loading sold comps map…
Walkable amenities ~0.75 mi
Loading nearby amenities…
Taxation est. · year 1
- Rental income
- $12,335
- − Mortgage interest
- −$4,924
- − Property taxes
- −$3,661
- − Insurance
- −$440
- − Repairs & maintenance
- −$987
- − Management
- −$987
- − Depreciation
- −$2,557
- Taxable loss
- −$1,219
- Est. tax savings @ 24.0%
- +$293
- After-tax cash flow
- $406/yr
For passive investors: Depreciation is non-cash, so a rental often shows a tax loss while cash-flowing — sheltering income. Rental losses are passive: they offset passive income freely, and up to $25,000/yr can offset ordinary (W-2) income if you actively participate and your MAGI is under $100k (phasing out to $0 by $150k); unused losses carry forward. On sale, claimed depreciation is recaptured at up to 25%, and gains may owe capital-gains tax (a 1031 exchange can defer both). Figures are a year-1 estimate at your 24.0% rate — not tax advice; consult a CPA.
Schools (NCES district)
- District
- Detroit Public Schools Community District
- NCES district ID
- 2601103
- Math proficiency
- 10% ▼ -2.00%
- Reading proficiency
- 24% ▲ 6.00%
- Median HH income
- $25,815
- Composite
- 13.06/100
- National rank
- #9564
- State rank
- #499 of 540 in MI
Livability — Detroit
- Score
- 73/100
- State rank
- #218
- US rank
- #5427
Category grades
Schools grade is shown separately in the Schools card above.
Census & demographics
- Census place
- Detroit, MI
- City population
- 572,865
- Population (ZIP)
- 31,383
Population outlook (Wayne County) Hauer SSP2
- Today (2025)
- 1,675,273 people
- By 2030
- 1,620,300 · -3.3%
- By 2040
- 1,502,341 · -10.3%
- By 2050
- 1,384,039 · -17.4%
- By 2075
- 1,124,592 · -32.9%
- By 2100
- 881,193 · -47.4%
Race, ethnicity, and origin ACS 2023
- Neighborhood character
- Predominantly White (82%)
- Race & ethnicity
- White 82% Black 11% Two or more races 5% Asian 2% Hispanic / Latino 1%
- Common ancestry
- Romanian 10% Lithuanian 5% Italian 4%
- Foreign-born
- 7% · Canada
- Languages at home
- 93% English-only · Other Indo-European 2% Arabic 2% Spanish 1%
Political lean MEDSL · Wayne
- 2024 margin
- Strong D (+29.0) · D 62.7% · R 33.7% · Other 3.6%
- 2008→2024 swing
- -20.5pp toward R · 2008: 49.5pp · 2024: 29.0pp
- All cycles
- 2024: D+29.0 2020: D+38.1 2016: D+37.3 2012: D+46.9 2008: D+49.5
Not yet ingested
- Civics
- —
Market trends
- HPI YoY
- ▼ -285.11%
- Current HPI
- 181.0475
- Rent YoY
- —
- Metro
- —
- State GDP YoY
- ▲ 1.37%
- F500 in state
- 28
Industry mix (Fortune 500 HQ in MI)
| Industry | F500 HQs | Revenue |
|---|---|---|
| Automotive Parts | 3 | $48B |
|
||
| Automotive | 2 | $372B |
|
||
| Chemicals | 1 | $45B |
|
||
| Automotive Retail | 1 | $29B |
|
||
| Healthcare / Medical Devices | 1 | $23B |
|
||
| Automotive Technology | 1 | $20B |
|
||
Price history
+34.2% since first listed19 events — show timeline
- 2026-06-16 Listed $87,900 REALCOMP
- 2026-06-16 Listed $87,900 MiRealSource-MiMLS
- 2021-06-25 Sold (Public Records) $50,500 Public Records
- 2021-06-24 Sold (MLS) $50,500 MiRealSource-MiMLS
- 2021-06-24 Sold (MLS) $50,500 REALCOMP
- 2021-05-24 Pending — MiRealSource-MiMLS
- 2021-05-24 Pending — REALCOMP
- 2021-05-17 Listed $55,000 MiRealSource-MiMLS
- 2021-05-17 Listed $55,000 REALCOMP
- 2016-07-11 Sold (Public Records) $50,000 Public Records
- 2016-06-18 Listing Removed — MiRealSource-MiMLS
- 2016-06-17 Sold (MLS) $60,000 REALCOMP
- 2016-06-17 Sold (MLS) $60,000 MiRealSource-MiMLS
- 2016-05-11 Listing Removed — REALCOMP
- 2016-05-02 Listed $60,000 REALCOMP
- 2016-05-02 Listed $60,000 MiRealSource-MiMLS
- 2014-08-21 Listing Removed — MiRealSource-MiMLS
- 2014-04-21 Listed $850 MiRealSource-MiMLS
- 2004-03-15 Sold (Public Records) $65,500 Public Records
Property tax history
+12.1%/yrLatest (2025): $3,661 · +0.6% YoY. Source: county tax records.
Cash-flow waterfall
monthlySold comps — $/sqft
last 12 mo · ≤1 miLoading sold comps…