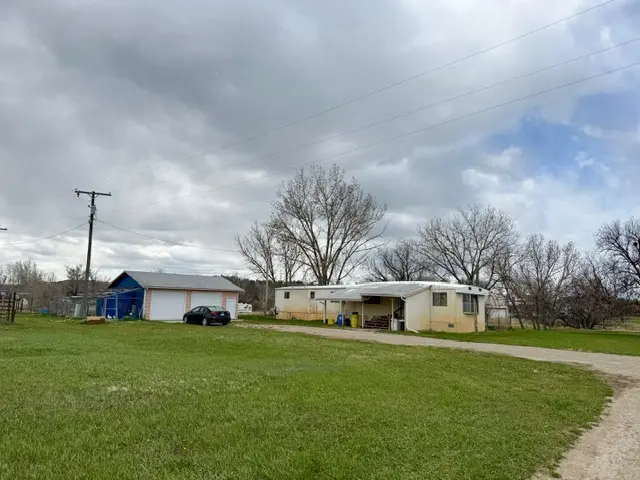
8 1st Avenue, Musselshell Ave · Musselshell, MT
Flood risk 6/10 · Moderate
- FEMA flood zone
- AE
- Chance of flooding over 30 yrs
- 0.54%
- Est. flood insurance / yr
- $1,737 – $8,500
Fire risk 5/10 · Moderate
- Est. fire insurance / yr
- $918 – $1,706
Heat risk 3/10 · Minor
- Hot days now (above 96°F)
- 7 days/yr
- Hot days in 30 yrs
- 13 days/yr
Wind risk 1/10 · Minimal
- Chance of severe wind over 30 yrs
- —
Air-quality risk 4/10 · Minor
- Unhealthy air days now
- 5 days/yr
- Unhealthy air days in 30 yrs
- 7 days/yr
Risk factors via First Street. Map © Google.
Why this score? — see what drove the B grade
The composite is a weighted blend of 9 inputs, each scored 0–100. Each bar is that input's sub-score; the figure is the points it added to the 100-point composite (weight × sub-score).
- Cash flow +30.0/30.0
- 1% rule +10.0/10.0
- DSCR +10.0/10.0
- ARV discount +7.5/15.0
- Appreciation +5.0/10.0
- Livability +3.2/5.0
- Rent growth +2.5/5.0
- Condition / age +2.5/5.0
- Schools +1.7/10.0
$35,000
🖨 Deal sheet 📄 Offer letter ✓ Due diligence
Key facts
- Separate shower
- Kitchen dining combo
- Pantry space
Tags
Property features AI
Finance
- Other: Zoning listed as UNZON
- Financial info: Annual tax amount listed
Exterior
- Parking: No dedicated garage; additional parking available
- Utilities: Public water; Public sewer
- Home design: Manufactured home (single-story)
- Construction: Metal roof
- Exterior features: Covered patio
Interior
- Kitchen: Includes dishwasher, gas range/oven, and refrigerator
- Bedrooms: 2 main-level bedrooms
- Bathrooms: 1 full bathroom (main level)
- Heating & cooling: Natural gas forced-air heating; Central air conditioning
- Interior features: Dishwasher; Gas range / Oven / Range; Refrigerator; No basement
- Laundry & utility: No specific laundry or utility appliances listed
Neighborhood map
What this means for you Summary
Snapshot
- This is a 2-bed/1.0-bath other listed at $35k.
Deal economics
- At list price, monthly cash flow is $160 ($2k/yr) — positive.
- The deal already cash-flows at list — no discount required.
- Meets the 1% rule at list price ($1k rent vs $35k).
- Recommended offer: $34k (3.0% below list) — sets the bar for market timing.
Location & tenants
- Location reads 64/100 on livability (#152 in MT) — a middle-class / working-renter tenant base. Strengths: cost of living A+, housing A+; Watch: health & safety C-, crime F, amenities F.
- Roundup High School (rural): math 20% / reading 11% proficiency, ranked #270 of 339 in MT (top 80%) — low school quality limits family demand, transient renter base, plan for 1-2y turnover.
- Zoned schools: Roundup H S (math 24% / reading 44%, grade F, #51 of 132 statewide, top 40%, 172 students, 0% FRL).
- Zoned-school proficiency averages 34% at this address vs 16% district-wide (+19 pts) — the actual schools serving this property are materially stronger than the Roundup High School average implies; a family-tenant draw the district grade alone would hide.
- Market conditions: 2 active listings in the ZIP; 3 units permitted in Musselshell County in 2024 (0 in 5+ unit buildings).
Forward outlook
- In year one you build about $1k of equity ($242 loan paydown + $1k appreciation (3.0% local appreciation)).
- At projected returns (3.0% appreciation + 3.0% rent growth), your $10k cash investment doubles in ~3 years — after that, you're playing with house money.
Negotiation context
- It's been on market 52 days — a 3% lower offer ($34k) is reasonable based on typical stale-listing flexibility.
Risks & watch-outs
- Watch-outs: flood insurance adds $427/mo.
- Climate carrying-cost: in FEMA flood zone AE (mandatory federal flood insurance); moderate wildfire risk — expect insurance premiums to compound above CPI over the hold.
Questions for the listing agent
- It's been on market 52 days. Have you received any prior offers? Is the seller open to a 3% concession, seller financing, or rate buy-down credit?
- What's the actual annual flood-insurance premium (NFIP or private), and is the property in a SFHA with mandatory coverage?
- Is there a deadline driving the sale (1031 exchange, divorce, estate, relocation)? That informs how much negotiation room exists.
- Schools are F-rated, which usually means shorter tenancies and higher turnover. Who's the typical renter profile here, and what's been the actual vacancy rate?
- Crime grade is F in this area — have there been break-ins, vandalism, or insurance claims at this property in the last 3 years? What carrier currently insures it and at what premium?
- What's the average days-on-market for RENTAL listings here right now (not sales)? A rising rental-DOM trend means longer vacancies and softer asking-rent achievability than the comps imply.
- What's the recent tenant-quality profile in this submarket — average credit score on applications, eviction rate, late-payment / NSF rate, and stable-employment percentage? A property-management company in the area should have these aggregated.
- How much new for-sale + rental construction is in the pipeline within 1–3 miles? Heavy new supply typically softens prices + rents 12–24 months out; constrained supply supports both.
Investment metrics
- 1% rule
- 3.00% ✓
- Cap rate
- 26.39%
- Cash-on-cash
- 71.79%
- DSCR
- 4.19
- GRM
- 2.8
CMA / ARV
No comps found within radius.
Projected returns pro-forma
3.0% appreciation · 3.0% rent growth · sell at horizon
- IRR
- 26.3%
- Equity multiple
- 2.50×
- Total profit
- $14,668
- Equity at exit
- $15,738
- IRR
- 27.2%
- Equity multiple
- 4.91×
- Total profit
- $38,346
- Equity at exit
- $24,253
Cash invested: $9,800 (down + closing). Projections, not guarantees.
Landlord ↔ Tenant lean methodology
- Overall (STATE)
- 82 Strongly Landlord-Friendly
- State Montana
- 82 Strongly Landlord-Friendly · R+11
- County
- — inherits STATE
- City
- — inherits STATE
ZIP-level market 59059
- Active inventory
- 2
- Price-to-rent
- 2.8×
Monthly cashflow live
- Estimated rent
- $1,048 medium interval (Pro) →
- Mortgage (P&I)
- −$184
- Tax est. 1.5%
- −$44 /mo · $525/yr
- Insurance
- −$15
- Flood insurance flood zone
- −$427 /mo · $5,118/yr
- HOA
- −$0
- Vacancy / Maint / Mgmt
- −$220
- Net cashflow
- $160
Break-even live
UW: 25.0% down · 7.5% · 30yr · 1.5% tax · 5.0% vac · 8.0% maint · 8.0% mgmt
Financing live
Cash to close
- Down payment
- $8,750
- Closing costs
- $1,050
- Reserves months
- —
- Total cash needed
- —
Loan-product check · same deal, 3 products live
Conventional
25% down · 7.5% · 30yr
- Down + closing
- —
- Monthly P&I
- —
- Monthly cashflow
- —
- DSCR
- —
- Eligible?
- —
Personal DTI + credit; lowest rate.
DSCR
20% down · 8.5% · 30yr
- Down + closing
- —
- Monthly P&I
- —
- Monthly cashflow
- —
- DSCR
- —
- Eligible?
- —
No personal income docs; deal must DSCR.
Hard money
10% down · 12.0% · 12mo
- Down + closing
- —
- Monthly P&I
- —
- Monthly cashflow
- —
- DSCR
- —
- Eligible?
- —
Short-term bridge; refi at stabilization.
Listing history 18 events
-
2026-06-18days on market $35,000 Active 52 DOM
-
2026-06-17days on market $35,000 Active 51 DOM
-
2026-06-16days on market $35,000 Active 50 DOM
-
2026-06-15days on market $35,000 Active 49 DOM
-
2026-06-13days on market $35,000 Active 47 DOM
-
2026-06-12days on market $35,000 Active 46 DOM
-
2026-06-09days on market $35,000 Active 43 DOM
-
2026-06-08days on market $35,000 Active 42 DOM
-
2026-06-07days on market $35,000 Active 41 DOM
-
2026-06-05days on market $35,000 Active 39 DOM
-
2026-06-04days on market $35,000 Active 37 DOM
-
2026-06-02days on market $35,000 Active 36 DOM
-
2026-06-01days on market $35,000 Active 35 DOM
-
2026-05-31days on market $35,000 Active 34 DOM
-
2026-04-24$35,000 Active
-
1996-10-17soldstatus
-
1991-02-04soldstatus
-
1990-11-21soldstatus
ⓘ Source: listings_history table (triggers on properties + properties_extension) + one-shot
backfill from property_details.listing_events for pre-trigger history.
Climate risk First Street
- Flood 6/10 Major FEMA zone AE · 54% chance over 30 yrs
- Wildfire 5/10 Major
- Heat 3/10 Moderate 7 d/yr ≥96°F today · 13 d/yr by 30 yrs out
- Wind 1/10 Low
- Air quality 4/10 Moderate 5 unhealthy d/yr today · 7 by 30 yrs out
Nearby sold comps map
Loading sold comps map…
Walkable amenities ~0.75 mi
Loading nearby amenities…
Taxation est. · year 1
- Rental income
- $12,580
- − Mortgage interest
- −$1,961
- − Property taxes
- −$525
- − Insurance
- −$5,294
- − Repairs & maintenance
- −$1,006
- − Management
- −$1,006
- − Depreciation
- −$1,018
- Taxable income
- $1,770
- Est. tax owed @ 24.0%
- −$425
- After-tax cash flow
- $1,492/yr
For passive investors: Depreciation is non-cash, so a rental often shows a tax loss while cash-flowing — sheltering income. Rental losses are passive: they offset passive income freely, and up to $25,000/yr can offset ordinary (W-2) income if you actively participate and your MAGI is under $100k (phasing out to $0 by $150k); unused losses carry forward. On sale, claimed depreciation is recaptured at up to 25%, and gains may owe capital-gains tax (a 1031 exchange can defer both). Figures are a year-1 estimate at your 24.0% rate — not tax advice; consult a CPA.
Schools (NCES district)
- District
- Roundup High School
- NCES district ID
- 3023070
- Math proficiency
- 20% ▲ 9.00%
- Reading proficiency
- 11% ▼ -19.00%
- Median HH income
- $39,152
- Composite
- 16.59/100
- National rank
- #14240
- State rank
- #270 of 339 in MT
Livability — Musselshell
- Score
- 64/100
- State rank
- #152
- US rank
- #14762
Category grades
Schools grade is shown separately in the Schools card above.
Census & demographics
- Census place
- Musselshell, MT
- City population
- 201
- Population (ZIP)
- 201
Population outlook (Musselshell County) Hauer SSP2
- Today (2025)
- 4,560 people
- By 2030
- 4,503 · -1.2%
- By 2040
- 4,407 · -3.4%
- By 2050
- 4,449 · -2.4%
- By 2075
- 4,960 · +8.8%
- By 2100
- 5,493 · +20.5%
Race, ethnicity, and origin ACS 2023
- Neighborhood character
- Predominantly White (96%)
- Race & ethnicity
- White 96% Two or more races 4%
- Common ancestry
- Portuguese 5% Iranian 4% Serbian 4%
Political lean MEDSL · Musselshell
- 2024 margin
- Solid R (+71.5) · D 13.2% · R 84.7% · Other 2.2%
- 2008→2024 swing
- -30.5pp toward R · 2008: -41.0pp · 2024: -71.5pp
- All cycles
- 2024: R+71.5 2020: R+69.8 2016: R+67.8 2012: R+55.7 2008: R+41.0
Not yet ingested
- Civics
- —
Market trends
- HPI YoY
- —
- Current HPI
- —
- Rent YoY
- —
- Metro
- —
- State GDP YoY
- ▲ 3.41%
- F500 in state
- 2
Industry mix (Fortune 500 HQ in MT)
| Industry | F500 HQs | Revenue |
|---|---|---|
| Technology / Analytics | 1 | $2B |
|
||
Price history
4 events — show timeline
- 2026-04-24 Listed $35,000 BMTMLS
- 1996-10-17 Sold (Public Records) — Public Records
- 1991-02-04 Sold (Public Records) — Public Records
- 1990-11-21 Sold (Public Records) — Public Records
Property tax history
-2.9%/yrLatest (2025): $69 · -39.3% YoY. Source: county tax records.
Cash-flow waterfall
monthlySold comps — $/sqft
last 12 mo · ≤1 miLoading sold comps…