 🏷️ Likely Rental
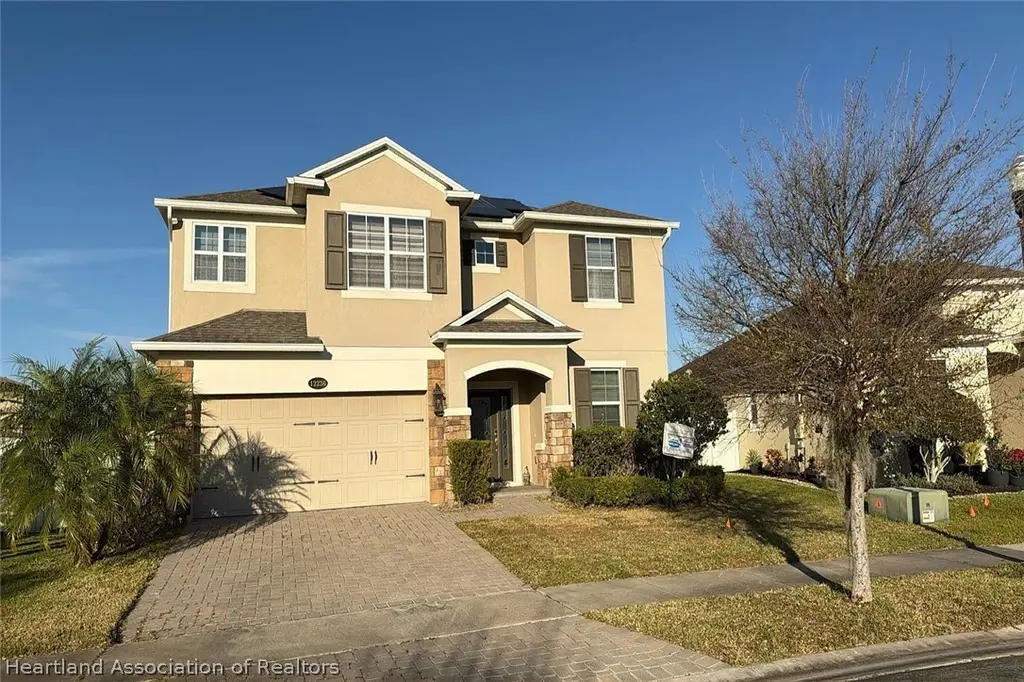
12236 Northover Loop · Meadow Woods, FL
Flood risk 1/10 · Minimal
- FEMA flood zone
- X (unshaded)
- Chance of flooding over 30 yrs
- 0.0%
- Est. flood insurance / yr
- $507 – $1,088
Fire risk 4/10 · Minor
- Est. fire insurance / yr
- $947 – $1,759
Heat risk 9/10 · Severe
- Hot days now (above 108°F)
- 7 days/yr
- Hot days in 30 yrs
- 24 days/yr
Wind risk 9/10 · Severe
- Chance of severe wind over 30 yrs
- 99.0%
Air-quality risk 2/10 · Minimal
- Unhealthy air days now
- 0 days/yr
- Unhealthy air days in 30 yrs
- 1 days/yr
Risk factors via First Street. Map © Google.
Why this score? — see what drove the D grade
The composite is a weighted blend of 9 inputs, each scored 0–100. Each bar is that input's sub-score; the figure is the points it added to the 100-point composite (weight × sub-score).
- Cash flow +15.0/30.0
- ARV discount +7.5/15.0
- 1% rule +5.0/10.0
- DSCR +5.0/10.0
- Schools +4.1/10.0
- Livability +3.2/5.0
- Condition / age +2.5/5.0
- Rent growth +2.4/5.0
- Appreciation +0.0/10.0
$5,000
🖨 Deal sheet 📄 Offer letter ✓ Due diligence
Listing remarks MLS
One or more photo(s) has been virtually staged. Located in the Somerset Park Subdivision in Lake Nona, FL. , this beautiful 4 Bedroom, 3 Bath, 2 Stroy home catches your attention immediately with its curb appeal. The entire First floor is floored with "Wood Look" plank Ceramic Tile. The Guest Suite and seperate Full Bath are also downstairs for conveience for visiting company and privacy for you. The kitchen is appointed with large cabinets and large chefs island. Upstairs is the Master Bedroom with, tray ceilings, connected, private Maser Bath (where the large walk-in closet is located) and a double door entry. The Second floor has 2 more Bedrooms, 1 more Full Bath and a loft/bonus room area. The Vinyl Fenced Backyard is accessed by a fully screened in Porch through the Dining Room Sliding Glass Door. This gated community many amenities just waiting to be discovered. Just minutes from SR417, Orlando International airport and Lake Nona Medical City.
Key facts
- 8,276 sq ft lot
- 2 garage spots
- Built 2017
Property features AI
Exterior
- Parking: 2-car garage
- Utilities: Other water source; Other sewer
- Home design: Single-family residence; One level; Residential property
- Construction: Construction details: See remarks
- Exterior features: Front porch; Other roof
Interior
- Flooring: Other flooring
- Bathrooms: 3 full bathrooms; 1 half bathroom
- Heating & cooling: No heating; No cooling
- Interior features: Other flooring
Neighborhood map
What this means for you Summary
Snapshot
- This is a 4-bed/4.0-bath single-family listed at $5k.
Deal economics
- At list price, monthly cash flow is $2k ($27k/yr) — positive.
- The deal already cash-flows at list — no discount required.
- Meets the 1% rule at list price ($3k rent vs $5k).
- Cap rate 540.7% vs local median 3.7% in Meadow Woods — top-decile yield for the area; either an underpriced asset or a hidden risk that comps aren't pricing in. Stress-test before assuming the spread holds.
Location & tenants
- Location reads 65/100 on livability (#652 in FL) — a middle-class / working-renter tenant base. Strengths: housing A+, crime B; Watch: schools D-, amenities F, commute F.
- Orange (suburban): math 46% / reading 51% proficiency, ranked #43 of 73 in FL (top 59%) — families likely to look elsewhere, expect single-tenant / working-renter base with shorter leases.
- Market conditions: Rents soft (-0.2%/yr); 331 active listings in the ZIP; 20 comparable units currently listed for rent nearby; rentals at typical pace (median 22d on market — plan ~3-4 weeks tenant-placement turnaround); solid renter incomes; 8,053 units permitted in Orange County in 2024 (3,133 in 5+ unit buildings).
- This rent runs 40% of the median local income ($85k/yr) — at the standard rent-burdened threshold; future hikes will face affordability resistance.
Forward outlook
- Local home prices are declining (-3.0%/yr); year-one equity from $35 of loan paydown is wiped out by about $150 of value loss. Plan a longer hold.
- Orange County population projected at +52% by 2050 — long-run rental-demand tailwind backs the buy-and-hold thesis.
- At projected returns (-3.0% appreciation + 0.0% rent growth), your $1k cash investment doubles in ~1 year — after that, you're playing with house money.
Negotiation context
- Only 7 days on market — expect competitive offers; lowballing is unlikely to land.
- 7 sale attempts since 9y ago with the ask held roughly flat each time — persistent listings suggest the price (not the market) is what's stuck; bring a comps-based counter.
Risks & watch-outs
- Climate carrying-cost: severe wind risk, 99% chance of damaging wind over 30y; extreme-heat days projected 7→24/yr by 2055 (HVAC capex compounding) — expect insurance premiums to compound above CPI over the hold.
Questions for the listing agent
- Is there a deadline driving the sale (1031 exchange, divorce, estate, relocation)? That informs how much negotiation room exists.
- Schools are D-rated, which usually means shorter tenancies and higher turnover. Who's the typical renter profile here, and what's been the actual vacancy rate?
- The area grade is low — what's the realistic commute time and amenity access for the typical tenant pool here? Any planned neighborhood developments (good or bad) we should know about?
- What's the average days-on-market for RENTAL listings here right now (not sales)? A rising rental-DOM trend means longer vacancies and softer asking-rent achievability than the comps imply.
- What's the recent tenant-quality profile in this submarket — average credit score on applications, eviction rate, late-payment / NSF rate, and stable-employment percentage? A property-management company in the area should have these aggregated.
- How much new for-sale + rental construction is in the pipeline within 1–3 miles? Heavy new supply typically softens prices + rents 12–24 months out; constrained supply supports both.
Investment metrics
- 1% rule
- 57.25% ✓
- Cap rate
- 540.69%
- Cash-on-cash
- 1908.58%
- DSCR
- 85.92
- GRM
- 0.1
CMA / ARV
- ARV (on-the-fly)
- $526,824
- Comps found
- 1
Show comp detail 1 sale within ~0.75 mi
| Address | Dist | Beds/Ba | Sqft | Sold | Price | $/sf | Match |
|---|---|---|---|---|---|---|---|
| 2413 Courtown Ct | 0.66mi | 4/3.0 | 2,155 (-12%) | 4mo | $465,000 | $216 | 43 |
Match score weights: distance 35% · size 25% · config 20% · recency 20%. Top-matched comps best support the ARV.
Projected returns pro-forma
-3.0% appreciation · 0.0% rent growth · sell at horizon
- IRR
- —
- Equity multiple
- 95.76×
- Total profit
- $132,663
- Equity at exit
- $746
- IRR
- —
- Equity multiple
- 190.92×
- Total profit
- $265,891
- Equity at exit
- $432
Cash invested: $1,400 (down + closing). Projections, not guarantees.
Landlord ↔ Tenant lean methodology
- Overall (STATE)
- 87 Strongly Landlord-Friendly
- State Florida
- 87 Strongly Landlord-Friendly · R+3
- County
- — inherits STATE
- City
- — inherits STATE
ZIP-level market 32824
- Rents YoY
- -0.2%
- Active inventory
- 331
- Price-to-rent
- 0.1×
Monthly cashflow live
- Estimated rent
- $2,862 high interval (Pro) →
- Mortgage (P&I)
- −$26
- Tax est. 1.5%
- −$6 /mo · $75/yr
- Insurance
- −$2
- HOA
- −$0
- Vacancy / Maint / Mgmt
- −$601
- Net cashflow
- $2,227
Break-even live
UW: 25.0% down · 7.5% · 30yr · 1.5% tax · 5.0% vac · 8.0% maint · 8.0% mgmt
Financing live
Cash to close
- Down payment
- $1,250
- Closing costs
- $150
- Reserves months
- —
- Total cash needed
- —
Loan-product check · same deal, 3 products live
Conventional
25% down · 7.5% · 30yr
- Down + closing
- —
- Monthly P&I
- —
- Monthly cashflow
- —
- DSCR
- —
- Eligible?
- —
Personal DTI + credit; lowest rate.
DSCR
20% down · 8.5% · 30yr
- Down + closing
- —
- Monthly P&I
- —
- Monthly cashflow
- —
- DSCR
- —
- Eligible?
- —
No personal income docs; deal must DSCR.
Hard money
10% down · 12.0% · 12mo
- Down + closing
- —
- Monthly P&I
- —
- Monthly cashflow
- —
- DSCR
- —
- Eligible?
- —
Short-term bridge; refi at stabilization.
Rent comps 20 comps
| Address | Beds | Baths | Sqft | Rent | $/sqft | DOM | Units | Dist |
|---|---|---|---|---|---|---|---|---|
| 15154 Braywood Trl Orlando, FL | 5.0 | 3.0 | 2814 | $3,000 | $1.07 | 23d | 1 | 0.30mi |
| 1540 Whitewater Falls Dr Orlando, FL | 4.0 | 2.5 | 2165 | $2,500 | $1.15 | 23d | 1 | 0.43mi |
| 1746 Mandavilla Dr Orlando, FL | 3.0 | 2.5 | 1609 | $2,300 | $1.43 | 14d | 1 | 0.45mi |
| 3154 Rodrick Cir Orlando, FL | 3.0 | 2.5 | 1643 | $2,260 | $1.38 | 23d | 1 | 0.60mi |
| 2841 Adelaide Ct Orlando, FL | 3.0 | 2.5 | 1642 | $2,400 | $1.46 | 21d | 1 | 0.62mi |
| 13115 Canna Lily Dr Orlando, FL | 4.0 | 2.5 | 2052 | $1,250 | $0.61 | 21d | 1 | 0.66mi |
| 2226 Brandywine Falls Way Orlando, FL | 3.0 | 2.0 | 1640 | $2,050 | $1.25 | 21d | 1 | 0.67mi |
| 1735 White Heron Bay Cir Orlando, FL | 5.0 | 3.5 | 2532 | $3,500 | $1.38 | 23d | 1 | 0.78mi |
| 2217 Crosston Cir Orlando, FL | 4.0 | 3.0 | 2283 | $3,000 | $1.31 | 23d | 1 | 0.78mi |
| 2347 Crosston Cir Orlando, FL | 4.0 | 3.0 | 2114 | $3,200 | $1.51 | 20d | 1 | 0.90mi |
| 1743 Capesterre Dr Orlando, FL | 4.0 | 2.0 | 1979 | $2,900 | $1.47 | 4d | 1 | 0.90mi |
| 13881 Rushing Creek Run Orlando, FL | 4.0 | 3.0 | 2313 | $3,000 | $1.30 | 23d | 1 | 0.98mi |
| 1835 Island Walk Dr Orlando, FL | 3.0 | 3.0 | 1964 | $2,100 | $1.07 | 23d | 1 | 1.04mi |
| 1604 Bridgeview Cir Orlando, FL | 5.0 | 4.0 | 3200 | $3,390 | $1.06 | 21d | 1 | 1.30mi |
| 2608 Spring Hill Dr Kissimmee, FL | 4.0 | 2.5 | 1839 | $2,600 | $1.41 | 4d | 1 | 1.31mi |
| 2420 Plantation Oak Dr Orlando, FL | 5.0 | 4.0 | 3170 | $3,381 | $1.07 | 7d | 1 | 1.36mi |
| 2502 Quail Park Ter Kissimmee, FL | 4.0 | 2.5 | 2160 | $2,495 | $1.16 | 23d | 1 | 1.40mi |
| 1899 Portofino Meadows Blvd Orlando, FL | 3.0 | 2.5 | 1687 | $2,200 | $1.30 | 21d | 1 | 1.42mi |
| 3474 Chroma St Orlando, FL | 3.0 | 2.5 | 1673 | $2,550 | $1.52 | 14d | 1 | 1.43mi |
| 4000 Nona West Blvd Orlando, FL | 1.0–3.0 | 1.0–2.0 | 1178 | $2,875 | $2.44 | 1d | 52 | 1.48mi |
Listing history 6 events
-
2026-06-09days on market $5,000 Active 7 DOM
-
2026-06-08days on market $5,000 Active 6 DOM
-
2026-06-07days on market $5,000 Active 5 DOM
-
2026-06-04days on market $5,000 Active 2 DOM
-
2026-06-02remarks 297-char remark
-
2026-06-02$5,000 Active 1 DOM
ⓘ Source: listings_history table (triggers on properties + properties_extension) + one-shot
backfill from property_details.listing_events for pre-trigger history.
Climate risk First Street
- Flood 1/10 Low FEMA zone X (unshaded) · 0% chance over 30 yrs
- Wildfire 4/10 Moderate
- Heat 9/10 Extreme 7 d/yr ≥108°F today · 24 d/yr by 30 yrs out
- Wind 9/10 Extreme 99% chance of damaging wind over 30 yrs
- Air quality 2/10 Low 0 unhealthy d/yr today · 1 by 30 yrs out
Nearby sold comps map
Loading sold comps map…
Walkable amenities ~0.75 mi
Loading nearby amenities…
Taxation est. · year 1
- Rental income
- $34,348
- − Mortgage interest
- −$280
- − Property taxes
- −$75
- − Insurance
- −$25
- − Repairs & maintenance
- −$2,748
- − Management
- −$2,748
- − Depreciation
- −$145
- Taxable income
- $28,327
- Est. tax owed @ 24.0%
- −$6,798
- After-tax cash flow
- $19,922/yr
For passive investors: Depreciation is non-cash, so a rental often shows a tax loss while cash-flowing — sheltering income. Rental losses are passive: they offset passive income freely, and up to $25,000/yr can offset ordinary (W-2) income if you actively participate and your MAGI is under $100k (phasing out to $0 by $150k); unused losses carry forward. On sale, claimed depreciation is recaptured at up to 25%, and gains may owe capital-gains tax (a 1031 exchange can defer both). Figures are a year-1 estimate at your 24.0% rate — not tax advice; consult a CPA.
Schools (NCES district)
- District
- Orange
- NCES district ID
- 1201440
- Math proficiency
- 46% ▼ -9.00%
- Reading proficiency
- 51% ▼ -2.00%
- Median HH income
- $49,350
- Composite
- 41.47/100
- National rank
- #3461
- State rank
- #43 of 73 in FL
Livability — Meadow Woods
- Score
- 65/100
- State rank
- #652
- US rank
- #12935
Category grades
Schools grade is shown separately in the Schools card above.
Census & demographics
- Census place
- Meadow Woods, FL
- County
- Orange County · 1,471,359 people
- City population
- 55,282
- Metro
- Orlando-Kissimmee-Sanford, FL
- Population (ZIP)
- 58,368
- Household income
- $84,841
- Rent vs Own
- Severe rent burden
- 1015.0
Population outlook (Orange County) Hauer SSP2
- Today (2025)
- 1,618,226 people
- By 2030
- 1,787,404 · +10.5%
- By 2040
- 2,125,621 · +31.4%
- By 2050
- 2,454,016 · +51.6%
- By 2075
- 3,173,711 · +96.1%
- By 2100
- 3,607,781 · +122.9%
Race, ethnicity, and origin ACS 2023
- Neighborhood character
- Diverse neighborhood (Simpson 0.57)
- Race & ethnicity
- Hispanic / Latino 62% Two or more races 34% White 15% Black 13% Asian 6%
- Hispanic origin (detail)
- Mexican 2% Puerto Rican 26% Cuban 2% Dominican 6%
- Common ancestry
- Romanian 1% Hispanic 1% Russian 1%
- Foreign-born
- 32% · Canada, Jamaica, Vietnam
- Languages at home
- 36% English-only · Spanish 54% Other Indo-European 3% French/Haitian/Cajun 2%
Political lean MEDSL · Orange
- 2024 margin
- D (+13.6) · D 56.1% · R 42.5% · Other 1.3%
- 2008→2024 swing
- -5.0pp toward R · 2008: 18.6pp · 2024: 13.6pp
- All cycles
- 2024: D+13.6 2020: D+23.1 2016: D+24.6 2012: D+18.2 2008: D+18.6
Not yet ingested
- Civics
- —
Market trends
- HPI YoY
- ▼ -165.20%
- Current HPI
- 280.977
- Rent YoY
- ▼ -0.21%
- Metro
- Orlando-Kissimmee-Sanford, FL
- State GDP YoY
- ▲ 3.28%
- F500 in state
- 36
Industry mix (Fortune 500 HQ in FL)
| Industry | F500 HQs | Revenue |
|---|---|---|
| Industrial Technology | 2 | $29B |
|
||
| Insurance | 2 | $17B |
|
||
| Retail | 1 | $60B |
|
||
| Technology Distribution | 1 | $58B |
|
||
| Homebuilding | 1 | $35B |
|
||
| Technology Manufacturing | 1 | $35B |
|
||
Price history
-98.5% since first listed22 events — show timeline
- 2026-06-02 Listed $5,000 HAOR as distributed by MLS GRID
- 2022-07-08 Sold (Public Records) $565,000 Public Records
- 2022-07-05 Sold (MLS) $565,000 Stellar MLS as Distributed by MLS Grid
- 2022-05-13 Pending — Stellar MLS as Distributed by MLS Grid
- 2022-05-12 Price Changed $582,000 Stellar MLS as Distributed by MLS Grid
- 2022-05-09 Relisted — Stellar MLS as Distributed by MLS Grid
- 2022-05-04 Pending — Stellar MLS as Distributed by MLS Grid
- 2022-05-02 Listed $590,000 Stellar MLS as Distributed by MLS Grid
- 2022-04-21 Sold (Public Records) $508,600 Public Records
- 2021-08-16 Pending — Stellar MLS as Distributed by MLS Grid
- 2021-08-16 Listing Removed — Stellar MLS as Distributed by MLS Grid
- 2021-07-30 Listed $482,000 Stellar MLS as Distributed by MLS Grid
- 2019-11-14 Listing Removed — Stellar MLS as Distributed by MLS Grid
- 2019-10-05 Price Changed $379,000 Stellar MLS as Distributed by MLS Grid
- 2019-08-22 Price Changed $380,000 Stellar MLS as Distributed by MLS Grid
- 2019-07-20 Relisted — Stellar MLS as Distributed by MLS Grid
- 2019-07-17 Pending — Stellar MLS as Distributed by MLS Grid
- 2019-07-11 Price Changed $389,000 Stellar MLS as Distributed by MLS Grid
- 2019-03-07 Listed $399,888 Stellar MLS as Distributed by MLS Grid
- 2017-12-29 Sold (MLS) $340,990 Stellar MLS as Distributed by MLS Grid
- 2017-10-17 Pending — Stellar MLS as Distributed by MLS Grid
- 2017-09-28 Listed $340,990 Stellar MLS as Distributed by MLS Grid
Property tax history
+54.8%/yrLatest (2025): $8,218 · +4.1% YoY. Source: county tax records.
Cash-flow waterfall
monthlySold comps — $/sqft
last 12 mo · ≤1 miLoading sold comps…