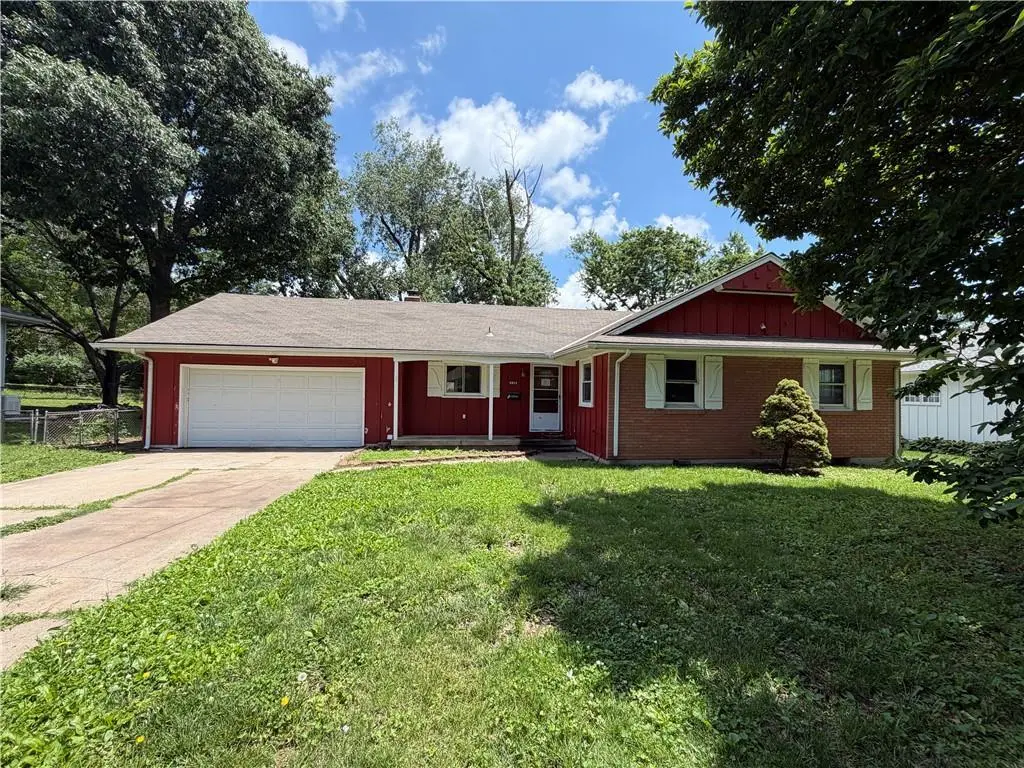
5913 Hunter St · Raytown, MO
Flood risk 1/10 · Minimal
- FEMA flood zone
- X (unshaded)
- Chance of flooding over 30 yrs
- 0.0%
- Est. flood insurance / yr
- $473 – $860
Fire risk 1/10 · Minimal
- Est. fire insurance / yr
- $1,054 – $1,958
Heat risk 4/10 · Minor
- Hot days now (above 107°F)
- 7 days/yr
- Hot days in 30 yrs
- 17 days/yr
Wind risk 2/10 · Minimal
- Chance of severe wind over 30 yrs
- —
Air-quality risk 3/10 · Minor
- Unhealthy air days now
- 3 days/yr
- Unhealthy air days in 30 yrs
- 5 days/yr
Risk factors via First Street. Map © Google.
Why this score? — see what drove the C+ grade
The composite is a weighted blend of 9 inputs, each scored 0–100. Each bar is that input's sub-score; the figure is the points it added to the 100-point composite (weight × sub-score).
- Cash flow +24.0/30.0
- ARV discount +15.0/15.0
- DSCR +7.7/10.0
- 1% rule +7.1/10.0
- Livability +3.2/5.0
- Rent growth +2.8/5.0
- Condition / age +2.5/5.0
- Schools +1.8/10.0
- Appreciation +0.0/10.0
$140,000
🖨 Deal sheet 📄 Offer letter ✓ Due diligence
Listing remarks MLS
Terrific Ranch on quiet street. Nicely updated with new kitchen countertops and tile backsplash. Dark hardwoods throughout, new master bath, thermal windows, big eat-in kitchen/hearth with gas fp, bonus sunroom/family room, big backyard with access to city park. Finished LL.
Key facts
- Ranch style home
- Highway access
- Shopping
Tags
Property features AI
Finance
- Other: Lot approximately 13,068 sq ft; Age range: 51–75 years
- HOA & community: No association fees
Exterior
- Parking: Attached garage that faces the front; 2-car garage
- Utilities: Public water; Public sewer
- Home design: Single-family residence; Ranch floor plan; Residential property
- Construction: Frame construction; Composition roof
- Exterior features: Patio
Interior
- Kitchen: Eat-in kitchen layout
- Bedrooms: 3 bedrooms
- Flooring: Wood floors
- Bathrooms: 2 full bathrooms
- Heating & cooling: Forced air heating; Electric cooling (central)
- Interior features: Eat-in kitchen; Daylight basement; Wood flooring; Fireplace (1)
Neighborhood map
What this means for you Summary
Snapshot
- This is a 3-bed/1.5-bath single-family listed at $140k.
Deal economics
- At list price, monthly cash flow is $274 ($3k/yr) — positive.
- The deal already cash-flows at list — no discount required.
- Meets the 1% rule at list price ($2k rent vs $140k).
- Cap rate 8.6% vs local median 5.0% in Raytown — top-decile yield for the area; either an underpriced asset or a hidden risk that comps aren't pricing in. Stress-test before assuming the spread holds.
Location & tenants
- Location reads 65/100 on livability (#281 in MO) — a middle-class / working-renter tenant base. Strengths: cost of living A+, housing A+, health & safety B+; Watch: schools D-, crime F, amenities F.
- Raytown C-2 (suburban): math 12% / reading 28% proficiency, ranked #302 of 324 in MO (top 93%) — low school quality limits family demand, transient renter base, plan for 1-2y turnover.
- Market conditions: Rents rising (+1.3%/yr); 203 active listings in the ZIP; 11 comparable units currently listed for rent nearby; rentals at typical pace (median 21d on market — plan ~3-4 weeks tenant-placement turnaround); 4,002 units permitted in Jackson County in 2024 (2,271 in 5+ unit buildings).
- This rent runs 30% of the median local income ($68k/yr) — at the standard rent-burdened threshold; future hikes will face affordability resistance.
Forward outlook
- Local home prices are declining (-3.0%/yr); year-one equity from $968 of loan paydown is wiped out by about $4k of value loss. Plan a longer hold.
- Jackson County population projected at +4% by 2050 — modest demand growth; plan on rents tracking national, not racing it.
Negotiation context
- Only 7 days on market — expect competitive offers; lowballing is unlikely to land.
- 3 sale attempts since 23y ago with the ask held roughly flat each time — persistent listings suggest the price (not the market) is what's stuck; bring a comps-based counter.
Questions for the listing agent
- Built in 1963 — when were the roof, HVAC, electrical panel, plumbing, and water heater last replaced?
- Is there a deadline driving the sale (1031 exchange, divorce, estate, relocation)? That informs how much negotiation room exists.
- Schools are D-rated, which usually means shorter tenancies and higher turnover. Who's the typical renter profile here, and what's been the actual vacancy rate?
- Crime grade is F in this area — have there been break-ins, vandalism, or insurance claims at this property in the last 3 years? What carrier currently insures it and at what premium?
- What's the average days-on-market for RENTAL listings here right now (not sales)? A rising rental-DOM trend means longer vacancies and softer asking-rent achievability than the comps imply.
- What's the recent tenant-quality profile in this submarket — average credit score on applications, eviction rate, late-payment / NSF rate, and stable-employment percentage? A property-management company in the area should have these aggregated.
- How much new for-sale + rental construction is in the pipeline within 1–3 miles? Heavy new supply typically softens prices + rents 12–24 months out; constrained supply supports both.
Investment metrics
- 1% rule
- 1.21% ✓
- Cap rate
- 8.64%
- Cash-on-cash
- 8.39%
- DSCR
- 1.37
- GRM
- 6.9
CMA / ARV
- ARV (on-the-fly)
- $227,920
- Comps found
- 12
Show comp detail 12 sales within ~0.75 mi
| Address | Dist | Beds/Ba | Sqft | Sold | Price | $/sf | Match |
|---|---|---|---|---|---|---|---|
| 9052 E 59th St | 0.13mi | 3/2.0 | 1,370 (-11%) | 2mo | $240,000 | $175 | 72 |
| 5725 Hunter St | 0.22mi | 3/3.0 | 1,394 (-10%) | 3mo | $280,000 | $201 | 66 |
| 8721 E 57th Ter | 0.41mi | 3/2.5 | 1,580 (+3%) | 12mo | $297,500 | $188 | 62 |
| 6400 Kentucky Ave | 0.56mi | 3/2.0 | 1,632 (+6%) | 4mo | $215,000 | $132 | 59 |
| 6012 Crescent Ave | 0.41mi | 3/2.0 | 1,668 (+8%) | 8mo | $239,000 | $143 | 58 |
| 5700 Farley Ave | 0.36mi | 3/2.0 | 1,726 (+12%) | 12mo | $249,500 | $145 | 51 |
| 5604 Manning Ave | 0.39mi | 3/2.0 | 1,732 (+12%) | 16mo | $256,000 | $148 | 46 |
| 6012 Arlington St | 0.49mi | 4/3.0 (+1) | 1,650 (+7%) | 10mo | $255,000 | $155 | 46 |
| 9817 E 60th Ter | 0.69mi | 2/1.5 (-1) | 1,341 (-13%) | 2mo | $183,999 | $137 | 40 |
| 9101 E 65th St | 0.70mi | 2/2.0 (-1) | 1,732 (+12%) | 2mo | $210,000 | $121 | 38 |
| 8529 E 59th St | 0.52mi | 4/2.0 (+1) | 1,364 (-11%) | 14mo | $229,999 | $169 | 38 |
| 8500 E 57th St | 0.64mi | 4/2.5 (+1) | 1,750 (+14%) | 5mo | $140,000 | $80 | 34 |
Match score weights: distance 35% · size 25% · config 20% · recency 20%. Top-matched comps best support the ARV.
Projected returns pro-forma
-3.0% appreciation · 1.34% rent growth · sell at horizon
- IRR
- -5.5%
- Equity multiple
- 0.80×
- Total profit
- $-7,935
- Equity at exit
- $20,874
- IRR
- 1.9%
- Equity multiple
- 1.12×
- Total profit
- $4,857
- Equity at exit
- $12,105
Cash invested: $39,200 (down + closing). Projections, not guarantees.
Landlord ↔ Tenant lean methodology
- Overall (STATE)
- 81 Strongly Landlord-Friendly
- State Missouri
- 81 Strongly Landlord-Friendly · R+10
- County
- — inherits STATE
- City
- — inherits STATE
ZIP-level market 64133
- Rents YoY
- 1.3%
- Active inventory
- 203
- Price-to-rent
- 6.9×
Monthly cashflow live
- Estimated rent
- $1,694 high interval (Pro) →
- Mortgage (P&I)
- −$734
- Tax from tax record
- −$272 /mo · $3,263/yr
- Insurance
- −$58
- HOA
- −$0
- Vacancy / Maint / Mgmt
- −$356
- Net cashflow
- $274
Break-even live
UW: 25.0% down · 7.5% · 30yr · 1.5% tax · 5.0% vac · 8.0% maint · 8.0% mgmt
Financing live
Cash to close
- Down payment
- $35,000
- Closing costs
- $4,200
- Reserves months
- —
- Total cash needed
- —
Loan-product check · same deal, 3 products live
Conventional
25% down · 7.5% · 30yr
- Down + closing
- —
- Monthly P&I
- —
- Monthly cashflow
- —
- DSCR
- —
- Eligible?
- —
Personal DTI + credit; lowest rate.
DSCR
20% down · 8.5% · 30yr
- Down + closing
- —
- Monthly P&I
- —
- Monthly cashflow
- —
- DSCR
- —
- Eligible?
- —
No personal income docs; deal must DSCR.
Hard money
10% down · 12.0% · 12mo
- Down + closing
- —
- Monthly P&I
- —
- Monthly cashflow
- —
- DSCR
- —
- Eligible?
- —
Short-term bridge; refi at stabilization.
Rent comps 11 comps
| Address | Beds | Baths | Sqft | Rent | $/sqft | DOM | Units | Dist |
|---|---|---|---|---|---|---|---|---|
| 6017 Farley Ave Raytown, MO | 2.0 | 2.5 | 1152 | $1,495 | $1.30 | 43d | 1 | 0.19mi |
| 8818 E 58 Ter Raytown, MO | 3.0 | 1.5 | 1700 | $1,897 | $1.12 | 12d | 1 | 0.26mi |
| 6500 Marsh Ave Unit 6512 Kansas City, MO | 3.0 | 2.5 | 1463 | $1,945 | $1.33 | 23d | 1 | 0.97mi |
| 6512 Marsh Ave Kansas City, MO | 3.0 | 2.5 | 1463 | $1,978 | $1.35 | 1d | 1 | 0.98mi |
| 8648 E 52nd Ter Kansas City, MO | 3.0 | 1.5 | 1224 | $1,395 | $1.14 | 23d | 1 | 0.99mi |
| 9005 E 68th Ter Raytown, MO | 4.0 | 2.0 | 1566 | $1,936 | $1.24 | 3d | 1 | 1.08mi |
| 9408 E 68th St Raytown, MO | 2.0 | 1.0 | 1112 | $1,295 | $1.16 | 16d | 1 | 1.10mi |
| 5517 Willow Ave Raytown, MO | 3.0 | 2.0 | 1415 | $1,850 | $1.31 | 1d | 1 | 1.19mi |
| 5035 Overton Ave Kansas City, MO | 3.0 | 2.0 | 1323 | $1,795 | $1.36 | 43d | 1 | 1.27mi |
| 8800 E 71st Ter Raytown, MO | 3.0 | 2.0 | 1497 | $1,650 | $1.10 | 23d | 1 | 1.45mi |
| 4837 Overton Ave Kansas City, MO | 3.0 | 1.5 | 1344 | $1,611 | $1.20 | 21d | 1 | 1.50mi |
Listing history 5 events
-
2026-06-08statusdays on market $140,000 Pending 7 DOM
-
2026-06-07days on market $140,000 Active 6 DOM
-
2026-06-03days on market $140,000 Active 2 DOM
-
2026-06-02remarks 182-char remark
-
2026-06-02$140,000 Active 1 DOM
ⓘ Source: listings_history table (triggers on properties + properties_extension) + one-shot
backfill from property_details.listing_events for pre-trigger history.
Tax reassessment forecast MO · Resets to sale price
- Current annual tax
- $3,263 · $272/mo
- Projected year-2 tax
- $3,263 · $272/mo
- Expected delta
- $0/yr ($0/mo · 0.0%)
ⓘ Screening estimate from a state-policy table — verify with the county assessor before closing.
Climate risk First Street
- Flood 1/10 Low FEMA zone X (unshaded) · 0% chance over 30 yrs
- Wildfire 1/10 Low
- Heat 4/10 Moderate 7 d/yr ≥107°F today · 17 d/yr by 30 yrs out
- Wind 2/10 Low
- Air quality 3/10 Moderate 3 unhealthy d/yr today · 5 by 30 yrs out
Nearby sold comps map
Loading sold comps map…
Walkable amenities ~0.75 mi
Loading nearby amenities…
Taxation est. · year 1
- Rental income
- $20,330
- − Mortgage interest
- −$7,842
- − Property taxes
- −$3,263
- − Insurance
- −$700
- − Repairs & maintenance
- −$1,626
- − Management
- −$1,626
- − Depreciation
- −$4,073
- Taxable income
- $1,199
- Est. tax owed @ 24.0%
- −$288
- After-tax cash flow
- $3,000/yr
For passive investors: Depreciation is non-cash, so a rental often shows a tax loss while cash-flowing — sheltering income. Rental losses are passive: they offset passive income freely, and up to $25,000/yr can offset ordinary (W-2) income if you actively participate and your MAGI is under $100k (phasing out to $0 by $150k); unused losses carry forward. On sale, claimed depreciation is recaptured at up to 25%, and gains may owe capital-gains tax (a 1031 exchange can defer both). Figures are a year-1 estimate at your 24.0% rate — not tax advice; consult a CPA.
Schools (NCES district)
- District
- Raytown C-2
- NCES district ID
- 2926070
- Math proficiency
- 12% ▼ -11.00%
- Reading proficiency
- 28% ▼ -9.00%
- Median HH income
- $47,215
- Composite
- 17.59/100
- National rank
- #9039
- State rank
- #302 of 324 in MO
Livability — Raytown
- Score
- 65/100
- State rank
- #281
- US rank
- #13079
Category grades
Schools grade is shown separately in the Schools card above.
Census & demographics
- Census place
- Raytown, MO
- County
- Jackson County · 687,798 people
- City population
- 60,054
- Metro
- Kansas City, MO-KS
- Population (ZIP)
- 36,249
- Household income
- $67,750
- Rent vs Own
- Severe rent burden
- 1173.0
Population outlook (Jackson County) Hauer SSP2
- Today (2025)
- 719,589 people
- By 2030
- 731,456 · +1.6%
- By 2040
- 746,689 · +3.8%
- By 2050
- 749,289 · +4.1%
- By 2075
- 736,227 · +2.3%
- By 2100
- 668,210 · -7.1%
Race, ethnicity, and origin ACS 2023
- Neighborhood character
- Diverse neighborhood (Simpson 0.64)
- Race & ethnicity
- White 46% Black 37% Hispanic / Latino 12% Two or more races 9%
- Hispanic origin (detail)
- Mexican 10%
- Common ancestry
- Italian 7% Slovak 1% Lithuanian 1%
- Foreign-born
- 5% · Canada
- Languages at home
- 90% English-only · Spanish 7% French/Haitian/Cajun 1%
Political lean MEDSL · Jackson
- 2024 margin
- D (+19.3) · D 58.9% · R 39.5% · Other 1.6%
- 2008→2024 swing
- -6.1pp toward R · 2008: 25.4pp · 2024: 19.3pp
- All cycles
- 2024: D+19.3 2020: D+22.0 2016: D+16.6 2012: D+19.0 2008: D+25.4
Not yet ingested
- Civics
- —
Market trends
- HPI YoY
- ▼ -155.40%
- Current HPI
- 263.6915
- Rent YoY
- ▲ 1.34%
- Metro
- Kansas City, MO-KS
- State GDP YoY
- ▲ 1.84%
- F500 in state
- 20
Industry mix (Fortune 500 HQ in MO)
| Industry | F500 HQs | Revenue |
|---|---|---|
| Healthcare | 1 | $163B |
|
||
| Insurance | 1 | $21B |
|
||
| Industrial Technology | 1 | $17B |
|
||
| Retail | 1 | $16B |
|
||
| Industrial Distribution | 1 | $10B |
|
||
| Utilities | 1 | $9B |
|
||
Price history
+17.7% since first listed9 events — show timeline
- 2026-06-01 Listed $140,000 Heartland MLS as Distributed by MLS Grid
- 2018-05-31 Sold (Public Records) — Public Records
- 2018-05-25 Sold (MLS) — Heartland MLS as Distributed by MLS Grid
- 2018-05-03 Contingent — Heartland MLS as Distributed by MLS Grid
- 2018-04-20 Listed $159,950 Heartland MLS as Distributed by MLS Grid
- 2003-12-04 Sold (Public Records) — Public Records
- 2003-12-02 Sold (MLS) — Heartland MLS as Distributed by MLS Grid
- 2003-09-29 Listed $118,900 Heartland MLS as Distributed by MLS Grid
- 1984-08-01 Sold (Public Records) — Public Records
Property tax history
+4.9%/yrLatest (2025): $3,263 · +6.0% YoY. Source: county tax records.
Cash-flow waterfall
monthlySold comps — $/sqft
last 12 mo · ≤1 miLoading sold comps…