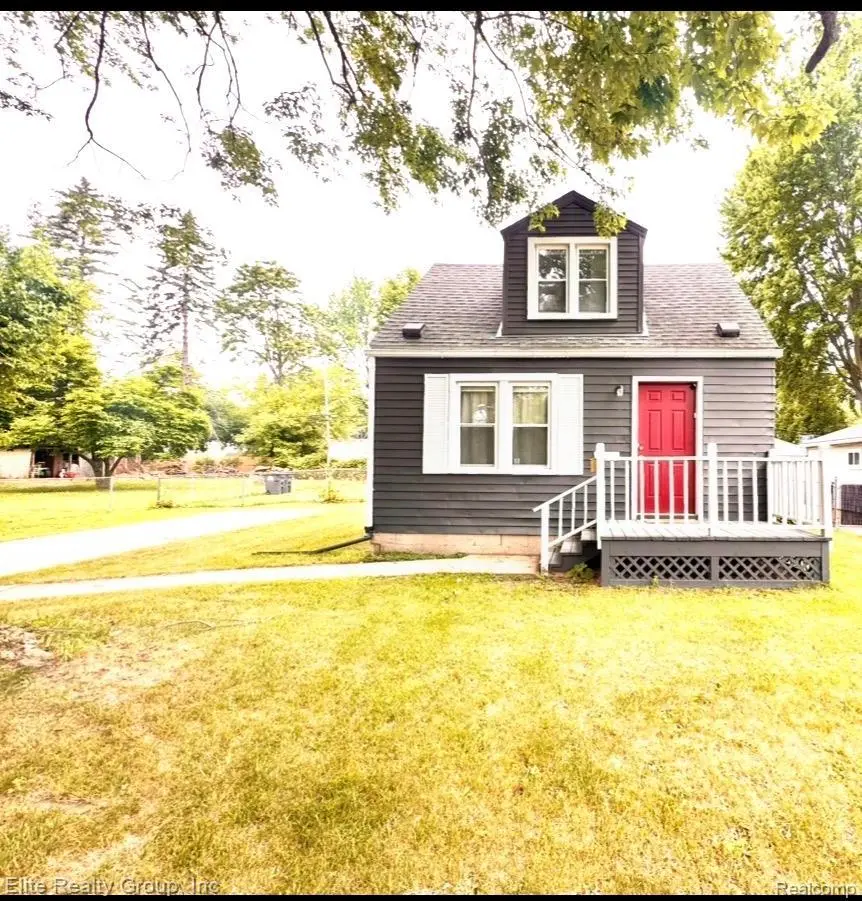
5990 Janet St · Taylor, MI
Flood risk 1/10 · Minimal
- FEMA flood zone
- X (unshaded)
- Chance of flooding over 30 yrs
- 0.0%
- Est. flood insurance / yr
- $507 – $1,088
Fire risk 1/10 · Minimal
- Est. fire insurance / yr
- $784 – $1,456
Heat risk 3/10 · Minor
- Hot days now (above 98°F)
- 7 days/yr
- Hot days in 30 yrs
- 15 days/yr
Wind risk 2/10 · Minimal
- Chance of severe wind over 30 yrs
- —
Air-quality risk 2/10 · Minimal
- Unhealthy air days now
- 1 days/yr
- Unhealthy air days in 30 yrs
- 2 days/yr
Risk factors via First Street. Map © Google.
Why this score? — see what drove the C- grade
The composite is a weighted blend of 9 inputs, each scored 0–100. Each bar is that input's sub-score; the figure is the points it added to the 100-point composite (weight × sub-score).
- Cash flow +25.1/30.0
- DSCR +8.2/10.0
- 1% rule +5.8/10.0
- Livability +3.8/5.0
- Rent growth +3.7/5.0
- Condition / age +2.5/5.0
- Schools +1.8/10.0
- ARV discount +0.0/15.0
- Appreciation +0.0/10.0
$146,500
🖨 Deal sheet (PDF) 📄 Offer letter ✓ Due diligence
Listing remarks MLS
Welcome to this beautifully maintained 3 bedroom home, with first floor primary bedroom. Stainless steel appliances included which compliments the granite counter tops and modern gray cabinetry. Step outside where your dream backyard awaits for your vision. Including a storage shed. Conveniently located near major freeways, parks, shopping, and schools. Newer Windows. C of O will be obtained by the seller prior to closing.
Key facts
- Dream backyard
- Storage shed
- Granite counter tops
Tags
Property features AI
Exterior
- Parking: Driveway (no garage)
- Security: Smoke detector(s); Carbon monoxide detector(s)
- Utilities: Public water; Sewer available
- Home design: Single-family residence; Two levels; Ground-level entry with steps; Aluminum siding
- Construction: Asphalt roof
- Exterior features: Fenced backyard; Shed; Paved road access
Interior
- Kitchen: Free-standing gas range; Microwave; Free-standing refrigerator; Dishwasher
- Bathrooms: 1 full bathroom
- Heating & cooling: Central air conditioning; Forced air heating; Natural gas heating
- Interior features: Ceiling fans; Smoke and carbon monoxide detectors; Crawl space basement; 7 total rooms
- Laundry & utility: Washer; Dryer
Neighborhood map
What this means for you Summary
Snapshot
- This is a 3-bed/1.0-bath single-family listed at $146k.
Deal economics
- At list price, monthly cash flow is $324 ($4k/yr) — positive.
- The deal already cash-flows at list — no discount required.
- Meets the 1% rule at list price ($2k rent vs $146k).
- Cap rate 8.9% vs local median 5.4% in Taylor — top-decile yield for the area; either an underpriced asset or a hidden risk that comps aren't pricing in. Stress-test before assuming the spread holds.
Location & tenants
- Location reads 76/100 on livability (#144 in MI, #3,684 nationally) — a middle-class / working-renter tenant base. Strengths: commute A+, cost of living A+, housing A+; Watch: employment D+, schools F, crime F.
- Taylor School District (urban): math 14% / reading 27% proficiency, ranked #462 of 540 in MI (top 86%) — low school quality limits family demand, transient renter base, plan for 1-2y turnover; 68% free/reduced lunch — lower-income household profile, screen leases tightly.
- Market conditions: Rents rising fast (+4.9%/yr); 289 active listings in the ZIP; 2 comparable units currently listed for rent nearby; 2,639 units permitted in Wayne County in 2024 (1,216 in 5+ unit buildings).
- This rent runs 31% of the median local income ($61k/yr) — at the standard rent-burdened threshold; future hikes will face affordability resistance.
Forward outlook
- Local home prices are declining (-3.0%/yr); year-one equity from $1k of loan paydown is wiped out by about $4k of value loss. Plan a longer hold.
- Wayne County population projected at -17% by 2050 — secular population decline; favor cash flow + early exit over multi-decade hold.
- At projected returns (-3.0% appreciation + 4.9% rent growth), your $41k cash investment doubles in ~10 years — after that, you're playing with house money.
Negotiation context
- Only 14 days on market — expect competitive offers; lowballing is unlikely to land.
- 10 sale attempts since 23y ago with the ask held roughly flat each time — persistent listings suggest the price (not the market) is what's stuck; bring a comps-based counter.
Risks & watch-outs
- Watch-outs: built in 1939 — expect roof / HVAC / electrical / plumbing capex.
Questions for the listing agent
- Built in 1939 — when were the roof, HVAC, electrical panel, plumbing, and water heater last replaced?
- Is there a deadline driving the sale (1031 exchange, divorce, estate, relocation)? That informs how much negotiation room exists.
- Schools are F-rated, which usually means shorter tenancies and higher turnover. Who's the typical renter profile here, and what's been the actual vacancy rate?
- Crime grade is F in this area — have there been break-ins, vandalism, or insurance claims at this property in the last 3 years? What carrier currently insures it and at what premium?
- What's the average days-on-market for RENTAL listings here right now (not sales)? A rising rental-DOM trend means longer vacancies and softer asking-rent achievability than the comps imply.
- What's the recent tenant-quality profile in this submarket — average credit score on applications, eviction rate, late-payment / NSF rate, and stable-employment percentage? A property-management company in the area should have these aggregated.
- How much new for-sale + rental construction is in the pipeline within 1–3 miles? Heavy new supply typically softens prices + rents 12–24 months out; constrained supply supports both.
Investment metrics
- 1% rule
- 1.08% ✓
- Cap rate
- 8.94%
- Cash-on-cash
- 9.47%
- DSCR
- 1.42
- GRM
- 7.7
CMA / ARV
- ARV (on-the-fly)
- $122,820
- Comps found
- 12
Show comp detail 12 sales within ~0.75 mi
| Address | Dist | Beds/Ba | Sqft | Sold | Price | $/sf | Match |
|---|---|---|---|---|---|---|---|
| 6029 Fellrath St | 0.29mi | 2/1.0 (-1) | 696 (+1%) | 12mo | $130,000 | $187 | 70 |
| 6160 Mcguire St | 0.23mi | 2/1.0 (-1) | 660 (-4%) | 12mo | $89,000 | $135 | 67 |
| 5961 Mcguire St | 0.16mi | 3/1.0 | 780 (+13%) | 9mo | $139,900 | $179 | 63 |
| 6325 Harold St | 0.40mi | 2/1.0 (-1) | 709 (+3%) | 13mo | $126,000 | $178 | 61 |
| 6139 Hampden St | 0.54mi | 2/1.0 (-1) | 648 (-6%) | 2mo | $100,000 | $154 | 58 |
| 6049 Michael St | 0.22mi | 3/1.0 | 792 (+15%) | 11mo | $160,000 | $202 | 56 |
| 26252 Eton Ave | 0.69mi | 2/1.0 (-1) | 696 (+1%) | 8mo | $123,000 | $177 | 54 |
| 6739 Marvin St | 0.63mi | 2/1.0 (-1) | 702 (+2%) | 10mo | $135,000 | $192 | 54 |
| 6019 John Daly St | 0.59mi | 2/1.0 (-1) | 721 (+4%) | 9mo | $134,000 | $186 | 53 |
| 6935 Oldham St | 0.74mi | 2/1.0 (-1) | 687 (-0%) | 9mo | $45,900 | $67 | 52 |
| 6466 Burr St | 0.71mi | 2/1.0 (-1) | 709 (+3%) | 11mo | $105,000 | $148 | 48 |
| 6420 BURR St | 0.69mi | 2/1.0 (-1) | 709 (+3%) | 13mo | $94,000 | $133 | 47 |
Match score weights: distance 35% · size 25% · config 20% · recency 20%. Top-matched comps best support the ARV.
Projected returns pro-forma
-3.0% appreciation · 4.9% rent growth · sell at horizon
- IRR
- -0.1%
- Equity multiple
- 1.00×
- Total profit
- $-89
- Equity at exit
- $21,844
- IRR
- 11.3%
- Equity multiple
- 1.96×
- Total profit
- $39,429
- Equity at exit
- $12,667
Cash invested: $41,020 (down + closing). Projections, not guarantees.
Landlord ↔ Tenant lean methodology
- Overall (STATE)
- 62 Landlord-Friendly
- State Michigan
- 62 Landlord-Friendly · EVEN
- County
- — inherits STATE
- City
- — inherits STATE
ZIP-level market 48180
- Rents YoY
- 4.9%
- Active inventory
- 289
- Price-to-rent
- 7.7×
Monthly cashflow live
- Estimated rent
- $1,576 medium interval (Pro) →
- Mortgage (P&I)
- −$768
- Tax from tax record
- −$92 /mo · $1,104/yr
- Insurance
- −$61
- HOA
- −$0
- Vacancy / Maint / Mgmt
- −$331
- Net cashflow
- $324
Break-even live
Sensitivity live
| Price | -10% $407 | -5% $365 | +0% $324 | +5% $282 | +10% $241 |
|---|---|---|---|---|---|
| Rent | -10% $199 | -5% $261 | +0% $324 | +5% $386 | +10% $448 |
| Rate | -1.0pp $397 | -0.5pp $361 | base $324 | +0.5pp $286 | +1.0pp $247 |
UW: 25.0% down · 7.5% · 30yr · 1.5% tax · 5.0% vac · 8.0% maint · 8.0% mgmt
Financing live
Cash to close
- Down payment
- $36,625
- Closing costs
- $4,395
- Reserves months
- —
- Total cash needed
- —
Loan-product check · same deal, 3 products live
Conventional
25% down · 7.5% · 30yr
- Down + closing
- —
- Monthly P&I
- —
- Monthly cashflow
- —
- DSCR
- —
- Eligible?
- —
Personal DTI + credit; lowest rate.
DSCR
20% down · 8.5% · 30yr
- Down + closing
- —
- Monthly P&I
- —
- Monthly cashflow
- —
- DSCR
- —
- Eligible?
- —
No personal income docs; deal must DSCR.
Hard money
10% down · 12.0% · 12mo
- Down + closing
- —
- Monthly P&I
- —
- Monthly cashflow
- —
- DSCR
- —
- Eligible?
- —
Short-term bridge; refi at stabilization.
Rent comps 2 comps
| Address | Beds | Baths | Sqft | Rent | $/sqft | DOM | Units | Dist |
|---|---|---|---|---|---|---|---|---|
| 5845 Michael St Taylor, MI | 2.0 | 1.0 | 618 | $1,325 | $2.14 | 5d | 1 | 0.23mi |
| 7873 Syracuse St Taylor, MI | 2.0 | 1.0 | 728 | $1,400 | $1.92 | 45d | 1 | 1.48mi |
Listing history 11 events
-
2026-06-21days on market $146,500 Active 14 DOM
-
2026-06-18days on market $146,500 Active 11 DOM
-
2026-06-17days on market $146,500 Active 10 DOM
-
2026-06-16days on market $146,500 Active 9 DOM
-
2026-06-15pricedays on market $146,500 Active 8 DOM
-
2026-06-13days on market $148,000 Active 6 DOM
-
2026-06-13days on market $148,000 Active 5 DOM
-
2026-06-09days on market $148,000 Active 2 DOM
-
2026-06-08remarks 466-char remark
-
2026-06-08remarks 426-char remark
-
2026-06-08$148,000 Active 1 DOM
ⓘ Source: listings_history table (triggers on properties + properties_extension) + one-shot
backfill from property_details.listing_events for pre-trigger history.
Tax reassessment forecast MI · Partial reset (capped growth)
- Current annual tax
- $1,104 · $92/mo
- Projected year-2 tax
- $1,680 · $140/mo
- Expected delta
- +$576/yr (+$48/mo · 52.1%)
ⓘ Screening estimate from a state-policy table — verify with the county assessor before closing.
Climate risk First Street
- Flood 1/10 Low FEMA zone X (unshaded) · 0% chance over 30 yrs
- Wildfire 1/10 Low
- Heat 3/10 Moderate 7 d/yr ≥98°F today · 15 d/yr by 30 yrs out
- Wind 2/10 Low
- Air quality 2/10 Low 1 unhealthy d/yr today · 2 by 30 yrs out
Nearby sold comps map
Loading sold comps map…
Walkable amenities ~0.75 mi
Loading nearby amenities…
Taxation est. · year 1
- Rental income
- $18,911
- − Mortgage interest
- −$8,206
- − Property taxes
- −$1,104
- − Insurance
- −$732
- − Repairs & maintenance
- −$1,513
- − Management
- −$1,513
- − Depreciation
- −$4,262
- Taxable income
- $1,580
- Est. tax owed @ 24.0%
- −$379
- After-tax cash flow
- $3,504/yr
For passive investors: Depreciation is non-cash, so a rental often shows a tax loss while cash-flowing — sheltering income. Rental losses are passive: they offset passive income freely, and up to $25,000/yr can offset ordinary (W-2) income if you actively participate and your MAGI is under $100k (phasing out to $0 by $150k); unused losses carry forward. On sale, claimed depreciation is recaptured at up to 25%, and gains may owe capital-gains tax (a 1031 exchange can defer both). Figures are a year-1 estimate at your 24.0% rate — not tax advice; consult a CPA.
Schools (NCES district)
- District
- Taylor School District
- NCES district ID
- 2633540
- Math proficiency
- 14% ▼ -7.00%
- Reading proficiency
- 27% ▼ -4.00%
- Median HH income
- $43,062
- Composite
- 17.62/100
- National rank
- #9034
- State rank
- #462 of 540 in MI
Livability — Taylor
- Score
- 76/100
- State rank
- #144
- US rank
- #3684
Category grades
Schools grade is shown separately in the Schools card above.
Census & demographics
- Census place
- Taylor, MI
- County
- Wayne County · 1,562,939 people
- City population
- 62,081
- Metro
- Detroit-Warren-Dearborn, MI
- Population (ZIP)
- 62,081
- Household income
- $61,081
- Rent vs Own
- Severe rent burden
- 1957.0
Population outlook (Wayne County) Hauer SSP2
- Today (2025)
- 1,675,273 people
- By 2030
- 1,620,300 · -3.3%
- By 2040
- 1,502,341 · -10.3%
- By 2050
- 1,384,039 · -17.4%
- By 2075
- 1,124,592 · -32.9%
- By 2100
- 881,193 · -47.4%
Race, ethnicity, and origin ACS 2023
- Neighborhood character
- Majority White (65%)
- Race & ethnicity
- White 65% Black 19% Two or more races 9% Hispanic / Latino 9% Asian 2%
- Hispanic origin (detail)
- Mexican 6% Puerto Rican 2%
- Common ancestry
- Romanian 8% Lithuanian 3% Slovak 2%
- Foreign-born
- 7% · Canada
- Languages at home
- 89% English-only · Spanish 4% Arabic 3% Other Indo-European 3%
Political lean MEDSL · Wayne
- 2024 margin
- Strong D (+29.0) · D 62.7% · R 33.7% · Other 3.6%
- 2008→2024 swing
- -20.5pp toward R · 2008: 49.5pp · 2024: 29.0pp
- All cycles
- 2024: D+29.0 2020: D+38.1 2016: D+37.3 2012: D+46.9 2008: D+49.5
Not yet ingested
- Civics
- —
Market trends
- HPI YoY
- ▼ -212.33%
- Current HPI
- 228.921
- Rent YoY
- ▲ 4.90%
- Metro
- Detroit-Warren-Dearborn, MI
- State GDP YoY
- ▲ 1.37%
- F500 in state
- 28
Industry mix (Fortune 500 HQ in MI)
| Industry | F500 HQs | Revenue |
|---|---|---|
| Automotive Parts | 3 | $48B |
|
||
| Automotive | 2 | $372B |
|
||
| Chemicals | 1 | $45B |
|
||
| Automotive Retail | 1 | $29B |
|
||
| Healthcare / Medical Devices | 1 | $23B |
|
||
| Automotive Technology | 1 | $20B |
|
||
Price history
+111.7% since first listed27 events — show timeline
- 2026-06-07 Listed $148,000 REALCOMP
- 2026-06-07 Listed $148,000 MiRealSource-MiMLS
- 2025-05-02 Sold (Public Records) $140,000 Public Records
- 2025-05-01 Sold (MLS) $140,000 REALCOMP
- 2025-05-01 Sold (MLS) $140,000 MiRealSource-MiMLS
- 2025-04-18 Pending — MiRealSource-MiMLS
- 2025-04-18 Pending — REALCOMP
- 2025-04-10 Price Changed $144,900 MiRealSource-MiMLS
- 2025-04-10 Price Changed $144,900 REALCOMP
- 2025-03-20 Listed $149,900 REALCOMP
- 2025-03-20 Listed $149,900 MiRealSource-MiMLS
- 2025-02-19 Sold (Public Records) $50,000 Public Records
- 2025-01-27 Sold (MLS) $50,000 MiRealSource-MiMLS
- 2025-01-27 Sold (MLS) $50,000 REALCOMP
- 2025-01-15 Pending — MiRealSource-MiMLS
- 2025-01-15 Pending — REALCOMP
- 2025-01-13 Listed $60,000 MiRealSource-MiMLS
- 2025-01-10 Listed $60,000 REALCOMP
- 2005-11-25 Sold (Public Records) $57,165 Public Records
- 2005-02-15 Sold (MLS) $57,165 MiRealSource-MiMLS
- 2005-02-15 Sold (MLS) $57,165 REALCOMP
- 2005-01-17 Listing Removed — MiRealSource-MiMLS
- 2004-11-29 Listed $61,500 MiRealSource-MiMLS
- 2004-11-29 Listed $61,500 REALCOMP
- 2003-11-26 Listing Removed — MiRealSource-MiMLS
- 2003-07-26 Listed $69,900 REALCOMP
- 2003-07-26 Listed $69,900 MiRealSource-MiMLS
Property tax history
-1.0%/yrLatest (2025): $1,104 · +2.3% YoY. Source: county tax records.
Cash-flow waterfall
monthlySold comps — $/sqft
last 12 mo · ≤1 miLoading sold comps…