 Multi-family
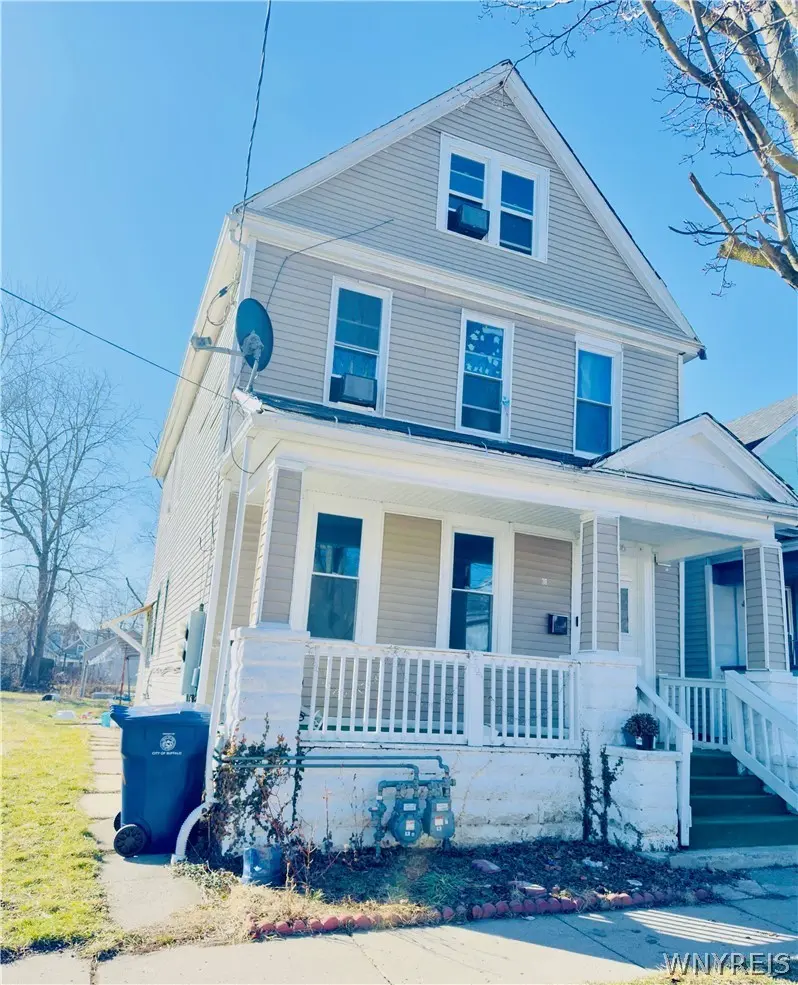
36 Johnson St · Buffalo, NY
Flood risk 1/10 · Minimal
- FEMA flood zone
- X (unshaded)
- Chance of flooding over 30 yrs
- 0.0%
- Est. flood insurance / yr
- $473 – $860
Fire risk 1/10 · Minimal
- Est. fire insurance / yr
- $691 – $1,283
Heat risk 3/10 · Minor
- Hot days now (above 92°F)
- 7 days/yr
- Hot days in 30 yrs
- 15 days/yr
Wind risk 1/10 · Minimal
- Chance of severe wind over 30 yrs
- —
Air-quality risk 3/10 · Minor
- Unhealthy air days now
- 2 days/yr
- Unhealthy air days in 30 yrs
- 3 days/yr
Risk factors via First Street. Map © Google.
Why this score? — see what drove the C- grade
The composite is a weighted blend of 9 inputs, each scored 0–100. Each bar is that input's sub-score; the figure is the points it added to the 100-point composite (weight × sub-score).
- ARV discount +12.3/15.0
- Cash flow +11.1/30.0
- Appreciation +10.0/10.0
- Livability +3.9/5.0
- Schools +3.3/10.0
- 1% rule +3.2/10.0
- DSCR +3.2/10.0
- Rent growth +2.5/5.0
- Condition / age +2.5/5.0
$153,999
🖨 Deal sheet 📄 Offer letter ✓ Due diligence
Multi-family units
County records classify this as Multi-Family (2-4 Unit). Listing-text estimate: 1 unit. estimate disagrees with records
Listing remarks MLS
Don't pass up the opportunity to snatch up your next home or investment property. This is a multi family house. 4 bedroom, 2 bath and living-dining attach. Just needs some general updating and personal touches to make it a homey place to live. Close to Bailey Ave and retail/restaurants. Offers will be reviews on 03/27/26 at 5PM.
Key facts
- Living dining attach
- Multi family house
- 3,300 sq ft lot
Tags
Neighborhood map
What this means for you Summary
Snapshot
- This is a 4-bed/2.0-bath multifamily listed at $154k.
Deal economics
- At list price, monthly cash flow is $-61 ($-729/yr) — negative.
- To cash-flow at today's rent, offer at most $145k (5.7% below list).
- To meet the 1% rule (rent ≥ 1% of price), the offer needs to be $127k (17.5% below list).
- Recommended offer: $127k (17.5% below list) — sets the bar for 1% rule.
- Cap rate 5.8% vs local median 8.0% in Buffalo — below-typical yield; the buyer is paying a premium for something (appreciation thesis, condition, location) that the cap rate doesn't capture.
Location & tenants
- Location reads 77/100 on livability (#195 in NY, #3,011 nationally) — a middle-class / working-renter tenant base. Strengths: commute A+, housing A+, health & safety A+; Watch: crime F, employment D-.
- Buffalo City School District (urban): math 41% / reading 40% proficiency, ranked #535 of 590 in NY (top 91%) — families likely to look elsewhere, expect single-tenant / working-renter base with shorter leases; 75% free/reduced lunch — lower-income household profile, screen leases tightly.
- Market conditions: 83 active listings in the ZIP; 3 comparable units currently listed for rent nearby; rentals at typical pace (median 24d on market — plan ~3-4 weeks tenant-placement turnaround); 1,244 units permitted in Erie County in 2024 (563 in 5+ unit buildings).
Forward outlook
- In year one you build about $16k of equity ($1k loan paydown + $15k appreciation (10.0% local appreciation)).
- At projected returns (10.0% appreciation + 3.0% rent growth), your $43k cash investment doubles in ~3 years — after that, you're playing with house money.
- By year 3, paydown + projected appreciation supports a ~$42k cash-out refi (75% LTV) — recoverable capital for the next deal without selling this one.
Negotiation context
- It's been on market 56 days — a 3% lower offer ($149k) is reasonable based on typical stale-listing flexibility.
- 6 sale attempts since 11y ago with the ask held roughly flat each time — persistent listings suggest the price (not the market) is what's stuck; bring a comps-based counter.
Risks & watch-outs
- Watch-outs: built in 1901 — expect roof / HVAC / electrical / plumbing capex.
Questions for the listing agent
- What do current leases actually rent for vs. the listed asking? Can we see a recent rent roll and the last 12 months of T-12 income?
- It's been on market 56 days. Have you received any prior offers? Is the seller open to a 18% concession, seller financing, or rate buy-down credit?
- Built in 1901 — when were the roof, HVAC, electrical panel, plumbing, and water heater last replaced?
- Is there a deadline driving the sale (1031 exchange, divorce, estate, relocation)? That informs how much negotiation room exists.
- Crime grade is F in this area — have there been break-ins, vandalism, or insurance claims at this property in the last 3 years? What carrier currently insures it and at what premium?
- What's the average days-on-market for RENTAL listings here right now (not sales)? A rising rental-DOM trend means longer vacancies and softer asking-rent achievability than the comps imply.
- What's the recent tenant-quality profile in this submarket — average credit score on applications, eviction rate, late-payment / NSF rate, and stable-employment percentage? A property-management company in the area should have these aggregated.
- How much new apartment / multifamily construction is in the pipeline within 1–3 miles? Heavy new supply (>2% of stock underway) typically softens rents 12–24 months out; light construction supports rent growth.
Investment metrics
- 1% rule
- 0.82% ✗
- Cap rate
- 5.82%
- Cash-on-cash
- -1.69%
- DSCR
- 0.92
- GRM
- 10.1
CMA / ARV
- ARV (median comp)
- $172,355
- List price
- $153,999
- Delta
- -10.65%
- Verdict
- UNDERPRICED
- Comps
- 20 within 1.0 mi
Show comp detail 10 sales within ~0.75 mi
| Address | Dist | Beds/Ba | Sqft | Sold | Price | $/sf | Match |
|---|---|---|---|---|---|---|---|
| 443 Madison St | 0.22mi | 5/2.0 (+1) | 1,892 (+1%) | 8mo | $75,000 | $40 | 76 |
| 324 Carlton St | 0.61mi | 4/2.0 | 1,947 (+4%) | 4mo | $66,100 | $34 | 62 |
| 236 Grey St | 0.38mi | 4/2.0 | 2,106 (+12%) | 12mo | $175,000 | $83 | 52 |
| 41 Pershing Ave | 0.65mi | 4/2.0 | 1,938 (+3%) | 17mo | $145,000 | $75 | 50 |
| 64 Sweet Ave | 0.74mi | 5/2.0 (+1) | 1,740 (-7%) | 7mo | $145,000 | $83 | 42 |
| 121 Reed St | 0.40mi | 4/3.0 | 1,611 (-14%) | 16mo | $155,000 | $96 | 40 |
| 131 Locust St | 0.71mi | 4/2.0 | 1,772 (-6%) | 23mo | $195,000 | $110 | 38 |
| 16 Lombard St | 0.69mi | 4/2.0 | 1,677 (-11%) | 22mo | $98,000 | $58 | 32 |
| 352 Guilford St | 0.71mi | 5/2.0 (+1) | 2,088 (+11%) | 14mo | $120,000 | $57 | 31 |
| 132 Gibson St | 0.55mi | 3/2.0 (-1) | 1,626 (-13%) | 23mo | $160,000 | $98 | 28 |
Match score weights: distance 35% · size 25% · config 20% · recency 20%. Top-matched comps best support the ARV.
Projected returns pro-forma
10.0% appreciation · 3.0% rent growth · sell at horizon
- IRR
- 23.1%
- Equity multiple
- 2.86×
- Total profit
- $80,022
- Equity at exit
- $138,734
- IRR
- 20.6%
- Equity multiple
- 6.54×
- Total profit
- $238,731
- Equity at exit
- $299,186
Cash invested: $43,120 (down + closing). Projections, not guarantees.
Landlord ↔ Tenant lean methodology
- Overall (STATE)
- 15 Strongly Tenant-Friendly
- State New York
- 15 Strongly Tenant-Friendly · D+10
- County
- — inherits STATE
- City
- — inherits STATE
ZIP-level market 14212
- Home prices YoY
- 20.4%
- Active inventory
- 83
- Price-to-rent
- 10.1×
Monthly cashflow live
- Estimated rent
- $1,270 medium interval (Pro) →
- Mortgage (P&I)
- −$808
- Tax est. 1.5%
- −$192 /mo · $2,310/yr
- Insurance
- −$64
- HOA
- −$0
- Vacancy / Maint / Mgmt
- −$267
- Net cashflow
- $-61
Break-even live
UW: 25.0% down · 7.5% · 30yr · 1.5% tax · 5.0% vac · 8.0% maint · 8.0% mgmt
Financing live
Cash to close
- Down payment
- $38,500
- Closing costs
- $4,620
- Reserves months
- —
- Total cash needed
- —
Loan-product check · same deal, 3 products live
Conventional
25% down · 7.5% · 30yr
- Down + closing
- —
- Monthly P&I
- —
- Monthly cashflow
- —
- DSCR
- —
- Eligible?
- —
Personal DTI + credit; lowest rate.
DSCR
20% down · 8.5% · 30yr
- Down + closing
- —
- Monthly P&I
- —
- Monthly cashflow
- —
- DSCR
- —
- Eligible?
- —
No personal income docs; deal must DSCR.
Hard money
10% down · 12.0% · 12mo
- Down + closing
- —
- Monthly P&I
- —
- Monthly cashflow
- —
- DSCR
- —
- Eligible?
- —
Short-term bridge; refi at stabilization.
Rent comps 3 comps
| Address | Beds | Baths | Sqft | Rent | $/sqft | DOM | Units | Dist |
|---|---|---|---|---|---|---|---|---|
| 491 Emslie St Buffalo, NY | 3.0 | 1.0 | 2488 | $1,200 | $0.48 | 14d | 1 | 0.16mi |
| 518 Wilson St Buffalo, NY | 5.0 | 1.5 | 1848 | $1,500 | $0.81 | 23d | 1 | 0.64mi |
| 79 Walden Ave Buffalo, NY | 3.0 | 1.0 | 2528 | $1,250 | $0.49 | 43d | 1 | 1.08mi |
Listing history 20 events
-
2026-05-11status Pending 330-char remark
Show marketing remark (330 chars)
Don't pass up the opportunity to snatch up your next home or investment property. This is a multi family house. 4 bedroom, 2 bath and living-dining attach. Just needs some general updating and personal touches to make it a homey place to live. Close to Bailey Ave and retail/restaurants. Offers will be reviews on 03/27/26 at 5PM.
-
2026-03-16$153,999 Active 330-char remark
Show marketing remark (330 chars)
Don't pass up the opportunity to snatch up your next home or investment property. This is a multi family house. 4 bedroom, 2 bath and living-dining attach. Just needs some general updating and personal touches to make it a homey place to live. Close to Bailey Ave and retail/restaurants. Offers will be reviews on 03/27/26 at 5PM.
-
2025-05-21soldstatus $137,000
-
2022-01-05soldstatus $125,000
-
2021-03-16soldstatus $60,000
-
2019-04-17soldstatus $41,000
-
2019-04-15soldstatus $41,000 Closed Sale or Rented 574-char remark
Show marketing remark (574 chars)
Great for investor or owner occupied. This neighborhood is on the upswing with a number of Habitat homes and close to downtown and Medical Center. Updates have been made which include roof, siding, front porch, electrical panel, 1st floor kitchen and 1st floor bathroom. Only 2nd floor kitchen and bathroom remain to be completed. Property is being sold as is and buyer will be responsible for updating search (3 years) and survey. CAN BE SOLD AS PACKAGE with 48 & 50 Johnson (B1168438, B1168425). Great opportunity to own 3 homes on the street. BRING YOUR BEST OFFER.
-
2019-02-20status Pending Sale 574-char remark
Show marketing remark (574 chars)
Great for investor or owner occupied. This neighborhood is on the upswing with a number of Habitat homes and close to downtown and Medical Center. Updates have been made which include roof, siding, front porch, electrical panel, 1st floor kitchen and 1st floor bathroom. Only 2nd floor kitchen and bathroom remain to be completed. Property is being sold as is and buyer will be responsible for updating search (3 years) and survey. CAN BE SOLD AS PACKAGE with 48 & 50 Johnson (B1168438, B1168425). Great opportunity to own 3 homes on the street. BRING YOUR BEST OFFER.
-
2019-02-11status Under Contract- Do Not Show 574-char remark
Show marketing remark (574 chars)
Great for investor or owner occupied. This neighborhood is on the upswing with a number of Habitat homes and close to downtown and Medical Center. Updates have been made which include roof, siding, front porch, electrical panel, 1st floor kitchen and 1st floor bathroom. Only 2nd floor kitchen and bathroom remain to be completed. Property is being sold as is and buyer will be responsible for updating search (3 years) and survey. CAN BE SOLD AS PACKAGE with 48 & 50 Johnson (B1168438, B1168425). Great opportunity to own 3 homes on the street. BRING YOUR BEST OFFER.
-
2019-02-11status Active 574-char remark
Show marketing remark (574 chars)
Great for investor or owner occupied. This neighborhood is on the upswing with a number of Habitat homes and close to downtown and Medical Center. Updates have been made which include roof, siding, front porch, electrical panel, 1st floor kitchen and 1st floor bathroom. Only 2nd floor kitchen and bathroom remain to be completed. Property is being sold as is and buyer will be responsible for updating search (3 years) and survey. CAN BE SOLD AS PACKAGE with 48 & 50 Johnson (B1168438, B1168425). Great opportunity to own 3 homes on the street. BRING YOUR BEST OFFER.
-
2019-02-01status Under Contract- Do Not Show 574-char remark
Show marketing remark (574 chars)
Great for investor or owner occupied. This neighborhood is on the upswing with a number of Habitat homes and close to downtown and Medical Center. Updates have been made which include roof, siding, front porch, electrical panel, 1st floor kitchen and 1st floor bathroom. Only 2nd floor kitchen and bathroom remain to be completed. Property is being sold as is and buyer will be responsible for updating search (3 years) and survey. CAN BE SOLD AS PACKAGE with 48 & 50 Johnson (B1168438, B1168425). Great opportunity to own 3 homes on the street. BRING YOUR BEST OFFER.
-
2019-01-15$54,900 Active 574-char remark
Show marketing remark (574 chars)
Great for investor or owner occupied. This neighborhood is on the upswing with a number of Habitat homes and close to downtown and Medical Center. Updates have been made which include roof, siding, front porch, electrical panel, 1st floor kitchen and 1st floor bathroom. Only 2nd floor kitchen and bathroom remain to be completed. Property is being sold as is and buyer will be responsible for updating search (3 years) and survey. CAN BE SOLD AS PACKAGE with 48 & 50 Johnson (B1168438, B1168425). Great opportunity to own 3 homes on the street. BRING YOUR BEST OFFER.
-
2016-03-30historical
-
2016-02-26status Pending Sale
-
2016-01-04$12,000 Active
-
2016-01-04historical
-
2015-10-15price $12,000
-
2015-08-31price $18,000
-
2015-08-18status Active
-
2015-03-16$28,000
ⓘ Source: listings_history table (triggers on properties + properties_extension) + one-shot
backfill from property_details.listing_events for pre-trigger history.
Climate risk First Street
- Flood 1/10 Low FEMA zone X (unshaded) · 0% chance over 30 yrs
- Wildfire 1/10 Low
- Heat 3/10 Moderate 7 d/yr ≥92°F today · 15 d/yr by 30 yrs out
- Wind 1/10 Low
- Air quality 3/10 Moderate 2 unhealthy d/yr today · 3 by 30 yrs out
Nearby sold comps map
Loading sold comps map…
Walkable amenities ~0.75 mi
Loading nearby amenities…
Taxation est. · year 1
- Rental income
- $15,243
- − Mortgage interest
- −$8,626
- − Property taxes
- −$2,310
- − Insurance
- −$770
- − Repairs & maintenance
- −$1,219
- − Management
- −$1,219
- − Depreciation
- −$4,480
- Taxable loss
- −$3,382
- Est. tax savings @ 24.0%
- +$812
- After-tax cash flow
- $83/yr
For passive investors: Depreciation is non-cash, so a rental often shows a tax loss while cash-flowing — sheltering income. Rental losses are passive: they offset passive income freely, and up to $25,000/yr can offset ordinary (W-2) income if you actively participate and your MAGI is under $100k (phasing out to $0 by $150k); unused losses carry forward. On sale, claimed depreciation is recaptured at up to 25%, and gains may owe capital-gains tax (a 1031 exchange can defer both). Figures are a year-1 estimate at your 24.0% rate — not tax advice; consult a CPA.
Schools (NCES district)
- District
- Buffalo City School District
- NCES district ID
- 3605850
- Math proficiency
- 41% ▲ 11.00%
- Reading proficiency
- 40% ▲ 7.00%
- Median HH income
- $31,665
- Composite
- 33.17/100
- National rank
- #5544
- State rank
- #535 of 590 in NY
Livability — Buffalo
- Score
- 77/100
- State rank
- #195
- US rank
- #3011
Category grades
Schools grade is shown separately in the Schools card above.
Census & demographics
- Census place
- Buffalo, NY
- City population
- 440,021
- Population (ZIP)
- 13,603
Population outlook (Erie County) Hauer SSP2
- Today (2025)
- 933,037 people
- By 2030
- 935,181 · +0.2%
- By 2040
- 928,531 · -0.5%
- By 2050
- 905,725 · -2.9%
- By 2075
- 834,037 · -10.6%
- By 2100
- 708,033 · -24.1%
Race, ethnicity, and origin ACS 2023
- Neighborhood character
- Highly diverse neighborhood (Simpson 0.75)
- Race & ethnicity
- White 32% Black 27% Asian 25% Hispanic / Latino 9% Two or more races 8%
- Hispanic origin (detail)
- Puerto Rican 8%
- Common ancestry
- Romanian 12% Serbian 1% Lithuanian 1%
- Foreign-born
- 20% · Philippines, Canada, China
- Languages at home
- 68% English-only · Other Indo-European 18% Spanish 4% Other Asian/Pacific 2%
Political lean MEDSL · Erie
- 2024 margin
- Lean D (+9.7) · D 54.8% · R 45.2%
- 2008→2024 swing
- -7.9pp toward R · 2008: 17.5pp · 2024: 9.7pp
- All cycles
- 2024: D+9.7 2020: D+14.7 2016: D+4.8 2012: D+15.6 2008: D+17.5
Not yet ingested
- Civics
- —
Market trends
- HPI YoY
- ▲ 79.80%
- Current HPI
- 471.6399
- Rent YoY
- —
- Metro
- —
- State GDP YoY
- ▲ 2.60%
- F500 in state
- 92
Industry mix (Fortune 500 HQ in NY)
| Industry | F500 HQs | Revenue |
|---|---|---|
| Financial Services | 10 | $950B |
|
||
| Consumer Goods | 9 | $162B |
|
||
| Insurance | 4 | $225B |
|
||
| Telecommunications | 2 | $144B |
|
||
| Pharmaceuticals | 2 | $112B |
|
||
| Media / Entertainment | 2 | $69B |
|
||
Price history
+450.0% since first listed20 events — show timeline
- 2026-05-11 Pending — WNYREIS
- 2026-03-16 Listed $153,999 WNYREIS
- 2025-05-21 Sold (Public Records) $137,000 Public Records
- 2022-01-05 Sold (Public Records) $125,000 Public Records
- 2021-03-16 Sold (Public Records) $60,000 Public Records
- 2019-04-17 Sold (Public Records) $41,000 Public Records
- 2019-04-15 Sold (MLS) $41,000 WNYREIS
- 2019-02-20 Pending — WNYREIS
- 2019-02-11 Pending — WNYREIS
- 2019-02-11 Relisted — WNYREIS
- 2019-02-01 Pending — WNYREIS
- 2019-01-15 Listed $54,900 WNYREIS
- 2016-03-30 Listing Removed — WNYREIS
- 2016-02-26 Pending — WNYREIS
- 2016-01-04 Listed $12,000 WNYREIS
- 2016-01-04 Listing Removed — WNYREIS
- 2015-10-15 Price Changed $12,000 WNYREIS
- 2015-08-31 Price Changed $18,000 WNYREIS
- 2015-08-18 Relisted — WNYREIS
- 2015-03-16 Listed $28,000 WNYREIS
Property tax history
+2.9%/yrLatest (2025): $101 · +0.0% YoY. Source: county tax records.
Cash-flow waterfall
monthlySold comps — $/sqft
last 12 mo · ≤1 miLoading sold comps…