20401 Soledad Cyn #560 · Santa Clarita, CA
Flood risk 3/10 · Minor
- FEMA flood zone
- X (unshaded)
- Chance of flooding over 30 yrs
- 0.17%
- Est. flood insurance / yr
- $507 – $1,088
Fire risk 8/10 · Major
- Est. fire insurance / yr
- $659 – $1,223
Heat risk 7/10 · Major
- Hot days now (above 99°F)
- 7 days/yr
- Hot days in 30 yrs
- 20 days/yr
Wind risk 1/10 · Minimal
- Chance of severe wind over 30 yrs
- —
Air-quality risk 6/10 · Moderate
- Unhealthy air days now
- 9 days/yr
- Unhealthy air days in 30 yrs
- 13 days/yr
Risk factors via First Street. Map © Google.
Why this score? — see what drove the B grade
The composite is a weighted blend of 9 inputs, each scored 0–100. Each bar is that input's sub-score; the figure is the points it added to the 100-point composite (weight × sub-score).
- Cash flow +30.0/30.0
- 1% rule +10.0/10.0
- DSCR +10.0/10.0
- ARV discount +7.5/15.0
- Schools +5.9/10.0
- Livability +3.5/5.0
- Rent growth +2.9/5.0
- Condition / age +2.5/5.0
- Appreciation +0.0/10.0
$129,500
🖨 Deal sheet 📄 Offer letter ✓ Due diligence
Listing remarks
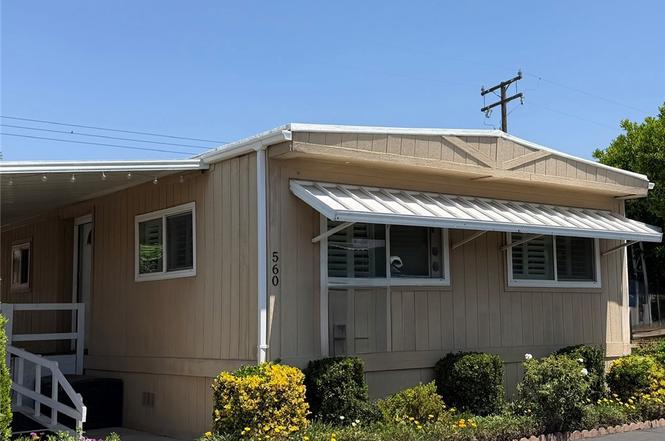
Beautifully updated home featuring a large covered front porch and spacious fenced yard. Inside, you’ll find numerous upgrades throughout, including a remodeled kitchen with white soft-close cabinets, granite countertops, and newer stainless steel appliances. The fully remodeled bathroom features a new vanity with granite countertops and an oversized tiled walk-in shower. Additional highlights include vinyl shutters, ceiling fans throughout, and an included stackable washer and dryer. Outside offers two good-sized storage sheds and a private covered carport with parking for up to 3 vehicles. Move-in ready with modern upgrades throughout!
Key facts
- White cabinets
- Open walkway space
- Granite counter tops
Tags
Property features AI
Finance
- Other: Park name: Parklane
- Financial info: Monthly land lease of $1,356.96 (park-managed)
- HOA & community: Parklane community; Gutters and sidewalks in community
Exterior
- Parking: Attached carport with 3 spaces
- Utilities: Public sewer; Public/District water; Water available and sewer connected
- Home design: Single-story; Mobile home model Newport; Entry at front
- Construction: Mobile home (24' x 48'); Mobile home remains on site; Construction and year built per public records
- Exterior features: Metal roof; Awning; Front porch; Community pool; Wood skirt; Two sheds; Patio home with backyard
Interior
- Kitchen: Garbage disposal; Microwave; Gas oven; Dishwasher; Granite counters
- Flooring: Tile; Wood
- Bathrooms: Walk-in shower; Shower; Vanity area; Granite counters
- Heating & cooling: Central furnace heating; Gas cooling
- Interior features: Double door entry; Ceiling fan; Granite counters; Shutters; Resident manager on site
- Laundry & utility: Has laundry; Stackable washer/dryer
Neighborhood map
What this means for you Summary
Snapshot
- This is a 2-bed/1.0-bath manufactured listed at $130k.
Deal economics
- At list price, monthly cash flow is $2k ($18k/yr) — positive.
- The deal already cash-flows at list — no discount required.
- Meets the 1% rule at list price ($3k rent vs $130k).
- Recommended offer: $118k (9.0% below list) — sets the bar for market timing.
- Cap rate 20.3% vs local median 2.8% in Santa Clarita — top-decile yield for the area; either an underpriced asset or a hidden risk that comps aren't pricing in. Stress-test before assuming the spread holds.
Location & tenants
- Location reads 70/100 on livability (#229 in CA) — a middle-class / working-renter tenant base. Strengths: employment A+, housing A, crime A-; Watch: amenities D+, cost of living F, health & safety F.
- William S. Hart Union High (suburban): math 52% / reading 72% proficiency, ranked #155 of 1,400 in CA (top 11%) — acceptable for families but not a draw, mixed tenant base, ~2y average lease; only 18% free/reduced lunch — higher-income household profile.
- Market conditions: Rents rising (+1.7%/yr); 106 active listings in the ZIP; 14 comparable units currently listed for rent nearby; rentals leasing fast (median 1d on market — plan ~1-2 weeks tenant-placement turnaround); high-income renter base; 19,697 units permitted in Los Angeles County in 2024 (9,426 in 5+ unit buildings).
Forward outlook
- Local home prices are declining (-3.0%/yr); year-one equity from $895 of loan paydown is wiped out by about $4k of value loss. Plan a longer hold.
- Los Angeles County population projected at +9% by 2050 — modest demand growth; plan on rents tracking national, not racing it.
- At projected returns (-3.0% appreciation + 1.7% rent growth), your $36k cash investment doubles in ~3 years — after that, you're playing with house money.
Negotiation context
- It's been on market 114 days — a 9% lower offer ($118k) is reasonable based on typical stale-listing flexibility.
Risks & watch-outs
- Climate carrying-cost: severe wildfire risk; extreme-heat days projected 7→20/yr by 2055 (HVAC capex compounding) — expect insurance premiums to compound above CPI over the hold.
Questions for the listing agent
- It's been on market 114 days. Have you received any prior offers? Is the seller open to a 9% concession, seller financing, or rate buy-down credit?
- Built in 1969 — when were the roof, HVAC, electrical panel, plumbing, and water heater last replaced?
- Why hasn't it sold? Are there any deal-killer items the seller is aware of (foundation, flood, title, zoning, code violations)?
- Is there a deadline driving the sale (1031 exchange, divorce, estate, relocation)? That informs how much negotiation room exists.
- Schools are B-rated — typically a magnet for longer-tenancy family renters. What's the average tenant stay here, and is there a school-zone premium baked into asking?
- What's the average days-on-market for RENTAL listings here right now (not sales)? A rising rental-DOM trend means longer vacancies and softer asking-rent achievability than the comps imply.
- What's the recent tenant-quality profile in this submarket — average credit score on applications, eviction rate, late-payment / NSF rate, and stable-employment percentage? A property-management company in the area should have these aggregated.
- How much new for-sale + rental construction is in the pipeline within 1–3 miles? Heavy new supply typically softens prices + rents 12–24 months out; constrained supply supports both.
Investment metrics
- 1% rule
- 2.22% ✓
- Cap rate
- 20.30%
- Cash-on-cash
- 50.03%
- DSCR
- 3.23
- GRM
- 3.8
CMA / ARV
No comps found within radius.
Projected returns pro-forma
-3.0% appreciation · 1.7% rent growth · sell at horizon
- IRR
- 46.3%
- Equity multiple
- 2.97×
- Total profit
- $71,543
- Equity at exit
- $19,309
- IRR
- 51.5%
- Equity multiple
- 5.72×
- Total profit
- $171,279
- Equity at exit
- $11,197
Cash invested: $36,260 (down + closing). Projections, not guarantees.
Landlord ↔ Tenant lean methodology
- Overall (STATE)
- 18 Strongly Tenant-Friendly
- State California
- 18 Strongly Tenant-Friendly · D+13
- County
- — inherits STATE
- City
- — inherits STATE
ZIP-level market 91351
- Rents YoY
- 1.7%
- Active inventory
- 106
- Price-to-rent
- 3.8×
Monthly cashflow live
- Estimated rent
- $2,871 high interval (Pro) →
- Mortgage (P&I)
- −$679
- Tax from tax record
- −$24 /mo · $283/yr
- Insurance
- −$54
- HOA
- −$0
- Vacancy / Maint / Mgmt
- −$603
- Net cashflow
- $1,512
Break-even live
UW: 25.0% down · 7.5% · 30yr · 1.5% tax · 5.0% vac · 8.0% maint · 8.0% mgmt
Financing live
Cash to close
- Down payment
- $32,375
- Closing costs
- $3,885
- Reserves months
- —
- Total cash needed
- —
Loan-product check · same deal, 3 products live
Conventional
25% down · 7.5% · 30yr
- Down + closing
- —
- Monthly P&I
- —
- Monthly cashflow
- —
- DSCR
- —
- Eligible?
- —
Personal DTI + credit; lowest rate.
DSCR
20% down · 8.5% · 30yr
- Down + closing
- —
- Monthly P&I
- —
- Monthly cashflow
- —
- DSCR
- —
- Eligible?
- —
No personal income docs; deal must DSCR.
Hard money
10% down · 12.0% · 12mo
- Down + closing
- —
- Monthly P&I
- —
- Monthly cashflow
- —
- DSCR
- —
- Eligible?
- —
Short-term bridge; refi at stabilization.
Rent comps 14 comps
| Address | Beds | Baths | Sqft | Rent | $/sqft | DOM | Units | Dist |
|---|---|---|---|---|---|---|---|---|
| 26955 Rainbow Glen Dr Santa Clarita, CA | 3.0 | 2.0 | 1007 | $2,850 | $2.83 | 1d | 1 | 0.19mi |
| 26941 Rainbow Glen Dr #751 Canyon Country, CA | 2.0 | 2.0 | 907 | $2,900 | $3.20 | 1d | 1 | 0.20mi |
| 26842 Claudette St #204 Canyon Country, CA | 2.0 | 2.0 | 964 | $2,650 | $2.75 | 1d | 1 | 0.25mi |
| 26921 Flo Ln Canyon Country, CA | 3.0 | 2.0 | 1107 | $2,950 | $2.66 | 1d | 1 | 0.26mi |
| 20345 Rue Crevier Santa Clarita, CA | 2.0 | 2.0 | 907 | $2,700 | $2.98 | 1d | 1 | 0.27mi |
| 26956 Flo Ln #338 Canyon Country, CA | 2.0 | 2.0 | 1064 | $2,875 | $2.70 | 1d | 1 | 0.28mi |
| 26901 Rainbow Glen Dr Santa Clarita, CA | 3.0 | 2.0 | 1001 | $2,950 | $2.95 | 1d | 1 | 0.30mi |
| 26741 Isabella Pkwy Canyon Country, CA | 1.0–2.0 | 1.0–2.0 | 850 | $2,989 | $3.52 | 1d | 3 | 0.35mi |
| 27301 Whites Canyon Rd Canyon Country, CA | 2.0 | 2.0 | 900 | $1,995 | $2.22 | 17d | 2 | 1.08mi |
| 19300 Maybrook LN Santa Clarita, CA | 1.0–3.0 | 1.0–2.0 | 1017 | $3,222 | $3.17 | 1d | 61 | 1.21mi |
| 28085 Whites Canyon Rd Canyon Country, CA | 1.0–2.0 | 1.0–2.0 | 714 | $2,100 | $2.94 | 1d | 7 | 1.27mi |
| 19028 Drycliff St Unit C Canyon Country, CA | 3.0 | 1.5 | 982 | $3,600 | $3.67 | 2d | 1 | 1.30mi |
| 27077 Hidaway Ave Canyon Country, CA | 2.0 | 1.0 | 960 | $2,400 | $2.50 | 1d | 1 | 1.38mi |
| 27070 Hidaway Ave #4 Canyon Country, CA | 2.0 | 1.5 | 1078 | $3,200 | $2.97 | 2d | 1 | 1.50mi |
Listing history 17 events
-
2026-06-18days on market $129,500 Active 114 DOM
-
2026-06-17days on market $129,500 Active 113 DOM
-
2026-06-16days on market $129,500 Active 112 DOM
-
2026-06-15days on market $129,500 Active 111 DOM
-
2026-06-13days on market $129,500 Active 109 DOM
-
2026-06-13days on market $129,500 Active 108 DOM
-
2026-06-09days on market $129,500 Active 105 DOM
-
2026-06-08days on market $129,500 Active 104 DOM
-
2026-06-07days on market $129,500 Active 103 DOM
-
2026-06-04days on market $129,500 Active 100 DOM
-
2026-06-03days on market $129,500 Active 99 DOM
-
2026-06-02days on market $129,500 Active 98 DOM
-
2026-06-01days on market $129,500 Active 97 DOM
-
2026-05-31days on market $129,500 Active 96 DOM
-
2026-04-11price $129,500
-
2026-02-25price $129,900
-
2026-02-24$129 Active
ⓘ Source: listings_history table (triggers on properties + properties_extension) + one-shot
backfill from property_details.listing_events for pre-trigger history.
Tax reassessment forecast CA · Resets to sale price
- Current annual tax
- $283 · $24/mo
- Projected year-2 tax
- $984 · $82/mo
- Expected delta
- +$701/yr (+$58/mo · 247.5%)
ⓘ Screening estimate from a state-policy table — verify with the county assessor before closing.
Climate risk First Street
- Flood 3/10 Moderate FEMA zone X (unshaded) · 17% chance over 30 yrs
- Wildfire 8/10 Severe
- Heat 7/10 Severe 7 d/yr ≥99°F today · 20 d/yr by 30 yrs out
- Wind 1/10 Low
- Air quality 6/10 Major 9 unhealthy d/yr today · 13 by 30 yrs out
Nearby sold comps map
Loading sold comps map…
Walkable amenities ~0.75 mi
Loading nearby amenities…
Taxation est. · year 1
- Rental income
- $34,455
- − Mortgage interest
- −$7,254
- − Property taxes
- −$283
- − Insurance
- −$648
- − Repairs & maintenance
- −$2,756
- − Management
- −$2,756
- − Depreciation
- −$3,767
- Taxable income
- $16,990
- Est. tax owed @ 24.0%
- −$4,078
- After-tax cash flow
- $14,062/yr
For passive investors: Depreciation is non-cash, so a rental often shows a tax loss while cash-flowing — sheltering income. Rental losses are passive: they offset passive income freely, and up to $25,000/yr can offset ordinary (W-2) income if you actively participate and your MAGI is under $100k (phasing out to $0 by $150k); unused losses carry forward. On sale, claimed depreciation is recaptured at up to 25%, and gains may owe capital-gains tax (a 1031 exchange can defer both). Figures are a year-1 estimate at your 24.0% rate — not tax advice; consult a CPA.
Schools (NCES district)
- District
- William S. Hart Union High
- NCES district ID
- 0642510
- Math proficiency
- 52% ▬ 0.00%
- Reading proficiency
- 72% ▲ 1.00%
- Median HH income
- $95,844
- Composite
- 58.6/100
- National rank
- #2030
- State rank
- #155 of 1400 in CA
Livability — Santa Clarita
- Score
- 70/100
- State rank
- #229
- US rank
- #7378
Category grades
Schools grade is shown separately in the Schools card above.
Census & demographics
- Census place
- Santa Clarita, CA
- County
- Los Angeles County · 9,444,647 people
- City population
- 219,066
- Metro
- Los Angeles-Long Beach-Anaheim, CA
- Population (ZIP)
- 33,155
- Household income
- $115,364
- Rent vs Own
- Severe rent burden
- 784.0
Population outlook (Los Angeles County) Hauer SSP2
- Today (2025)
- 10,940,515 people
- By 2030
- 11,256,481 · +2.9%
- By 2040
- 11,729,929 · +7.2%
- By 2050
- 11,948,407 · +9.2%
- By 2075
- 11,818,114 · +8.0%
- By 2100
- 10,842,928 · -0.9%
Race, ethnicity, and origin ACS 2023
- Neighborhood character
- Diverse neighborhood (Simpson 0.64)
- Race & ethnicity
- Hispanic / Latino 49% White 34% Two or more races 21% Asian 6% Black 4% Native American 1%
- Hispanic origin (detail)
- Mexican 36%
- Common ancestry
- Romanian 1% Lithuanian 1% Scotch-Irish 1%
- Foreign-born
- 23% · Canada, Jamaica, South Korea
- Languages at home
- 54% English-only · Spanish 35% Other Indo-European 3% Tagalog/Filipino 2%
Political lean MEDSL · Los Angeles
- 2024 margin
- Solid D (+32.9) · D 64.8% · R 31.9% · Other 3.3%
- 2008→2024 swing
- -7.4pp toward R · 2008: 40.4pp · 2024: 32.9pp
- All cycles
- 2024: D+32.9 2020: D+44.2 2016: D+48.0 2012: D+40.0 2008: D+40.4
Not yet ingested
- Civics
- —
Market trends
- HPI YoY
- ▼ -703.16%
- Current HPI
- 360.9901
- Rent YoY
- ▲ 1.70%
- Metro
- Los Angeles-Long Beach-Anaheim, CA
- State GDP YoY
- ▲ 3.21%
- F500 in state
- 116
Industry mix (Fortune 500 HQ in CA)
| Industry | F500 HQs | Revenue |
|---|---|---|
| Technology | 27 | $1,492B |
|
||
| Financial Services | 3 | $174B |
|
||
| Retail | 3 | $44B |
|
||
| Insurance | 3 | $26B |
|
||
| Media / Entertainment | 2 | $115B |
|
||
| Pharmaceuticals / Biotech | 2 | $62B |
|
||
Price history
-0.3% since first listed3 events — show timeline
- 2026-04-11 Price Changed $129,500 CRMLS
- 2026-02-25 Price Changed $129,900 CRMLS
- 2026-02-24 Listed $129 CRMLS
Property tax history
+5.5%/yrLatest (2025): $283 · +5.5% YoY. Source: county tax records.
Cash-flow waterfall
monthlySold comps — $/sqft
last 12 mo · ≤1 miLoading sold comps…