7 Finch Dr · Longview, TX
Flood risk No data
- FEMA flood zone
- —
- Chance of flooding over 30 yrs
- %
- Est. flood insurance / yr
- —
Fire risk No data
- Est. fire insurance / yr
- —
Heat risk No data
- Hot days now (above °F)
- days/yr
- Hot days in 30 yrs
- days/yr
Wind risk No data
- Chance of severe wind over 30 yrs
- %
Air-quality risk No data
- Unhealthy air days now
- days/yr
- Unhealthy air days in 30 yrs
- days/yr
Risk factors via First Street. Map © Google.
Why this score? — see what drove the B- grade
The composite is a weighted blend of 9 inputs, each scored 0–100. Each bar is that input's sub-score; the figure is the points it added to the 100-point composite (weight × sub-score).
- Cash flow +26.2/30.0
- ARV discount +15.0/15.0
- DSCR +8.8/10.0
- 1% rule +7.0/10.0
- Schools +4.0/10.0
- Livability +3.7/5.0
- Rent growth +2.9/5.0
- Condition / age +2.5/5.0
- Appreciation +0.0/10.0
$130,000
🖨 Deal sheet 📄 Offer letter ✓ Due diligence
Listing remarks
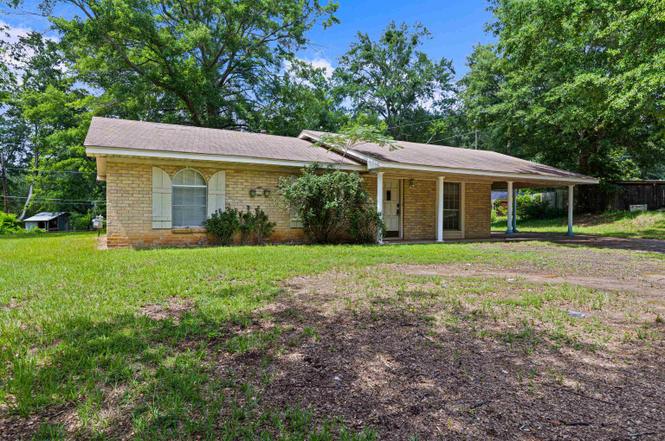
INVESTOR OPPORTUNITY!! This 3-bedroom, 2-bath home offers approximately 1,300 square feet of potential and is priced to sell at just $130,000! Situated on a large lot at the end of a quiet cul-de-sac, this property is conveniently located near Longview High School, shopping, dining, and other local amenities. This house presents an excellent opportunity for investors or buyers looking to renovate and create a great rental property or a family home of your own! Bring your vision and unlock the potential of this value-priced home!
Key facts
- Near dining
- Quiet cul-de-sac
- Near shopping
Tags
Neighborhood map
What this means for you Summary
Snapshot
- This is a 3-bed/2.0-bath single-family listed at $130k.
Deal economics
- At list price, monthly cash flow is $330 ($4k/yr) — positive.
- The deal already cash-flows at list — no discount required.
- Meets the 1% rule at list price ($2k rent vs $130k).
- Cap rate 9.3% vs local median 3.0% in Longview — top-decile yield for the area; either an underpriced asset or a hidden risk that comps aren't pricing in. Stress-test before assuming the spread holds.
Location & tenants
- Location reads 73/100 on livability (#213 in TX) — a middle-class / working-renter tenant base. Strengths: cost of living A+, housing A+, health & safety A+; Watch: employment C-, crime D+, schools D.
- Longview ISD (urban): math 49% / reading 46% proficiency, ranked #244 of 826 in TX (top 30%) — families likely to look elsewhere, expect single-tenant / working-renter base with shorter leases; 66% free/reduced lunch — lower-income household profile, screen leases tightly.
- Market conditions: Rents rising (+1.5%/yr); 310 active listings in the ZIP; 13 comparable units currently listed for rent nearby; rentals at typical pace (median 21d on market — plan ~3-4 weeks tenant-placement turnaround); 193 units permitted in Gregg County in 2024 (0 in 5+ unit buildings).
Forward outlook
- Local home prices are declining (-3.0%/yr); year-one equity from $899 of loan paydown is wiped out by about $4k of value loss. Plan a longer hold.
Negotiation context
- Only 1 days on market — expect competitive offers; lowballing is unlikely to land.
Questions for the listing agent
- Built in 1972 — when were the roof, HVAC, electrical panel, plumbing, and water heater last replaced?
- Is there a deadline driving the sale (1031 exchange, divorce, estate, relocation)? That informs how much negotiation room exists.
- Schools are D-rated, which usually means shorter tenancies and higher turnover. Who's the typical renter profile here, and what's been the actual vacancy rate?
- Crime grade is D in this area — have there been break-ins, vandalism, or insurance claims at this property in the last 3 years? What carrier currently insures it and at what premium?
- What's the average days-on-market for RENTAL listings here right now (not sales)? A rising rental-DOM trend means longer vacancies and softer asking-rent achievability than the comps imply.
- What's the recent tenant-quality profile in this submarket — average credit score on applications, eviction rate, late-payment / NSF rate, and stable-employment percentage? A property-management company in the area should have these aggregated.
- How much new for-sale + rental construction is in the pipeline within 1–3 miles? Heavy new supply typically softens prices + rents 12–24 months out; constrained supply supports both.
Investment metrics
- 1% rule
- 1.20% ✓
- Cap rate
- 9.34%
- Cash-on-cash
- 10.88%
- DSCR
- 1.48
- GRM
- 7.0
CMA / ARV
- ARV (on-the-fly)
- $161,625
- Comps found
- 1
Show comp detail 1 sale within ~0.75 mi
| Address | Dist | Beds/Ba | Sqft | Sold | Price | $/sf | Match |
|---|---|---|---|---|---|---|---|
| 203 Drake Blvd | 0.17mi | 3/2.0 | 1,275 (-1%) | 8mo | $160,000 | $125 | 83 |
Match score weights: distance 35% · size 25% · config 20% · recency 20%. Top-matched comps best support the ARV.
Projected returns pro-forma
-3.0% appreciation · 1.48% rent growth · sell at horizon
- IRR
- -1.7%
- Equity multiple
- 0.94×
- Total profit
- $-2,361
- Equity at exit
- $19,383
- IRR
- 6.2%
- Equity multiple
- 1.43×
- Total profit
- $15,787
- Equity at exit
- $11,240
Cash invested: $36,400 (down + closing). Projections, not guarantees.
Landlord ↔ Tenant lean methodology
- Overall (STATE)
- 87 Strongly Landlord-Friendly
- State Texas
- 87 Strongly Landlord-Friendly · R+5
- County
- — inherits STATE
- City
- — inherits STATE
ZIP-level market 75605
- Rents YoY
- 1.5%
- Active inventory
- 310
- Price-to-rent
- 7.0×
Monthly cashflow live
- Estimated rent
- $1,555 high interval (Pro) →
- Mortgage (P&I)
- −$682
- Tax est. 1.5%
- −$162 /mo · $1,950/yr
- Insurance
- −$54
- HOA
- −$0
- Vacancy / Maint / Mgmt
- −$327
- Net cashflow
- $330
Break-even live
UW: 25.0% down · 7.5% · 30yr · 1.5% tax · 5.0% vac · 8.0% maint · 8.0% mgmt
Financing live
Cash to close
- Down payment
- $32,500
- Closing costs
- $3,900
- Reserves months
- —
- Total cash needed
- —
Loan-product check · same deal, 3 products live
Conventional
25% down · 7.5% · 30yr
- Down + closing
- —
- Monthly P&I
- —
- Monthly cashflow
- —
- DSCR
- —
- Eligible?
- —
Personal DTI + credit; lowest rate.
DSCR
20% down · 8.5% · 30yr
- Down + closing
- —
- Monthly P&I
- —
- Monthly cashflow
- —
- DSCR
- —
- Eligible?
- —
No personal income docs; deal must DSCR.
Hard money
10% down · 12.0% · 12mo
- Down + closing
- —
- Monthly P&I
- —
- Monthly cashflow
- —
- DSCR
- —
- Eligible?
- —
Short-term bridge; refi at stabilization.
Rent comps 13 comps
| Address | Beds | Baths | Sqft | Rent | $/sqft | DOM | Units | Dist |
|---|---|---|---|---|---|---|---|---|
| 113 Magnolia Ln Longview, TX | 1.0–2.0 | 1.0–2.0 | 900 | $1,410 | $1.57 | 43d | 6 | 0.35mi |
| 616 City Ctr Way Longview, TX | 1.0–2.0 | 1.0–2.0 | 931 | $1,349 | $1.45 | 13d | 1 | 0.36mi |
| 311 Maplewood Cir Longview, TX | 3.0 | 2.0 | 1509 | $2,300 | $1.52 | 21d | 1 | 0.41mi |
| 616 Oak St Longview, TX | 3.0 | 2.0 | 1300 | $2,150 | $1.65 | 43d | 1 | 0.42mi |
| 2900 McCann Rd Longview, TX | 1.0–2.0 | 1.0–2.0 | 821 | $999 | $1.22 | 13d | 20 | 0.69mi |
| 3100 McCann Rd Longview, TX | 1.0–2.0 | 1.0–2.0 | 747 | $1,140 | $1.53 | 13d | 20 | 0.72mi |
| 303 Eden Dr Unit 313-37 Longview, TX | 2.0 | 1.0 | 950 | $895 | $0.94 | 21d | 1 | 0.93mi |
| 303 Eden Dr Unit 315-47 Longview, TX | 2.0 | 1.0 | 950 | $895 | $0.94 | 43d | 1 | 0.93mi |
| 336 Eden Dr Unit 350 Eden Longview, TX | 2.0 | 2.0 | 1261 | $1,200 | $0.95 | 21d | 1 | 1.01mi |
| 12 Serendipity Ln Longview, TX | 2.0 | 1.5 | 1200 | $1,295 | $1.08 | 21d | 1 | 1.01mi |
| 301 W Hawkins Pkwy Longview, TX | 1.0–2.0 | 1.0–2.0 | 691 | $2,200 | $3.18 | 13d | 5 | 1.05mi |
| 3623 McCann Rd Longview, TX | 1.0–3.0 | 1.0–2.0 | 990 | $2,500 | $2.52 | 13d | 7 | 1.12mi |
| 2501 N Eastman Rd Longview, TX | 1.0–3.0 | 1.0–2.0 | 1028 | $1,528 | $1.49 | 13d | 19 | 1.17mi |
Listing history 2 events
-
2026-06-19remarks 534-char remark
-
2026-06-19$130,000 Active 1 DOM
ⓘ Source: listings_history table (triggers on properties + properties_extension) + one-shot
backfill from property_details.listing_events for pre-trigger history.
Nearby sold comps map
Loading sold comps map…
Walkable amenities ~0.75 mi
Loading nearby amenities…
Taxation est. · year 1
- Rental income
- $18,661
- − Mortgage interest
- −$7,282
- − Property taxes
- −$1,950
- − Insurance
- −$650
- − Repairs & maintenance
- −$1,493
- − Management
- −$1,493
- − Depreciation
- −$3,782
- Taxable income
- $2,011
- Est. tax owed @ 24.0%
- −$483
- After-tax cash flow
- $3,478/yr
For passive investors: Depreciation is non-cash, so a rental often shows a tax loss while cash-flowing — sheltering income. Rental losses are passive: they offset passive income freely, and up to $25,000/yr can offset ordinary (W-2) income if you actively participate and your MAGI is under $100k (phasing out to $0 by $150k); unused losses carry forward. On sale, claimed depreciation is recaptured at up to 25%, and gains may owe capital-gains tax (a 1031 exchange can defer both). Figures are a year-1 estimate at your 24.0% rate — not tax advice; consult a CPA.
Schools (NCES district)
- District
- Longview ISD
- NCES district ID
- 4828110
- Math proficiency
- 49% ▼ -4.00%
- Reading proficiency
- 46% ▼ -1.00%
- Median HH income
- $39,837
- Composite
- 39.76/100
- National rank
- #3889
- State rank
- #244 of 826 in TX
Livability — Longview
- Score
- 73/100
- State rank
- #213
- US rank
- #5287
Category grades
Schools grade is shown separately in the Schools card above.
Census & demographics
- Census place
- Longview, TX
- County
- Gregg County · 128,826 people
- City population
- 103,792
- Metro
- Longview, TX
- Population (ZIP)
- 35,417
- Household income
- $73,190
- Rent vs Own
- Severe rent burden
- 1465.0
Population outlook (Gregg County) Hauer SSP2
- Today (2025)
- 125,947 people
- By 2030
- 126,542 · +0.5%
- By 2040
- 127,311 · +1.1%
- By 2050
- 127,289 · +1.1%
- By 2075
- 124,954 · -0.8%
- By 2100
- 113,737 · -9.7%
Race, ethnicity, and origin ACS 2023
- Neighborhood character
- Predominantly White (72%)
- Race & ethnicity
- White 72% Black 15% Hispanic / Latino 7% Two or more races 7% Asian 2%
- Hispanic origin (detail)
- Mexican 6%
- Common ancestry
- Italian 2% Slovak 2% Lithuanian 2%
- Foreign-born
- 5% · Canada
- Languages at home
- 92% English-only · Spanish 5% Other Indo-European 1% Vietnamese 1%
Political lean MEDSL · Gregg
- 2024 margin
- Solid R (+42.2) · D 28.5% · R 70.7%
- 2008→2024 swing
- -4.6pp toward R · 2008: -37.6pp · 2024: -42.2pp
- All cycles
- 2024: R+42.2 2020: R+36.9 2016: R+41.3 2012: R+39.5 2008: R+37.6
Not yet ingested
- Civics
- —
Market trends
- HPI YoY
- ▼ -199.48%
- Current HPI
- 227.957
- Rent YoY
- ▲ 1.48%
- Metro
- Longview, TX
- State GDP YoY
- ▲ 3.95%
- F500 in state
- 110
Industry mix (Fortune 500 HQ in TX)
| Industry | F500 HQs | Revenue |
|---|---|---|
| Energy | 16 | $1,198B |
|
||
| Technology | 5 | $198B |
|
||
| Engineering / Construction | 4 | $72B |
|
||
| Energy Services | 3 | $60B |
|
||
| Utilities | 3 | $41B |
|
||
| Healthcare | 2 | $330B |
|
||
Cash-flow waterfall
monthlySold comps — $/sqft
last 12 mo · ≤1 miLoading sold comps…