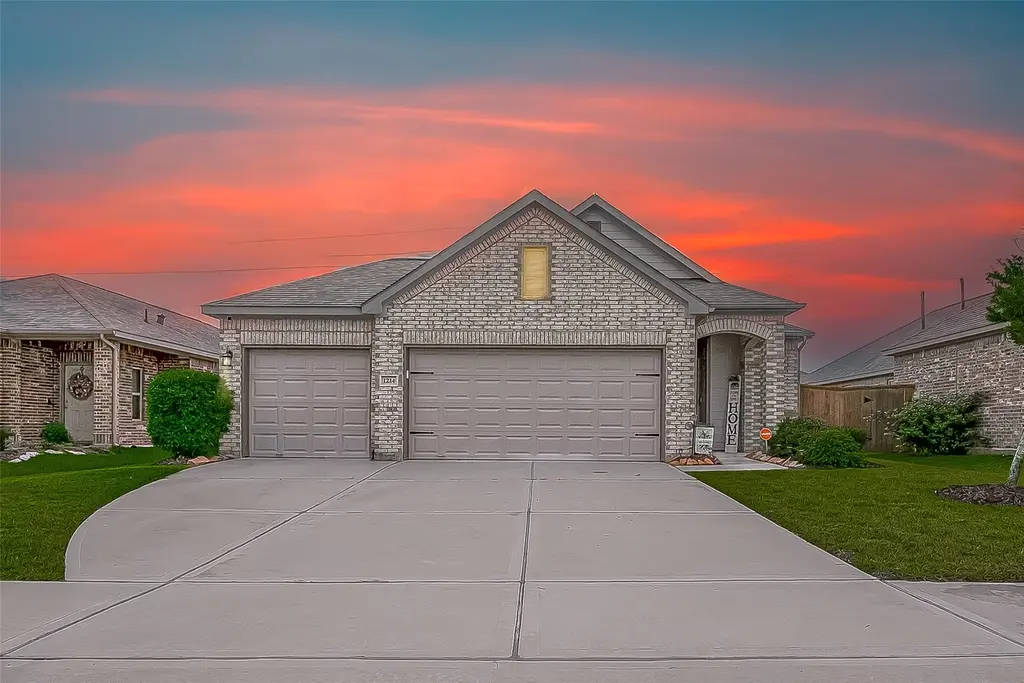
1214 Red Hills Dr · Iowa Colony, TX
Flood risk 1/10 · Minimal
- FEMA flood zone
- X (unshaded)
- Chance of flooding over 30 yrs
- 0.0%
- Est. flood insurance / yr
- $507 – $1,088
Fire risk 6/10 · Moderate
- Est. fire insurance / yr
- $1,222 – $2,270
Heat risk 9/10 · Severe
- Hot days now (above 110°F)
- 7 days/yr
- Hot days in 30 yrs
- 22 days/yr
Wind risk 9/10 · Severe
- Chance of severe wind over 30 yrs
- 99.0%
Air-quality risk 2/10 · Minimal
- Unhealthy air days now
- 1 days/yr
- Unhealthy air days in 30 yrs
- 2 days/yr
Risk factors via First Street. Map © Google.
Why this score? — see what drove the D- grade
The composite is a weighted blend of 9 inputs, each scored 0–100. Each bar is that input's sub-score; the figure is the points it added to the 100-point composite (weight × sub-score).
- ARV discount +9.8/15.0
- Cash flow +8.9/30.0
- 1% rule +5.0/10.0
- Condition / age +4.0/5.0
- Schools +3.9/10.0
- Livability +3.2/5.0
- Rent growth +2.6/5.0
- DSCR +2.5/10.0
- Appreciation +0.0/10.0
$279,000
🖨 Deal sheet 📄 Offer letter ✓ Due diligence
Listing remarks
Step into easy living in this 2020 built home, perfectly designed for comfort, functionality, & everyday ease. Nestled in a thriving, up & coming neighborhood, this home is move-in ready & waiting for its next chapter. Inside, you’ll love the bright, open-concept living, dining, & kitchen area, an inviting space ideal for hosting, relaxing, & staying connected. The split-bedroom layout gives the primary suite its own quiet retreat, complete with a spacious bedroom, private bath, & generous closet space. Two additional bedrooms & a full bath are tucked away behind the living room, offering privacy for guests or family. Outside, enjoy an extended pa
Key facts
- Split-bedroom layout
- Epoxy floor garage
- Generator plug
Tags
Property features AI
Finance
- HOA & community: Association (PMG) with annual fee of $1,000; Association amenities include clubhouse, fitness center, playground, pickleball, and pool; Association fee covers clubhouse and recreation facilities; Community features include community pool and curbs
Exterior
- Parking: Attached garage with 3 parking spaces
- Security: Smoke detectors
- Utilities: Public water; Public sewer; Concrete road access
- Home design: Residential property; Single-story (first-floor living); Slab foundation; Composition roof
- Construction: Built in 2020; Brick and cement siding construction
- Exterior features: Covered patio; Patio; Deck; Fenced backyard; Subdivision lot
Interior
- Kitchen: Dishwasher; Disposal; Gas range; Microwave
- Bedrooms: Primary bedroom on the first floor (approx. 14x15); Bedroom on the first floor (approx. 11x13); Bedroom on the first floor (approx. 12x13)
- Flooring: Carpet; Plank; Tile; Vinyl
- Bathrooms: 2 full bathrooms
- Heating & cooling: Central heating (gas); Central air (electric)
- Interior features: Double vanity; Granite counters; Kitchen island; Kitchen/family room combo; Pantry; Tub/shower; Window treatments; Ceiling fans; Kitchen/dining combo; Window coverings
- Laundry & utility: Washer hookup; Electric dryer hookup; Gas dryer hookup
Neighborhood map
What this means for you Summary
Snapshot
- This is a 3-bed/2.0-bath single-family listed at $279k. Condition is rated good.
Deal economics
- At list price, monthly cash flow is $-226 ($-3k/yr) — negative.
- To cash-flow at today's rent, offer at most $239k (14.3% below list).
- To meet the 1% rule (rent ≥ 1% of price), the offer needs to be $278k (0.3% below list).
- Recommended offer: $239k (14.3% below list) — sets the bar for cash-flow.
- Cap rate 5.3% vs local median 4.2% in Iowa Colony — meaningfully above typical; check what's discounted (condition, days-on-market, listing class) to confirm the premium yield is real.
Location & tenants
- Location reads 64/100 on livability (#757 in TX) — a middle-class / working-renter tenant base. Strengths: crime A+, employment A+, cost of living A+; Watch: amenities F, commute F, health & safety F.
- Alvin ISD (suburban): math 39% / reading 48% proficiency, ranked #255 of 826 in TX (top 31%) — families likely to look elsewhere, expect single-tenant / working-renter base with shorter leases.
- Zoned schools: Iowa Colony H S (792 students, 56% FRL).
- Market conditions: Rents flat; 1139 active listings in the ZIP; 17 comparable units currently listed for rent nearby; rentals leasing fast (median 13d on market — plan ~1-2 weeks tenant-placement turnaround); high-income renter base; 3,960 units permitted in Brazoria County in 2024 (593 in 5+ unit buildings).
Forward outlook
- Local home prices are declining (-3.0%/yr); year-one equity from $2k of loan paydown is wiped out by about $8k of value loss. Plan a longer hold.
- Brazoria County population projected at +44% by 2050 — long-run rental-demand tailwind backs the buy-and-hold thesis.
Negotiation context
- It's been on market 20 days — a 2% lower offer ($275k) is reasonable based on typical stale-listing flexibility.
- 17 sale attempts since 6y ago with the ask held roughly flat each time — persistent listings suggest the price (not the market) is what's stuck; bring a comps-based counter.
Risks & watch-outs
- Watch-outs: property tax is 3.3% of price.
- Climate carrying-cost: severe wind risk, 99% chance of damaging wind over 30y; major wildfire risk; extreme-heat days projected 7→22/yr by 2055 (HVAC capex compounding) — expect insurance premiums to compound above CPI over the hold.
Questions for the listing agent
- What do current leases actually rent for vs. the listed asking? Can we see a recent rent roll and the last 12 months of T-12 income?
- Property tax is high relative to price — has the assessment been appealed recently, and will the sale trigger a re-assessment?
- What does the HOA fee cover, when was the last increase, and are there any pending special assessments or reserve-fund shortfalls?
- Is there a deadline driving the sale (1031 exchange, divorce, estate, relocation)? That informs how much negotiation room exists.
- Schools are F-rated, which usually means shorter tenancies and higher turnover. Who's the typical renter profile here, and what's been the actual vacancy rate?
- The area grade is low — what's the realistic commute time and amenity access for the typical tenant pool here? Any planned neighborhood developments (good or bad) we should know about?
- What's the average days-on-market for RENTAL listings here right now (not sales)? A rising rental-DOM trend means longer vacancies and softer asking-rent achievability than the comps imply.
- What's the recent tenant-quality profile in this submarket — average credit score on applications, eviction rate, late-payment / NSF rate, and stable-employment percentage? A property-management company in the area should have these aggregated.
- How much new for-sale + rental construction is in the pipeline within 1–3 miles? Heavy new supply typically softens prices + rents 12–24 months out; constrained supply supports both.
Investment metrics
- 1% rule
- 1.00% ✗
- Cap rate
- 5.32%
- Cash-on-cash
- -3.47%
- DSCR
- 0.85
- GRM
- 8.4
CMA / ARV
- ARV (median comp)
- $294,189
- List price
- $279,000
- Delta
- -5.16%
- Verdict
- FAIR
- Comps
- 20 within 1.0 mi
Show comp detail 12 sales within ~0.75 mi
| Address | Dist | Beds/Ba | Sqft | Sold | Price | $/sf | Match |
|---|---|---|---|---|---|---|---|
| 1333 Red Hills Dr | 0.17mi | 3/3.0 | 1,790 (+4%) | 4mo | $295,900 | $165 | 78 |
| 10510 Watershed Dr | 0.29mi | 3/2.0 | 1,641 (-5%) | 1mo | $258,000 | $157 | 77 |
| 1213 Red Hills Dr | 0.03mi | 4/2.0 (+1) | 1,582 (-8%) | 3mo | $299,900 | $190 | 77 |
| 1614 Diamond Mountain Dr | 0.51mi | 3/2.0 | 1,710 (-1%) | 1mo | $265,000 | $155 | 73 |
| 10410 Russell Pines Dr | 0.37mi | 3/2.0 | 1,631 (-6%) | 4mo | $254,000 | $156 | 70 |
| 10430 Sherwin Pass Dr | 0.20mi | 4/3.0 (+1) | 1,924 (+11%) | 3mo | $279,900 | $145 | 61 |
| 1202 Paradise Found Dr | 0.56mi | 3/2.0 | 1,581 (-8%) | 1mo | $265,000 | $168 | 59 |
| 1814 Homewood Point Ln | 0.72mi | 3/2.0 | 1,635 (-5%) | 3mo | $319,990 | $196 | 55 |
| 10518 Sutter Creek Dr | 0.73mi | 3/2.0 | 1,852 (+7%) | 3mo | $354,900 | $192 | 52 |
| 10618 Sutter Creek Dr | 0.72mi | 3/2.0 | 1,872 (+8%) | 2mo | $408,900 | $218 | 51 |
| 9915 Garnet Grove Dr | 0.62mi | 4/2.0 (+1) | 1,879 (+9%) | 3mo | $254,000 | $135 | 49 |
| 4311 Eagle Pass Dr | 0.51mi | 4/2.0 (+1) | 1,941 (+12%) | 4mo | $354,990 | $183 | 47 |
Match score weights: distance 35% · size 25% · config 20% · recency 20%. Top-matched comps best support the ARV.
Projected returns pro-forma
-3.0% appreciation · 0.44% rent growth · sell at horizon
- IRR
- -25.7%
- Equity multiple
- 0.15×
- Total profit
- $-66,221
- Equity at exit
- $41,600
- IRR
- -37.3%
- Equity multiple
- -0.31×
- Total profit
- $-102,004
- Equity at exit
- $24,123
Cash invested: $78,120 (down + closing). Projections, not guarantees.
Landlord ↔ Tenant lean methodology
- Overall (STATE)
- 87 Strongly Landlord-Friendly
- State Texas
- 87 Strongly Landlord-Friendly · R+5
- County
- — inherits STATE
- City
- — inherits STATE
ZIP-level market 77583
- Rents YoY
- 0.4%
- Active inventory
- 1139
- Price-to-rent
- 8.4×
Monthly cashflow live
- Estimated rent
- $2,783 high interval (Pro) →
- Mortgage (P&I)
- −$1,463
- Tax from tax record
- −$762 /mo · $9,140/yr
- Insurance
- −$116
- HOA
- −$83
- Vacancy / Maint / Mgmt
- −$584
- Net cashflow
- $-226
Break-even live
UW: 25.0% down · 7.5% · 30yr · 1.5% tax · 5.0% vac · 8.0% maint · 8.0% mgmt
Financing live
Cash to close
- Down payment
- $69,750
- Closing costs
- $8,370
- Reserves months
- —
- Total cash needed
- —
Loan-product check · same deal, 3 products live
Conventional
25% down · 7.5% · 30yr
- Down + closing
- —
- Monthly P&I
- —
- Monthly cashflow
- —
- DSCR
- —
- Eligible?
- —
Personal DTI + credit; lowest rate.
DSCR
20% down · 8.5% · 30yr
- Down + closing
- —
- Monthly P&I
- —
- Monthly cashflow
- —
- DSCR
- —
- Eligible?
- —
No personal income docs; deal must DSCR.
Hard money
10% down · 12.0% · 12mo
- Down + closing
- —
- Monthly P&I
- —
- Monthly cashflow
- —
- DSCR
- —
- Eligible?
- —
Short-term bridge; refi at stabilization.
Rent comps 17 comps
| Address | Beds | Baths | Sqft | Rent | $/sqft | DOM | Units | Dist |
|---|---|---|---|---|---|---|---|---|
| 10502 Moon Valley Ln Rosharon, TX | 3.0 | 2.0 | 1615 | $2,725 | $1.69 | 1d | 1 | 0.09mi |
| 10507 Moon Valley Ln Rosharon, TX | 3.0 | 2.0 | 1548 | $2,650 | $1.71 | 1d | 1 | 0.11mi |
| 10538 Wildflower View Dr Rosharon, TX | 3.0 | 2.0 | 1522 | $2,775 | $1.82 | 1d | 1 | 0.16mi |
| 10602 Wildflower View Dr Rosharon, TX | 4.0 | 2.0 | 1596 | $2,850 | $1.79 | 20d | 1 | 0.18mi |
| 10610 Cascade Creek Dr Rosharon, TX | 3.0 | 2.0 | 1548 | $2,700 | $1.74 | 43d | 1 | 0.19mi |
| 10622 Cascade Creek Dr Rosharon, TX | 4.0 | 2.0 | 1780 | $2,775 | $1.56 | 43d | 1 | 0.19mi |
| 10630 Cascade Creek Dr Rosharon, TX | 3.0 | 2.5 | 1940 | $2,875 | $1.48 | 2d | 1 | 0.21mi |
| 1234 Scarlet Creek Dr Rosharon, TX | 3.0 | 2.0 | 1548 | $2,650 | $1.71 | 1d | 1 | 0.23mi |
| 10714 Cliffs View Dr Iowa Colony, TX | 4.0 | 3.5 | 2070 | $2,700 | $1.30 | 43d | 1 | 0.30mi |
| 1403 Cascade Hills Dr Rosharon, TX | 4.0 | 3.0 | 2067 | $3,450 | $1.67 | 7d | 1 | 0.40mi |
| 10313 Malta Trace Dr Rosharon, TX | 4.0 | 2.0 | 1802 | $2,545 | $1.41 | 43d | 1 | 0.73mi |
| 1816 Corsica Creek Ln Rosharon, TX | 3.0–4.0 | 2.0–2.5 | 1653 | $2,306 | $1.40 | 1d | 21 | 0.84mi |
| 1123 Diamond Drape Dr Rosharon, TX | 4.0 | 2.0 | 1844 | $2,000 | $1.08 | 12d | 1 | 0.95mi |
| 9423 Grand Spark Dr Rosharon, TX | 3.0 | 3.0 | 1999 | $2,600 | $1.30 | 43d | 1 | 1.00mi |
| 10211 Alpine Lake Ln Rosharon, TX | 3.0–4.0 | 2.0–2.5 | 1731 | $2,700 | $1.56 | 1d | 6 | 1.20mi |
| 10211 Alpine Lake Ln Rosharon, TX | 3.0–4.0 | 2.0–2.5 | 1731 | $2,469 | $1.43 | 43d | 7 | 1.20mi |
| 9518 Peridot Green Dr Rosharon, TX | 4.0 | 2.0 | 1593 | $1,886 | $1.18 | 22d | 1 | 1.45mi |
HOA detail
- Monthly dues
- $83 · $996/yr
Listing history 50 events
-
2026-06-18days on market $279,000 Pending 20 DOM
-
2026-06-17days on market $279,000 Pending 19 DOM
-
2026-06-16days on market $279,000 Pending 18 DOM
-
2026-06-15days on market $279,000 Pending 17 DOM
-
2026-06-13days on market $279,000 Pending 15 DOM
-
2026-06-13statusdays on market $279,000 Pending 14 DOM
-
2026-06-09days on market $279,000 Active 11 DOM
-
2026-06-08days on market $279,000 Active 10 DOM
-
2026-06-07days on market $279,000 Active 9 DOM
-
2026-06-04days on market $279,000 Active 6 DOM
-
2026-06-03days on market $279,000 Active 5 DOM
-
2026-06-02days on market $279,000 Active 4 DOM
-
2026-06-01days on market $279,000 Active 3 DOM
-
2026-05-31days on market $279,000 Active 2 DOM
-
2026-04-15status Active
-
2026-04-15historical
-
2026-04-15$279,000 Active 1042-char remark
-
2026-04-03status Pending
-
2026-03-27status Pending
-
2026-02-23$279,000 Active
-
2026-02-23historical
-
2026-01-06$285,000 Active
-
2026-01-06historical
-
2025-12-04$285,000 Active
-
2025-12-04historical
-
2025-10-08historical
-
2025-10-08$285,000 Active
-
2025-09-15$285,000 Active
-
2025-09-15historical
-
2025-07-07$290,000 Active
-
2025-07-07historical
-
2025-06-04$299,000 Active
-
2021-01-26soldstatus Sold
-
2020-12-27status Pending
-
2020-12-09$227,990 Active
-
2020-12-08historical
-
2020-11-28price $227,990
-
2020-10-27$225,990 Active
-
2020-10-26historical
-
2020-09-05$225,990 Active
-
2020-09-04historical
-
2020-08-17price $225,990
-
2020-07-15$223,990 Active
-
2020-07-14historical
-
2020-07-02status Active
-
2020-06-29status Pending
-
2020-06-19price $223,990
-
2020-05-15$221,990 Active
-
2020-05-14historical
-
2020-03-22$221,990 Active
ⓘ Source: listings_history table (triggers on properties + properties_extension) + one-shot
backfill from property_details.listing_events for pre-trigger history.
Tax reassessment forecast TX · Resets to sale price
- Current annual tax
- $9,140 · $762/mo
- Projected year-2 tax
- $9,140 · $762/mo
- Expected delta
- $0/yr ($0/mo · 0.0%)
ⓘ Screening estimate from a state-policy table — verify with the county assessor before closing.
Climate risk First Street
- Flood 1/10 Low FEMA zone X (unshaded) · 0% chance over 30 yrs
- Wildfire 6/10 Major
- Heat 9/10 Extreme 7 d/yr ≥110°F today · 22 d/yr by 30 yrs out
- Wind 9/10 Extreme 99% chance of damaging wind over 30 yrs
- Air quality 2/10 Low 1 unhealthy d/yr today · 2 by 30 yrs out
Nearby sold comps map
Loading sold comps map…
Walkable amenities ~0.75 mi
Loading nearby amenities…
Taxation est. · year 1
- Rental income
- $33,394
- − Mortgage interest
- −$15,628
- − Property taxes
- −$9,140
- − Insurance
- −$1,395
- − Repairs & maintenance
- −$2,671
- − Management
- −$2,671
- − HOA
- −$996
- − Depreciation
- −$8,116
- Taxable loss
- −$7,225
- Est. tax savings @ 24.0%
- +$1,734
- After-tax cash flow
- $-973/yr
For passive investors: Depreciation is non-cash, so a rental often shows a tax loss while cash-flowing — sheltering income. Rental losses are passive: they offset passive income freely, and up to $25,000/yr can offset ordinary (W-2) income if you actively participate and your MAGI is under $100k (phasing out to $0 by $150k); unused losses carry forward. On sale, claimed depreciation is recaptured at up to 25%, and gains may owe capital-gains tax (a 1031 exchange can defer both). Figures are a year-1 estimate at your 24.0% rate — not tax advice; consult a CPA.
Condition & rehab AI · 12 photos
This 2020-built home is move-in ready and in good condition, with a good condition score of 80. It offers a good investment opportunity with potential for value-add improvements.
Value-add opportunities
- Both landscaping improvements — enhances curb appeal and adds value
- Both painting exterior — refreshes the home's appearance and adds value
- Resale upgrading kitchen appliances — modernizes the kitchen and appeals to buyers
- Resale upgrading bathrooms — modernizes the bathrooms and appeals to buyers
Renovation cost estimate screening
Value-add ROI direction
- Both landscaping improvements — enhances curb appeal and adds value ↑
- Both painting exterior — refreshes the home's appearance and adds value ↑
- Resale upgrading kitchen appliances — modernizes the kitchen and appeals to buyers ↑
- Resale upgrading bathrooms — modernizes the bathrooms and appeals to buyers ↑
ⓘ Cost ranges are severity-bucket heuristics (US national rule-of-thumb). Get contractor quotes + a written scope before underwriting a rehab budget.
Schools (NCES district)
- District
- Alvin ISD
- NCES district ID
- 4808090
- Math proficiency
- 39% ▼ -11.00%
- Reading proficiency
- 48% ▬ 0.00%
- Median HH income
- $66,740
- Composite
- 38.96/100
- National rank
- #4080
- State rank
- #255 of 826 in TX
Livability — Iowa Colony
- Score
- 64/100
- State rank
- #757
- US rank
- #13904
Category grades
Schools grade is shown separately in the Schools card above.
Census & demographics
- County
- Brazoria County · 374,982 people
- City population
- 52,747
- Metro
- Houston-The Woodlands-Sugar Land, TX
- Population (ZIP)
- 52,747
- Household income
- $119,287
- Rent vs Own
- Severe rent burden
- 251.0
Population outlook (Brazoria County) Hauer SSP2
- Today (2025)
- 420,414 people
- By 2030
- 457,585 · +8.8%
- By 2040
- 532,232 · +26.6%
- By 2050
- 605,399 · +44.0%
- By 2075
- 779,358 · +85.4%
- By 2100
- 883,759 · +110.2%
Race, ethnicity, and origin ACS 2023
- Neighborhood character
- Highly diverse neighborhood (Simpson 0.70)
- Race & ethnicity
- Hispanic / Latino 38% Black 34% White 20% Two or more races 18% Asian 5%
- Hispanic origin (detail)
- Mexican 31% Puerto Rican 2%
- Common ancestry
- Lithuanian 1% Slovak 1% Romanian 1%
- Foreign-born
- 16% · Canada, Vietnam, China
- Languages at home
- 64% English-only · Spanish 28% Other Asian/Pacific 2% Vietnamese 1%
Political lean MEDSL · Brazoria
- 2024 margin
- R (+19.7) · D 39.5% · R 59.2% · Other 1.3%
- 2008→2024 swing
- +9.9pp toward D · 2008: -29.6pp · 2024: -19.7pp
- All cycles
- 2024: R+19.7 2020: R+18.2 2016: R+24.6 2012: R+34.2 2008: R+29.6
Not yet ingested
- Civics
- —
Market trends
- HPI YoY
- ▼ -120.19%
- Current HPI
- 198.6559
- Rent YoY
- ▲ 0.44%
- Metro
- Houston-The Woodlands-Sugar Land, TX
- State GDP YoY
- ▲ 3.95%
- F500 in state
- 110
Industry mix (Fortune 500 HQ in TX)
| Industry | F500 HQs | Revenue |
|---|---|---|
| Energy | 16 | $1,198B |
|
||
| Technology | 5 | $198B |
|
||
| Engineering / Construction | 4 | $72B |
|
||
| Energy Services | 3 | $60B |
|
||
| Utilities | 3 | $41B |
|
||
| Healthcare | 2 | $330B |
|
||
Price history
+25.7% since first listed39 events — show timeline
- 2026-06-10 Pending — HARMLS
- 2026-05-29 Listing Removed — HARMLS
- 2026-05-29 Listed $279,000 HARMLS
- 2026-04-15 Relisted — HARMLS
- 2026-04-15 Listing Removed — HARMLS
- 2026-04-15 Listed $279,000 HARMLS
- 2026-04-03 Pending — HARMLS
- 2026-03-27 Pending — HARMLS
- 2026-02-23 Listing Removed — HARMLS
- 2026-02-23 Listed $279,000 HARMLS
- 2026-01-06 Listing Removed — HARMLS
- 2026-01-06 Listed $285,000 HARMLS
- 2025-12-04 Listing Removed — HARMLS
- 2025-12-04 Listed $285,000 HARMLS
- 2025-10-08 Listing Removed — HARMLS
- 2025-10-08 Listed $285,000 HARMLS
- 2025-09-15 Listing Removed — HARMLS
- 2025-09-15 Listed $285,000 HARMLS
- 2025-07-07 Listing Removed — HARMLS
- 2025-07-07 Listed $290,000 HARMLS
- 2025-06-04 Listed $299,000 HARMLS
- 2021-01-26 Sold (MLS) — HARMLS
- 2020-12-27 Pending — HARMLS
- 2020-12-09 Listed $227,990 HARMLS
- 2020-12-08 Listing Removed — HARMLS
- 2020-11-28 Price Changed $227,990 HARMLS
- 2020-10-27 Listed $225,990 HARMLS
- 2020-10-26 Listing Removed — HARMLS
- 2020-09-05 Listed $225,990 HARMLS
- 2020-09-04 Listing Removed — HARMLS
- 2020-08-17 Price Changed $225,990 HARMLS
- 2020-07-15 Listed $223,990 HARMLS
- 2020-07-14 Listing Removed — HARMLS
- 2020-07-02 Relisted — HARMLS
- 2020-06-29 Pending — HARMLS
- 2020-06-19 Price Changed $223,990 HARMLS
- 2020-05-15 Listed $221,990 HARMLS
- 2020-05-14 Listing Removed — HARMLS
- 2020-03-22 Listed $221,990 HARMLS
Property tax history
+90.1%/yrLatest (2025): $9,140 · -0.1% YoY. Source: county tax records.
Cash-flow waterfall
monthlySold comps — $/sqft
last 12 mo · ≤1 miLoading sold comps…