44021 Fairview Ln · St. Louis, OK
Flood risk 1/10 · Minimal
- FEMA flood zone
- X (unshaded)
- Chance of flooding over 30 yrs
- 0.0%
- Est. flood insurance / yr
- $473 – $860
Fire risk 7/10 · Major
- Est. fire insurance / yr
- $2,463 – $4,575
Heat risk 5/10 · Moderate
- Hot days now (above 110°F)
- 7 days/yr
- Hot days in 30 yrs
- 18 days/yr
Wind risk 3/10 · Minor
- Chance of severe wind over 30 yrs
- 6.0%
Air-quality risk 2/10 · Minimal
- Unhealthy air days now
- 1 days/yr
- Unhealthy air days in 30 yrs
- 1 days/yr
Risk factors via First Street. Map © Google.
Why this score? — see what drove the C- grade
The composite is a weighted blend of 9 inputs, each scored 0–100. Each bar is that input's sub-score; the figure is the points it added to the 100-point composite (weight × sub-score).
- Cash flow +17.8/30.0
- ARV discount +7.5/15.0
- Appreciation +6.2/10.0
- DSCR +5.6/10.0
- 1% rule +4.8/10.0
- Condition / age +3.8/5.0
- Rent growth +2.5/5.0
- Livability +2.5/5.0
- Schools +1.4/10.0
$85,000
🖨 Deal sheet 📄 Offer letter ✓ Due diligence
Listing remarks MLS
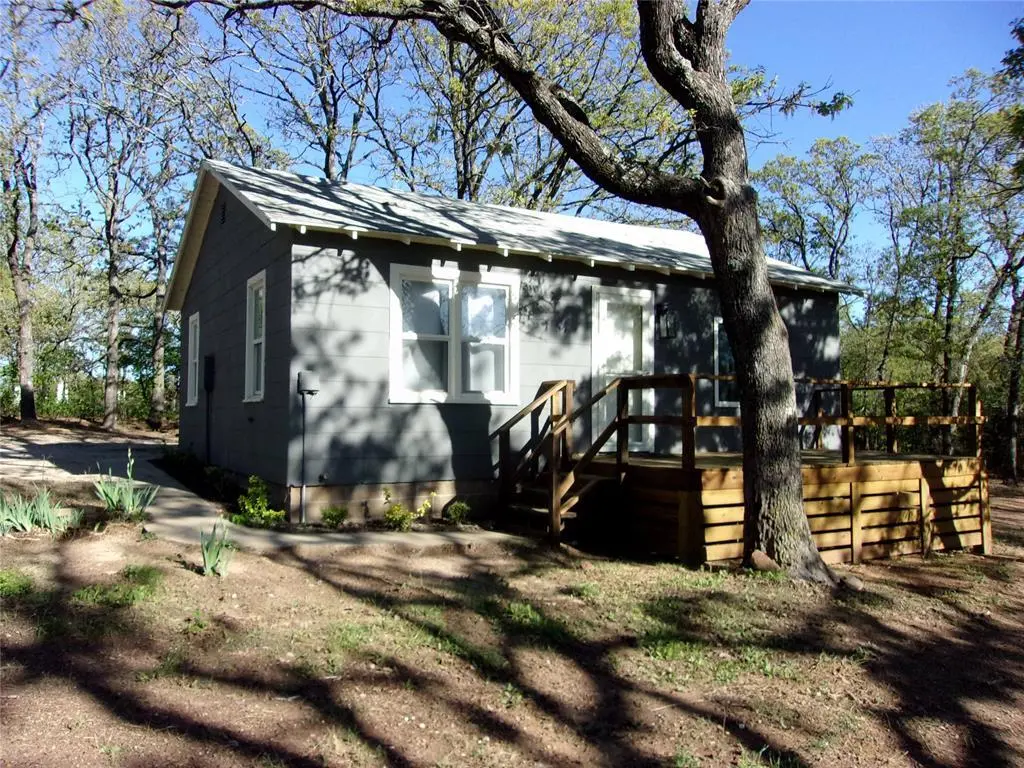
Celestial conversion. Converted church makes a great new home. Beautiful original hardwood floors. New Elec, PEX plumbing, Pella windows. Large pantry & Laundry. Roughed in 4th bed. Full basement would add approx 1600 Sq Ft. Addl. well on property. A work in progress! Addl. 2 bd, 1 ba. 672 Sq Ft home w/ deck & patio. All on 1 Acre.
Key facts
- New heat pump
- New flooring
- New paint
Tags
Property features AI
Finance
- Other: Homestead not claimed; Livestock allowed (per listing)
- Financial info: Listing available for Cash or Conventional financing; Not assumable
- HOA & community: No mandatory association dues
Exterior
- Utilities: Electricity available; Rural water; Septic tank
- Home design: Single family residence; One level; Residential property; Existing condition
- Construction: Frame construction; Composition roof; Conventional foundation; Built from plans (living area source: plans)
- Exterior features: Corner lot; Creek on property; Rural setting; Open deck
Interior
- Kitchen: Free‑standing electric range/oven; Microwave; Refrigerator; Water heater
- Bedrooms: 2 bedrooms
- Flooring: Carpet; Laminate
- Bathrooms: 1 full bathroom
- Heating & cooling: Electric heating
- Interior features: Window treatments; Open deck
- Laundry & utility: Septic tank (on-site wastewater system)
Neighborhood map
What this means for you Summary
Snapshot
- This is a 2-bed/1.0-bath single-family listed at $85k. Condition is rated good.
Deal economics
- At list price, monthly cash flow is $70 ($837/yr) — positive.
- The deal already cash-flows at list — no discount required.
- To meet the 1% rule (rent ≥ 1% of price), the offer needs to be $83k (2.1% below list).
- Recommended offer: $80k (6.0% below list) — sets the bar for market timing.
Location & tenants
- Location reads: area grade C — affects rentability + tenant quality, not the cash-flow math above.
- Maud (rural): math 10% / reading 15% proficiency, ranked #483 of 513 in OK (top 94%) — low school quality limits family demand, transient renter base, plan for 1-2y turnover; 73% free/reduced lunch — lower-income household profile, screen leases tightly.
- Zoned schools: Maud Es (math 8% / reading 8%, grade F, #741 of 845 statewide, top 89%, 187 students, 0% FRL); Maud Hs (math 10% / reading 10%, grade F, #361 of 447 statewide, top 94%, 83 students, 0% FRL) — zoned schools average 0% FRL vs 73% district-wide (73 pts lower); this property's tenant base skews higher-income than the district average.
- Market conditions: 15 active listings in the ZIP; 183 units permitted in Pottawatomie County in 2024 (16 in 5+ unit buildings).
Forward outlook
- In year one you build about $3k of equity ($588 loan paydown + $2k appreciation (2.5% local appreciation)).
- Pottawatomie County population projected at +12% by 2050 — modest demand growth; plan on rents tracking national, not racing it.
- At projected returns (2.5% appreciation + 3.0% rent growth), your $24k cash investment doubles in ~6 years — after that, you're playing with house money.
Negotiation context
- It's been on market 68 days — a 6% lower offer ($80k) is reasonable based on typical stale-listing flexibility.
- 4 sale attempts since 13y ago; this cycle's ask has dropped $20k (19%) from the opening price — seller is motivated, your offer sets the floor, not the list.
- Current owner paid $58k; 48% above their basis — modest negotiation headroom, anchor on the comps not their cost.
Risks & watch-outs
- Climate carrying-cost: major wildfire risk; extreme-heat days projected 7→18/yr by 2055 (HVAC capex compounding) — expect insurance premiums to compound above CPI over the hold.
Questions for the listing agent
- It's been on market 68 days. Have you received any prior offers? Is the seller open to a 6% concession, seller financing, or rate buy-down credit?
- Built in 1960 — when were the roof, HVAC, electrical panel, plumbing, and water heater last replaced?
- Why hasn't it sold? Are there any deal-killer items the seller is aware of (foundation, flood, title, zoning, code violations)?
- Is there a deadline driving the sale (1031 exchange, divorce, estate, relocation)? That informs how much negotiation room exists.
- What's the average days-on-market for RENTAL listings here right now (not sales)? A rising rental-DOM trend means longer vacancies and softer asking-rent achievability than the comps imply.
- What's the recent tenant-quality profile in this submarket — average credit score on applications, eviction rate, late-payment / NSF rate, and stable-employment percentage? A property-management company in the area should have these aggregated.
- How much new for-sale + rental construction is in the pipeline within 1–3 miles? Heavy new supply typically softens prices + rents 12–24 months out; constrained supply supports both.
Investment metrics
- 1% rule
- 0.98% ✗
- Cap rate
- 7.28%
- Cash-on-cash
- 3.52%
- DSCR
- 1.16
- GRM
- 8.5
CMA / ARV
No comps found within radius.
Projected returns pro-forma
2.45% appreciation · 3.0% rent growth · sell at horizon
- IRR
- 9.3%
- Equity multiple
- 1.52×
- Total profit
- $12,266
- Equity at exit
- $35,637
- IRR
- 12.1%
- Equity multiple
- 2.70×
- Total profit
- $40,560
- Equity at exit
- $52,992
Cash invested: $23,800 (down + closing). Projections, not guarantees.
Landlord ↔ Tenant lean methodology
- Overall (STATE)
- 83 Strongly Landlord-Friendly
- State Oklahoma
- 83 Strongly Landlord-Friendly · R+20
- County
- — inherits STATE
- City
- — inherits STATE
ZIP-level market 74854
- Home prices YoY
- 0.8%
- Active inventory
- 15
- Price-to-rent
- 8.5×
Monthly cashflow live
- Estimated rent
- $832 medium interval (Pro) →
- Mortgage (P&I)
- −$446
- Tax est. 1.5%
- −$106 /mo · $1,275/yr
- Insurance
- −$35
- HOA
- −$0
- Vacancy / Maint / Mgmt
- −$175
- Net cashflow
- $70
Break-even live
UW: 25.0% down · 7.5% · 30yr · 1.5% tax · 5.0% vac · 8.0% maint · 8.0% mgmt
Financing live
Cash to close
- Down payment
- $21,250
- Closing costs
- $2,550
- Reserves months
- —
- Total cash needed
- —
Loan-product check · same deal, 3 products live
Conventional
25% down · 7.5% · 30yr
- Down + closing
- —
- Monthly P&I
- —
- Monthly cashflow
- —
- DSCR
- —
- Eligible?
- —
Personal DTI + credit; lowest rate.
DSCR
20% down · 8.5% · 30yr
- Down + closing
- —
- Monthly P&I
- —
- Monthly cashflow
- —
- DSCR
- —
- Eligible?
- —
No personal income docs; deal must DSCR.
Hard money
10% down · 12.0% · 12mo
- Down + closing
- —
- Monthly P&I
- —
- Monthly cashflow
- —
- DSCR
- —
- Eligible?
- —
Short-term bridge; refi at stabilization.
Listing history 11 events
-
2026-06-18days on market $85,000 Active 68 DOM
-
2026-06-17days on market $85,000 Active 67 DOM
-
2026-06-16days on market $85,000 Active 66 DOM
-
2026-06-15days on market $85,000 Active 65 DOM
-
2026-06-13days on market $85,000 Active 63 DOM
-
2026-06-12days on market $85,000 Active 62 DOM
-
2026-06-09days on market $85,000 Active 59 DOM
-
2026-06-08days on market $85,000 Active 58 DOM
-
2026-06-08days on market $85,000 Active 57 DOM
-
2026-06-05remarks 529-char remark
-
2026-06-05$85,000 Active 55 DOM
ⓘ Source: listings_history table (triggers on properties + properties_extension) + one-shot
backfill from property_details.listing_events for pre-trigger history.
Climate risk First Street
- Flood 1/10 Low FEMA zone X (unshaded) · 0% chance over 30 yrs
- Wildfire 7/10 Severe
- Heat 5/10 Major 7 d/yr ≥110°F today · 18 d/yr by 30 yrs out
- Wind 3/10 Moderate 6% chance of damaging wind over 30 yrs
- Air quality 2/10 Low 1 unhealthy d/yr today · 1 by 30 yrs out
Nearby sold comps map
Loading sold comps map…
Walkable amenities ~0.75 mi
Loading nearby amenities…
Taxation est. · year 1
- Rental income
- $9,982
- − Mortgage interest
- −$4,761
- − Property taxes
- −$1,275
- − Insurance
- −$425
- − Repairs & maintenance
- −$799
- − Management
- −$799
- − Depreciation
- −$2,473
- Taxable loss
- −$549
- Est. tax savings @ 24.0%
- +$132
- After-tax cash flow
- $969/yr
For passive investors: Depreciation is non-cash, so a rental often shows a tax loss while cash-flowing — sheltering income. Rental losses are passive: they offset passive income freely, and up to $25,000/yr can offset ordinary (W-2) income if you actively participate and your MAGI is under $100k (phasing out to $0 by $150k); unused losses carry forward. On sale, claimed depreciation is recaptured at up to 25%, and gains may owe capital-gains tax (a 1031 exchange can defer both). Figures are a year-1 estimate at your 24.0% rate — not tax advice; consult a CPA.
Condition & rehab AI · 12 photos
This charming remodeled home on a beautiful acre is in good condition with new siding, roof, and interior finishes. It has a good curb appeal and is ready for a new owner or tenant.
Value-add opportunities
- Resale Paint exterior siding and roof — Enhances curb appeal and property value.
- Rental Install new outdoor lighting — Improves safety and attractiveness for tenants.
Renovation cost estimate screening
Value-add ROI direction
- Resale Paint exterior siding and roof — Enhances curb appeal and property value. ↑
- Rental Install new outdoor lighting — Improves safety and attractiveness for tenants. ↑
ⓘ Cost ranges are severity-bucket heuristics (US national rule-of-thumb). Get contractor quotes + a written scope before underwriting a rehab budget.
Schools (NCES district)
- District
- Maud
- NCES district ID
- 4019290
- Math proficiency
- 10% ▼ -5.00%
- Reading proficiency
- 15% ▼ -5.00%
- Median HH income
- $40,416
- Composite
- 14.32/100
- National rank
- #14429
- State rank
- #483 of 513 in OK
Livability — St. Louis
No livability data for this city. (Only ~50 U.S. cities are tracked.)
Census & demographics
- City population
- 62
- Population (ZIP)
- 1,833
Population outlook (Pottawatomie County) Hauer SSP2
- Today (2025)
- 76,622 people
- By 2030
- 78,816 · +2.9%
- By 2040
- 82,766 · +8.0%
- By 2050
- 86,031 · +12.3%
- By 2075
- 93,316 · +21.8%
- By 2100
- 95,820 · +25.1%
Race, ethnicity, and origin ACS 2023
- Neighborhood character
- Predominantly White (71%)
- Race & ethnicity
- White 71% Native American 16% Two or more races 10% Hispanic / Latino 8%
- Hispanic origin (detail)
- Mexican 6%
- Common ancestry
- Slovak 2% Scottish 1% Lithuanian 1%
- Foreign-born
- 2% · Canada
- Languages at home
- 98% English-only · Spanish 1%
Political lean MEDSL · Pottawatomie
- 2024 margin
- Solid R (+47.4) · D 25.2% · R 72.7% · Other 2.1%
- 2008→2024 swing
- -9.1pp toward R · 2008: -38.4pp · 2024: -47.4pp
- All cycles
- 2024: R+47.4 2020: R+46.0 2016: R+46.5 2012: R+38.7 2008: R+38.4
Not yet ingested
- Civics
- —
Market trends
- HPI YoY
- ▲ 2.45%
- Current HPI
- 290.0965
- Rent YoY
- —
- Metro
- —
- State GDP YoY
- ▲ 1.55%
- F500 in state
- 6
Industry mix (Fortune 500 HQ in OK)
| Industry | F500 HQs | Revenue |
|---|---|---|
| Energy | 3 | $48B |
|
||
Price history
+962.5% since first listed8 events — show timeline
- 2026-06-04 Price Changed $85,000 MLSOK
- 2026-06-04 Relisted — MLSOK
- 2026-06-02 Pending — MLSOK
- 2026-04-09 Listed $105,000 MLSOK
- 2013-07-15 Listing Removed — MLSOK
- 2013-04-30 Sold (MLS) $57,500 MLSOK
- 2013-01-14 Listed $55,000 MLSOK
- 2013-01-14 Listed $8,000 MLSOK
Cash-flow waterfall
monthlySold comps — $/sqft
last 12 mo · ≤1 miLoading sold comps…