 🏗️ New Construction
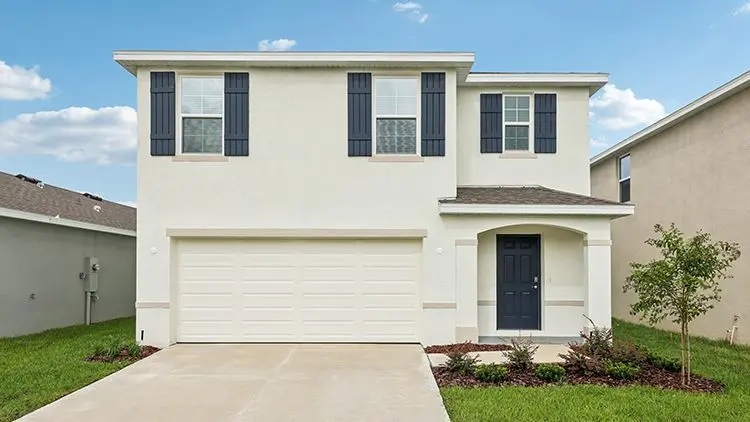
Robie Plan · Ocala, FL
Flood risk No data
- FEMA flood zone
- —
- Chance of flooding over 30 yrs
- —
- Est. flood insurance / yr
- —
Fire risk No data
- Est. fire insurance / yr
- —
Heat risk No data
- Hot days now (above threshold)
- —
- Hot days in 30 yrs
- —
Wind risk No data
- Chance of severe wind over 30 yrs
- —
Air-quality risk No data
- Unhealthy air days now
- —
- Unhealthy air days in 30 yrs
- —
Risk factors via First Street. Map © Google.
Why this score? — see what drove the F grade
The composite is a weighted blend of 9 inputs, each scored 0–100. Each bar is that input's sub-score; the figure is the points it added to the 100-point composite (weight × sub-score).
- ARV discount +7.5/15.0
- Cash flow +5.4/30.0
- Condition / age +4.0/5.0
- Schools +3.6/10.0
- Livability +3.5/5.0
- Rent growth +2.5/5.0
- 1% rule +1.0/10.0
- DSCR +0.0/10.0
- Appreciation +0.0/10.0
$331,990
🖨 Deal sheet 📄 Offer letter ✓ Due diligence
Listing remarks MLS
Welcome to the epitome of modern living in this two-story, five-bedroom home with an open-concept layout. The Robie is featured in Tartan Farms at Winding Oaks in Ocala, Florida. As you enter the home, you're greeted by the foyer leading you into the heart of the home. The kitchen overlooks the dining area and great room leading outside to the patio. Well-equipped with stainless-steel appliances, the kitchen has a large central island with quartz countertops, quality cabinetry, and a large walk-in pantry. Just off the living room you'll find a downstairs bedroom and full bathroom. Upstairs you're greeted with a spacious loft customizable for work or play. The Owner's Suite is located nearby and features a spacious walk-in closet as well as an ensuite bathroom with a double vanity, quartz countertops, and two walk-in closets. Three additional bedrooms share a second upstairs bathroom and linen closet for extra storage. Your laundry room is conveniently located upstairs as well as extra storage closets. This home offers a perfect blend of shared living spaces and private retreats. Like all homes in Tartan Farms at Winding Oaks, the Robie includes a state-of-the-art smart home system that keeps you connected to your home at all times, whether you're 5-minutes or a plan ride away. Contact us today and find your new home in Tartan Farms at Winding Oaks.
Key facts
- Quartz countertops
- Large central island
- Large walk-in pantry
Tags
Neighborhood map
What this means for you Summary
Snapshot
- This is a 5-bed/3.0-bath single-family listed at $332k. Condition is rated good.
Deal economics
- At list price, monthly cash flow is $-915 ($-11k/yr) — negative.
- To cash-flow at today's rent, offer at most $291k (12.2% below list).
- To meet the 1% rule (rent ≥ 1% of price), the offer needs to be $255k (23.2% below list).
- Recommended offer: $255k (23.2% below list) — sets the bar for 1% rule.
Location & tenants
- Location reads 69/100 on livability (#476 in FL) — a middle-class / working-renter tenant base. Strengths: cost of living A+, housing A+, health & safety A+; Watch: crime F, amenities F, commute F.
- Marion (rural): math 42% / reading 43% proficiency, ranked #61 of 73 in FL (top 84%) — families likely to look elsewhere, expect single-tenant / working-renter base with shorter leases; 61% free/reduced lunch — lower-income household profile, screen leases tightly.
- Market conditions: Rents flat; 295 active listings in the ZIP; 15 comparable units currently listed for rent nearby; rentals at typical pace (median 21d on market — plan ~3-4 weeks tenant-placement turnaround); 7,071 units permitted in Marion County in 2024 (534 in 5+ unit buildings).
- At $2,549/mo this rent would consume 47% of the median local household income ($65k/yr) (locally 1062% of renters already pay >50% of income on rent) — very limited rent-growth headroom before tenants either downsize or default.
Forward outlook
- Local home prices are declining (-3.0%/yr); year-one equity from $3k of loan paydown is wiped out by about $13k of value loss. Plan a longer hold.
- Marion County population projected at +13% by 2050 — modest demand growth; plan on rents tracking national, not racing it.
Negotiation context
- It's been on market 117 days — a 9% lower offer ($302k) is reasonable based on typical stale-listing flexibility.
Questions for the listing agent
- What do current leases actually rent for vs. the listed asking? Can we see a recent rent roll and the last 12 months of T-12 income?
- It's been on market 117 days. Have you received any prior offers? Is the seller open to a 23% concession, seller financing, or rate buy-down credit?
- Why hasn't it sold? Are there any deal-killer items the seller is aware of (foundation, flood, title, zoning, code violations)?
- Is there a deadline driving the sale (1031 exchange, divorce, estate, relocation)? That informs how much negotiation room exists.
- Crime grade is F in this area — have there been break-ins, vandalism, or insurance claims at this property in the last 3 years? What carrier currently insures it and at what premium?
- The area grade is low — what's the realistic commute time and amenity access for the typical tenant pool here? Any planned neighborhood developments (good or bad) we should know about?
- What's the average days-on-market for RENTAL listings here right now (not sales)? A rising rental-DOM trend means longer vacancies and softer asking-rent achievability than the comps imply.
- What's the recent tenant-quality profile in this submarket — average credit score on applications, eviction rate, late-payment / NSF rate, and stable-employment percentage? A property-management company in the area should have these aggregated.
- How much new for-sale + rental construction is in the pipeline within 1–3 miles? Heavy new supply typically softens prices + rents 12–24 months out; constrained supply supports both.
Investment metrics
- 1% rule
- 0.60% ✗
- Cap rate
- 3.70%
- Cash-on-cash
- -9.26%
- DSCR
- 0.59
- GRM
- 13.9
CMA / ARV
- ARV (median comp)
- $423,840
- List price
- $331,990
- Delta
- -21.67%
- Verdict
- UNDERPRICED
- Comps
- 19 within 1.0 mi
Show comp detail 1 sale within ~0.75 mi
| Address | Dist | Beds/Ba | Sqft | Sold | Price | $/sf | Match |
|---|---|---|---|---|---|---|---|
| 4743 SW 62nd Pl | 0.61mi | 4/3.0 (-1) | 2,226 (-9%) | 10mo | $425,000 | $191 | 43 |
Match score weights: distance 35% · size 25% · config 20% · recency 20%. Top-matched comps best support the ARV.
Projected returns pro-forma
-3.0% appreciation · 0.12% rent growth · sell at horizon
- IRR
- -36.0%
- Equity multiple
- -0.13×
- Total profit
- $-134,122
- Equity at exit
- $63,196
- IRR
- -71.2%
- Equity multiple
- -0.85×
- Total profit
- $-219,519
- Equity at exit
- $36,646
Cash invested: $118,675 (down + closing). Projections, not guarantees.
Landlord ↔ Tenant lean methodology
- Overall (STATE)
- 87 Strongly Landlord-Friendly
- State Florida
- 87 Strongly Landlord-Friendly · R+3
- County
- — inherits STATE
- City
- — inherits STATE
ZIP-level market 34474
- Home prices YoY
- -28.4%
- Rents YoY
- 0.1%
- Active inventory
- 295
- Price-to-rent
- 10.9×
Monthly cashflow live
- Estimated rent
- $2,549 high interval (Pro) →
- Mortgage (P&I)
- −$2,223
- Tax est. 1.5%
- −$530 /mo · $6,358/yr
- Insurance
- −$177
- HOA
- −$0
- Vacancy / Maint / Mgmt
- −$535
- Net cashflow
- $-915
Break-even live
UW: 25.0% down · 7.5% · 30yr · 1.5% tax · 5.0% vac · 8.0% maint · 8.0% mgmt
Financing live
Cash to close
- Down payment
- $105,960
- Closing costs
- $12,715
- Reserves months
- —
- Total cash needed
- —
Loan-product check · same deal, 3 products live
Conventional
25% down · 7.5% · 30yr
- Down + closing
- —
- Monthly P&I
- —
- Monthly cashflow
- —
- DSCR
- —
- Eligible?
- —
Personal DTI + credit; lowest rate.
DSCR
20% down · 8.5% · 30yr
- Down + closing
- —
- Monthly P&I
- —
- Monthly cashflow
- —
- DSCR
- —
- Eligible?
- —
No personal income docs; deal must DSCR.
Hard money
10% down · 12.0% · 12mo
- Down + closing
- —
- Monthly P&I
- —
- Monthly cashflow
- —
- DSCR
- —
- Eligible?
- —
Short-term bridge; refi at stabilization.
Rent comps 15 comps
| Address | Beds | Baths | Sqft | Rent | $/sqft | DOM | Units | Dist |
|---|---|---|---|---|---|---|---|---|
| 4552 SW 65th Pl Ocala, FL | 4.0 | 3.0 | 2344 | $2,200 | $0.94 | 21d | 1 | 0.34mi |
| 4261 SW 62nd Loop Ocala, FL | 4.0 | 3.0 | 2550 | $2,300 | $0.90 | 21d | 1 | 0.43mi |
| 4987 SW 63rd Loop Ocala, FL | 4.0 | 3.0 | 2251 | $3,850 | $1.71 | 21d | 1 | 0.63mi |
| 4940 SW 63rd Loop Ocala, FL | 4.0 | 3.0 | 2342 | $2,500 | $1.07 | 21d | 1 | 0.70mi |
| 5432 SW 49th Ave Ocala, FL | 4.0 | 3.0 | 2886 | $2,500 | $0.87 | 21d | 1 | 0.90mi |
| 4251 SW 53rd Lane Rd Ocala, FL | 5.0 | 3.0 | 2605 | $2,700 | $1.04 | 21d | 1 | 1.07mi |
| 4015 SW 54th Street Rd Ocala, FL | 4.0 | 2.5 | 2045 | $2,500 | $1.22 | 13d | 1 | 1.11mi |
| 8584 SW 43rd Ter Ocala, FL | 5.0 | 3.0 | 2370 | $2,495 | $1.05 | 13d | 1 | 1.34mi |
| 8584 SW 43rd Ter Ocala, FL | 5.0 | 3.0 | 2370 | $2,495 | $1.05 | 13d | 1 | 1.34mi |
| 4703 SW 85th Pl Ocala, FL | 4.0 | 2.0 | 1828 | $2,500 | $1.37 | 13d | 1 | 1.35mi |
| 8602 SW 43rd Ter Ocala, FL | 4.0 | 2.5 | 2176 | $2,195 | $1.01 | 13d | 1 | 1.37mi |
| 8602 SW 43rd Ter Ocala, FL | 4.0 | 2.5 | 2176 | $2,195 | $1.01 | 13d | 1 | 1.37mi |
| 8677 SW 44th Ct Ocala, FL | 5.0 | 3.0 | 2370 | $2,495 | $1.05 | 21d | 1 | 1.46mi |
| 8704 SW 44th Ct Ocala, FL | 4.0 | 2.5 | 2176 | $2,195 | $1.01 | 21d | 1 | 1.49mi |
| 8704 SW 44th Ct Ocala, FL | 4.0 | 2.5 | 2176 | $2,195 | $1.01 | 13d | 1 | 1.49mi |
Listing history 15 events
-
2026-06-18days on market $331,990 Active 117 DOM
-
2026-06-17days on market $331,990 Active 116 DOM
-
2026-06-16days on market $331,990 Active 115 DOM
-
2026-06-15days on market $331,990 Active 114 DOM
-
2026-06-14days on market $331,990 Active 112 DOM
-
2026-06-13days on market $331,990 Active 111 DOM
-
2026-06-10days on market $331,990 Active 109 DOM
-
2026-06-09days on market $331,990 Active 108 DOM
-
2026-06-08days on market $331,990 Active 107 DOM
-
2026-06-07days on market $331,990 Active 106 DOM
-
2026-06-03days on market $331,990 Active 102 DOM
-
2026-06-02days on market $331,990 Active 101 DOM
-
2026-05-31days on market $331,990 Active 99 DOM
-
2026-05-30days on market $331,990 Active 98 DOM
-
2026-02-21$331,990 Active 1370-char remark
Show marketing remark (1370 chars)
Welcome to the epitome of modern living in this two-story, five-bedroom home with an open-concept layout. The Robie is featured in Tartan Farms at Winding Oaks in Ocala, Florida. As you enter the home, you're greeted by the foyer leading you into the heart of the home. The kitchen overlooks the dining area and great room leading outside to the patio. Well-equipped with stainless-steel appliances, the kitchen has a large central island with quartz countertops, quality cabinetry, and a large walk-in pantry. Just off the living room you'll find a downstairs bedroom and full bathroom. Upstairs you're greeted with a spacious loft customizable for work or play. The Owner's Suite is located nearby and features a spacious walk-in closet as well as an ensuite bathroom with a double vanity, quartz countertops, and two walk-in closets. Three additional bedrooms share a second upstairs bathroom and linen closet for extra storage. Your laundry room is conveniently located upstairs as well as extra storage closets. This home offers a perfect blend of shared living spaces and private retreats. Like all homes in Tartan Farms at Winding Oaks, the Robie includes a state-of-the-art smart home system that keeps you connected to your home at all times, whether you're 5-minutes or a plan ride away. Contact us today and find your new home in Tartan Farms at Winding Oaks.
ⓘ Source: listings_history table (triggers on properties + properties_extension) + one-shot
backfill from property_details.listing_events for pre-trigger history.
Nearby sold comps map
Loading sold comps map…
Walkable amenities ~0.75 mi
Loading nearby amenities…
Taxation est. · year 1
- Rental income
- $30,588
- − Mortgage interest
- −$23,742
- − Property taxes
- −$6,358
- − Insurance
- −$2,119
- − Repairs & maintenance
- −$2,447
- − Management
- −$2,447
- − Depreciation
- −$12,330
- Taxable loss
- −$18,855
- Est. tax savings @ 24.0%
- +$4,525
- After-tax cash flow
- $-6,459/yr
For passive investors: Depreciation is non-cash, so a rental often shows a tax loss while cash-flowing — sheltering income. Rental losses are passive: they offset passive income freely, and up to $25,000/yr can offset ordinary (W-2) income if you actively participate and your MAGI is under $100k (phasing out to $0 by $150k); unused losses carry forward. On sale, claimed depreciation is recaptured at up to 25%, and gains may owe capital-gains tax (a 1031 exchange can defer both). Figures are a year-1 estimate at your 24.0% rate — not tax advice; consult a CPA.
Condition & rehab AI · 3 photos
This two-story home in Ocala, Florida, is in excellent condition with a good condition score of 80. It features a modern open-concept layout, stainless steel appliances, and hardwood floors. The home is move-in ready with minimal repairs needed.
Value-add opportunities
- Both Paint exterior — Enhances curb appeal and resale value
- Both Replace flooring in dining area — Improves aesthetics and adds value
- Both Install smart home features — Enhances convenience and marketability
Renovation cost estimate screening
Value-add ROI direction
- Both Paint exterior — Enhances curb appeal and resale value ↑
- Both Replace flooring in dining area — Improves aesthetics and adds value ↑
- Both Install smart home features — Enhances convenience and marketability ↑
ⓘ Cost ranges are severity-bucket heuristics (US national rule-of-thumb). Get contractor quotes + a written scope before underwriting a rehab budget.
Schools (NCES district)
- District
- Marion
- NCES district ID
- 1201260
- Math proficiency
- 42% ▼ -7.00%
- Reading proficiency
- 43% ▼ -4.00%
- Median HH income
- $40,015
- Composite
- 35.61/100
- National rank
- #4890
- State rank
- #61 of 73 in FL
Livability — Ocala
- Score
- 69/100
- State rank
- #476
- US rank
- #8461
Category grades
Schools grade is shown separately in the Schools card above.
Census & demographics
- Census place
- Ocala, FL
- County
- Marion County · 315,796 people
- City population
- 263,375
- Metro
- Ocala, FL
- Population (ZIP)
- 20,258
- Household income
- $65,291
- Rent vs Own
- Severe rent burden
- 1062.0
Population outlook (Marion County) Hauer SSP2
- Today (2025)
- 365,905 people
- By 2030
- 376,768 · +3.0%
- By 2040
- 396,555 · +8.4%
- By 2050
- 412,723 · +12.8%
- By 2075
- 446,090 · +21.9%
- By 2100
- 436,193 · +19.2%
Race, ethnicity, and origin ACS 2023
- Neighborhood character
- Diverse neighborhood (Simpson 0.64)
- Race & ethnicity
- White 52% Hispanic / Latino 25% Black 13% Two or more races 8% Asian 8%
- Hispanic origin (detail)
- Mexican 2% Puerto Rican 10%
- Common ancestry
- Lithuanian 2% Romanian 2% Slovak 1%
- Foreign-born
- 21% · Canada, Jamaica, Vietnam
- Languages at home
- 71% English-only · Spanish 22% Other Indo-European 4% Vietnamese 1%
Political lean MEDSL · Marion
- 2024 margin
- Solid R (+31.6) · D 33.8% · R 65.5%
- 2008→2024 swing
- -20.0pp toward R · 2008: -11.6pp · 2024: -31.6pp
- All cycles
- 2024: R+31.6 2020: R+25.9 2016: R+26.2 2012: R+16.2 2008: R+11.6
Not yet ingested
- Civics
- —
Market trends
- HPI YoY
- ▼ -78.16%
- Current HPI
- 196.5607
- Rent YoY
- ▲ 0.12%
- Metro
- Ocala, FL
- State GDP YoY
- ▲ 3.28%
- F500 in state
- 36
Industry mix (Fortune 500 HQ in FL)
| Industry | F500 HQs | Revenue |
|---|---|---|
| Industrial Technology | 2 | $29B |
|
||
| Insurance | 2 | $17B |
|
||
| Retail | 1 | $60B |
|
||
| Technology Distribution | 1 | $58B |
|
||
| Homebuilding | 1 | $35B |
|
||
| Technology Manufacturing | 1 | $35B |
|
||
Price history
1 event — show timeline
- 2026-02-21 Listed $331,990 Zillow
Cash-flow waterfall
monthlySold comps — $/sqft
last 12 mo · ≤1 miLoading sold comps…