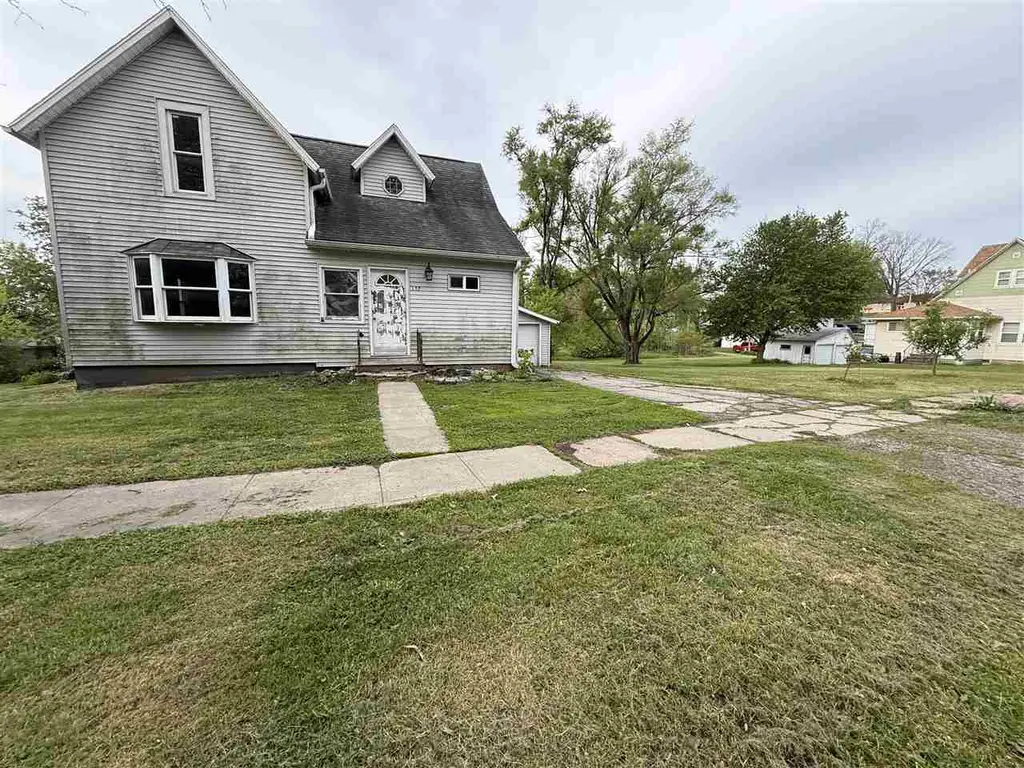
127 W Clark St · North English, IA
Flood risk 1/10 · Minimal
- FEMA flood zone
- X (unshaded)
- Chance of flooding over 30 yrs
- 0.0%
- Est. flood insurance / yr
- $473 – $860
Fire risk 4/10 · Minor
- Est. fire insurance / yr
- $902 – $1,676
Heat risk 3/10 · Minor
- Hot days now (above 105°F)
- 7 days/yr
- Hot days in 30 yrs
- 15 days/yr
Wind risk 2/10 · Minimal
- Chance of severe wind over 30 yrs
- —
Air-quality risk 2/10 · Minimal
- Unhealthy air days now
- 1 days/yr
- Unhealthy air days in 30 yrs
- 1 days/yr
Risk factors via First Street. Map © Google.
Why this score? — see what drove the A grade
The composite is a weighted blend of 9 inputs, each scored 0–100. Each bar is that input's sub-score; the figure is the points it added to the 100-point composite (weight × sub-score).
- Cash flow +30.0/30.0
- ARV discount +15.0/15.0
- DSCR +10.0/10.0
- 1% rule +9.7/10.0
- Appreciation +8.2/10.0
- Schools +5.7/10.0
- Livability +3.5/5.0
- Rent growth +2.5/5.0
- Condition / age +2.5/5.0
$80,000
🖨 Deal sheet 📄 Offer letter ✓ Due diligence
Listing remarks
Located in North English, this 3-bedroom, 1-bath home offers a great opportunity for buyers looking to add their own personal touches. The property will need some repairs and updates, making it a great option for someone wanting to build equity over time. Features include a detached 2-stall garage, fenced-in backyard, and the added bonus of a second lot for extra outdoor space or future possibilities. Conveniently located close to downtown and the elementary school, this property offers small-town living with plenty of potential.
Key facts
- Second lot
- Fenced-in backyard
- Close to downtown
Tags
Property features AI
Finance
- Other:
- Financial info:
- HOA & community: Association fee paid annually
Exterior
- Parking: Attached garage; Off-street parking; On-street parking; 2 total parking spaces
- Security:
- Utilities: Public water; Public sewer
- Home design: Single-family residence; 2 stories
- Construction: Vinyl siding and frame construction
- Exterior features: Garden; Fenced yard
Interior
- Kitchen: Refrigerator
- Bedrooms:
- Flooring:
- Bathrooms: 1 full bathroom
- Heating & cooling: Forced air heating (natural gas); Central air conditioning
- Interior features: Skylight(s); Other
- Laundry & utility: Main level laundry room
Neighborhood map
What this means for you Summary
Snapshot
- This is a 3-bed/1.0-bath single-family listed at $80k.
Deal economics
- At list price, monthly cash flow is $363 ($4k/yr) — positive.
- The deal already cash-flows at list — no discount required.
- Meets the 1% rule at list price ($1k rent vs $80k).
- Recommended offer: $78k (3.0% below list) — sets the bar for market timing.
Location & tenants
- Location reads 69/100 on livability (#398 in IA) — a middle-class / working-renter tenant base. Strengths: cost of living A+, housing A+, health & safety A+; Watch: employment D+, amenities F, commute F.
- English Valleys Community School District (rural): math 63% / reading 71% proficiency, ranked #177 of 289 in IA (top 61%) — acceptable for families but not a draw, mixed tenant base, ~2y average lease.
- Market conditions: 9 active listings in the ZIP; 12 units permitted in Iowa County in 2024 (0 in 5+ unit buildings).
Forward outlook
- In year one you build about $6k of equity ($553 loan paydown + $5k appreciation (6.4% local appreciation)).
- Iowa County population projected to shrink 6% by 2050 — rents likely to lag national; underwrite the cash flow, not the appreciation.
- At projected returns (6.4% appreciation + 3.0% rent growth), your $22k cash investment doubles in ~3 years — after that, you're playing with house money.
- By year 6, paydown + projected appreciation supports a ~$31k cash-out refi (75% LTV) — recoverable capital for the next deal without selling this one.
Negotiation context
- It's been on market 31 days — a 3% lower offer ($78k) is reasonable based on typical stale-listing flexibility.
Risks & watch-outs
- Watch-outs: built in 1905 — expect roof / HVAC / electrical / plumbing capex.
Questions for the listing agent
- It's been on market 31 days. Have you received any prior offers? Is the seller open to a 3% concession, seller financing, or rate buy-down credit?
- Built in 1905 — when were the roof, HVAC, electrical panel, plumbing, and water heater last replaced?
- Is there a deadline driving the sale (1031 exchange, divorce, estate, relocation)? That informs how much negotiation room exists.
- Schools are B-rated — typically a magnet for longer-tenancy family renters. What's the average tenant stay here, and is there a school-zone premium baked into asking?
- What's the average days-on-market for RENTAL listings here right now (not sales)? A rising rental-DOM trend means longer vacancies and softer asking-rent achievability than the comps imply.
- What's the recent tenant-quality profile in this submarket — average credit score on applications, eviction rate, late-payment / NSF rate, and stable-employment percentage? A property-management company in the area should have these aggregated.
- How much new for-sale + rental construction is in the pipeline within 1–3 miles? Heavy new supply typically softens prices + rents 12–24 months out; constrained supply supports both.
Investment metrics
- 1% rule
- 1.47% ✓
- Cap rate
- 11.74%
- Cash-on-cash
- 19.44%
- DSCR
- 1.87
- GRM
- 5.7
CMA / ARV
- ARV (on-the-fly)
- $136,300
- Comps found
- 7
Show comp detail 7 sales within ~0.75 mi
| Address | Dist | Beds/Ba | Sqft | Sold | Price | $/sf | Match |
|---|---|---|---|---|---|---|---|
| 309 W Clark St | 0.17mi | 3/1.0 | 1,369 (-6%) | 10mo | $87,500 | $64 | 74 |
| 119 E Clark St | 0.11mi | 3/1.5 | 1,536 (+6%) | 24mo | $138,000 | $90 | 63 |
| 114 S West St | 0.33mi | 2/2.0 (-1) | 1,404 (-3%) | 14mo | $135,000 | $96 | 59 |
| 412 W Clark St | 0.22mi | 3/1.0 | 1,240 (-14%) | 11mo | $164,900 | $133 | 57 |
| 231 N Navajo Ln | 0.47mi | 3/2.0 | 1,356 (-6%) | 10mo | $192,000 | $142 | 55 |
| 213 N Boland Ave | 0.26mi | 3/2.5 | 1,620 (+12%) | 16mo | $115,000 | $71 | 49 |
| 226 N Howard St | 0.27mi | 3/2.0 | 1,644 (+13%) | 17mo | $154,000 | $94 | 47 |
Match score weights: distance 35% · size 25% · config 20% · recency 20%. Top-matched comps best support the ARV.
Projected returns pro-forma
6.42% appreciation · 3.0% rent growth · sell at horizon
- IRR
- 32.4%
- Equity multiple
- 3.15×
- Total profit
- $48,246
- Equity at exit
- $52,425
- IRR
- 29.9%
- Equity multiple
- 6.51×
- Total profit
- $123,384
- Equity at exit
- $96,970
Cash invested: $22,400 (down + closing). Projections, not guarantees.
Landlord ↔ Tenant lean methodology
- Overall (STATE)
- 83 Strongly Landlord-Friendly
- State Iowa
- 83 Strongly Landlord-Friendly · R+6
- County
- — inherits STATE
- City
- — inherits STATE
ZIP-level market 52316
- Home prices YoY
- 3.4%
- Active inventory
- 9
- Price-to-rent
- 5.7×
Monthly cashflow live
- Estimated rent
- $1,176 medium interval (Pro) →
- Mortgage (P&I)
- −$420
- Tax from tax record
- −$113 /mo · $1,354/yr
- Insurance
- −$33
- HOA
- −$0
- Vacancy / Maint / Mgmt
- −$247
- Net cashflow
- $363
Break-even live
UW: 25.0% down · 7.5% · 30yr · 1.5% tax · 5.0% vac · 8.0% maint · 8.0% mgmt
Financing live
Cash to close
- Down payment
- $20,000
- Closing costs
- $2,400
- Reserves months
- —
- Total cash needed
- —
Loan-product check · same deal, 3 products live
Conventional
25% down · 7.5% · 30yr
- Down + closing
- —
- Monthly P&I
- —
- Monthly cashflow
- —
- DSCR
- —
- Eligible?
- —
Personal DTI + credit; lowest rate.
DSCR
20% down · 8.5% · 30yr
- Down + closing
- —
- Monthly P&I
- —
- Monthly cashflow
- —
- DSCR
- —
- Eligible?
- —
No personal income docs; deal must DSCR.
Hard money
10% down · 12.0% · 12mo
- Down + closing
- —
- Monthly P&I
- —
- Monthly cashflow
- —
- DSCR
- —
- Eligible?
- —
Short-term bridge; refi at stabilization.
Listing history 16 events
-
2026-06-18days on market $80,000 Active 31 DOM
-
2026-06-17days on market $80,000 Active 30 DOM
-
2026-06-16days on market $80,000 Active 29 DOM
-
2026-06-15days on market $80,000 Active 28 DOM
-
2026-06-13days on market $80,000 Active 26 DOM
-
2026-06-12days on market $80,000 Active 25 DOM
-
2026-06-09days on market $80,000 Active 22 DOM
-
2026-06-08days on market $80,000 Active 21 DOM
-
2026-06-07days on market $80,000 Active 20 DOM
-
2026-06-07days on market $80,000 Active 19 DOM
-
2026-06-04days on market $80,000 Active 16 DOM
-
2026-06-02days on market $80,000 Active 15 DOM
-
2026-06-01days on market $80,000 Active 14 DOM
-
2026-05-31days on market $80,000 Active 13 DOM
-
2026-05-31days on market $80,000 Active 12 DOM
-
2026-05-18$80,000 Active
ⓘ Source: listings_history table (triggers on properties + properties_extension) + one-shot
backfill from property_details.listing_events for pre-trigger history.
Tax reassessment forecast IA · Partial reset (capped growth)
- Current annual tax
- $1,354 · $113/mo
- Projected year-2 tax
- $1,354 · $113/mo
- Expected delta
- $0/yr ($0/mo · 0.0%)
ⓘ Screening estimate from a state-policy table — verify with the county assessor before closing.
Climate risk First Street
- Flood 1/10 Low FEMA zone X (unshaded) · 0% chance over 30 yrs
- Wildfire 4/10 Moderate
- Heat 3/10 Moderate 7 d/yr ≥105°F today · 15 d/yr by 30 yrs out
- Wind 2/10 Low
- Air quality 2/10 Low 1 unhealthy d/yr today · 1 by 30 yrs out
Nearby sold comps map
Loading sold comps map…
Walkable amenities ~0.75 mi
Loading nearby amenities…
Taxation est. · year 1
- Rental income
- $14,106
- − Mortgage interest
- −$4,481
- − Property taxes
- −$1,354
- − Insurance
- −$400
- − Repairs & maintenance
- −$1,128
- − Management
- −$1,128
- − Depreciation
- −$2,327
- Taxable income
- $3,287
- Est. tax owed @ 24.0%
- −$789
- After-tax cash flow
- $3,567/yr
For passive investors: Depreciation is non-cash, so a rental often shows a tax loss while cash-flowing — sheltering income. Rental losses are passive: they offset passive income freely, and up to $25,000/yr can offset ordinary (W-2) income if you actively participate and your MAGI is under $100k (phasing out to $0 by $150k); unused losses carry forward. On sale, claimed depreciation is recaptured at up to 25%, and gains may owe capital-gains tax (a 1031 exchange can defer both). Figures are a year-1 estimate at your 24.0% rate — not tax advice; consult a CPA.
Schools (NCES district)
- District
- English Valleys Community School District
- NCES district ID
- 1910980
- Math proficiency
- 63% ▼ -3.00%
- Reading proficiency
- 71% ▲ 4.00%
- Median HH income
- $48,683
- Composite
- 56.73/100
- National rank
- #1126
- State rank
- #177 of 289 in IA
Livability — North English
- Score
- 69/100
- State rank
- #398
- US rank
- #8472
Category grades
Schools grade is shown separately in the Schools card above.
Census & demographics
- Census place
- North English, IA
- Population (ZIP)
- 1,621
Population outlook (Iowa County) Hauer SSP2
- Today (2025)
- 16,503 people
- By 2030
- 16,422 · -0.5%
- By 2040
- 16,081 · -2.6%
- By 2050
- 15,428 · -6.5%
- By 2075
- 14,067 · -14.8%
- By 2100
- 11,638 · -29.5%
Race, ethnicity, and origin ACS 2023
- Neighborhood character
- Predominantly White (97%)
- Race & ethnicity
- White 97% Hispanic / Latino 2% Two or more races 1%
- Common ancestry
- English 4% Portuguese 4% Iranian 1%
- Foreign-born
- 1% · Canada
- Languages at home
- 98% English-only · Spanish 1%
Political lean MEDSL · Iowa
- 2024 margin
- Strong R (+27.8) · D 35.4% · R 63.1% · Other 1.6%
- 2008→2024 swing
- -27.9pp toward R · 2008: 0.2pp · 2024: -27.8pp
- All cycles
- 2024: R+27.8 2020: R+25.3 2016: R+24.2 2012: R+4.9 2008: D+0.2
Not yet ingested
- Civics
- —
Market trends
- HPI YoY
- ▲ 6.42%
- Current HPI
- 195.68
- Rent YoY
- —
- Metro
- —
- State GDP YoY
- ▲ 2.48%
- F500 in state
- 4
Industry mix (Fortune 500 HQ in IA)
| Industry | F500 HQs | Revenue |
|---|---|---|
| Financial Services | 1 | $16B |
|
||
| Retail / Convenience | 1 | $15B |
|
||
Price history
1 event — show timeline
- 2026-05-18 Listed $80,000 ICAARMLS
Property tax history
+4.3%/yrLatest (2025): $1,354 · +7.0% YoY. Source: county tax records.
Cash-flow waterfall
monthlySold comps — $/sqft
last 12 mo · ≤1 miLoading sold comps…