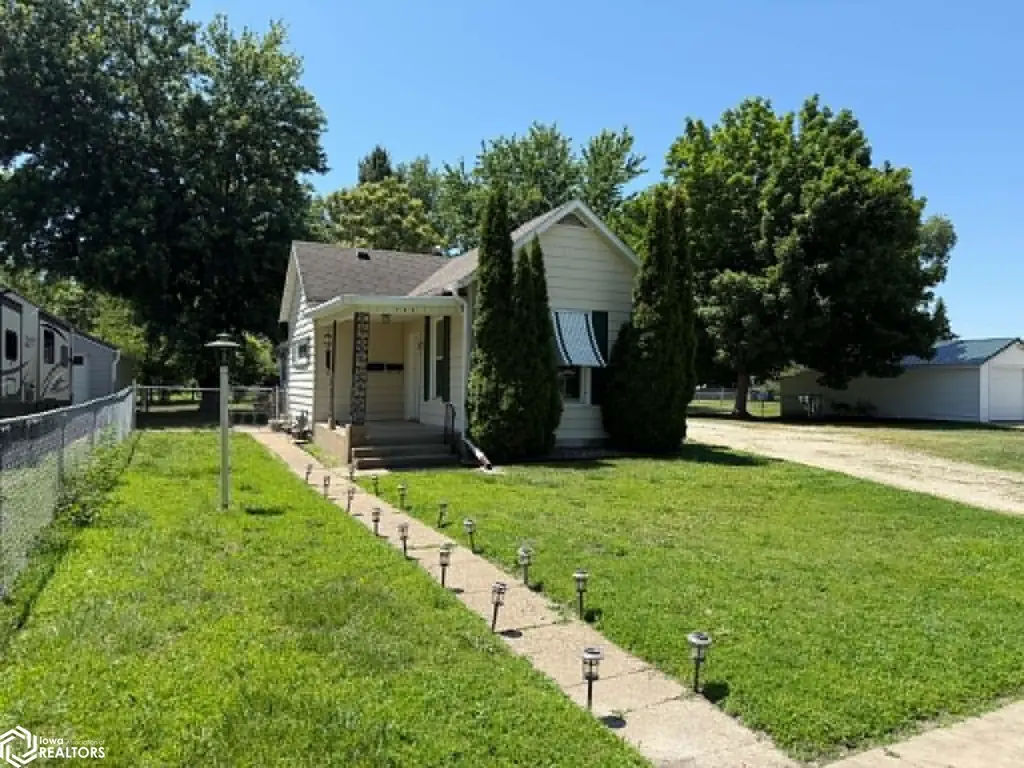
705 Hedge Ave · Burlington, IA
Flood risk 1/10 · Minimal
- FEMA flood zone
- X (unshaded)
- Chance of flooding over 30 yrs
- 0.0%
- Est. flood insurance / yr
- $473 – $860
Fire risk 1/10 · Minimal
- Est. fire insurance / yr
- $902 – $1,676
Heat risk 3/10 · Minor
- Hot days now (above 106°F)
- 7 days/yr
- Hot days in 30 yrs
- 16 days/yr
Wind risk 2/10 · Minimal
- Chance of severe wind over 30 yrs
- —
Air-quality risk 2/10 · Minimal
- Unhealthy air days now
- 0 days/yr
- Unhealthy air days in 30 yrs
- 1 days/yr
Risk factors via First Street. Map © Google.
Why this score? — see what drove the F grade
The composite is a weighted blend of 9 inputs, each scored 0–100. Each bar is that input's sub-score; the figure is the points it added to the 100-point composite (weight × sub-score).
- Cash flow +13.7/30.0
- DSCR +4.2/10.0
- Schools +4.0/10.0
- Livability +3.7/5.0
- 1% rule +3.5/10.0
- Rent growth +2.5/5.0
- Condition / age +2.5/5.0
- ARV discount +0.0/15.0
- Appreciation +0.0/10.0
$105,000
🖨 Deal sheet 📄 Offer letter ✓ Due diligence
Listing remarks MLS
Charming home with everything on the main floor. Unfinished basement for extra storage. The extra large lot is awesome! It offers a great place for a garden and/or for entertaining. Also, there is a one car and two car garage (with the two bay currently rented out and can continue to be for additonal income and assistance with the lower than rent mortgage payment! Large flat lot.
Key facts
- Large double lot
- Detached garage
- 0.32 acre lot
Tags
Property features AI
Finance
- Other: Lot totals approximately 0.32 acres (dimensions listed as 50 x 165 and 40 x 143); Public maintained road frontage on a city street
Exterior
- Parking: Detached garage; 3 garage spaces; Gravel driveway
- Utilities: Public water; Public sewer
- Home design: Single-family residence; Residential zoning
- Construction: Metal siding
- Exterior features: Partial chain link fencing; Shingle roof; Additional garage structures on the property
Interior
- Kitchen: Range; Refrigerator
- Bathrooms: 1 full bathroom
- Interior features: Range; Refrigerator; Central air; Forced air heating
Neighborhood map
What this means for you Summary
Snapshot
- This is a 2-bed/1.0-bath single-family listed at $105k.
Deal economics
- At list price, monthly cash flow is $8 ($100/yr) — positive.
- The deal already cash-flows at list — no discount required.
- To meet the 1% rule (rent ≥ 1% of price), the offer needs to be $90k (14.7% below list).
- Recommended offer: $90k (14.7% below list) — sets the bar for 1% rule.
Location & tenants
- Location reads 73/100 on livability (#287 in IA) — a middle-class / working-renter tenant base. Strengths: cost of living A+, housing A+, health & safety A+; Watch: crime D+, employment D, amenities F.
- Burlington Community School District (town): math 42% / reading 54% proficiency, ranked #286 of 289 in IA (top 99%) — families likely to look elsewhere, expect single-tenant / working-renter base with shorter leases.
- Market conditions: 184 active listings in the ZIP; 3 comparable units currently listed for rent nearby; rentals lingering (median 44d on market — plan ~5-8 weeks vacancy on turnover, expect pricing pressure); 100% of comp listings sitting > 30 days — soft ceiling on asking rent; 53 units permitted in Des Moines County in 2024 (40 in 5+ unit buildings).
- This rent is only 18% of the median local income ($61k/yr) — well below the 30% rent-burden line; pricing power to push rent on renewal without tenant pushback.
Forward outlook
- Local home prices are declining (-3.0%/yr); year-one equity from $726 of loan paydown is wiped out by about $3k of value loss. Plan a longer hold.
- Des Moines County population projected to shrink 6% by 2050 — rents likely to lag national; underwrite the cash flow, not the appreciation.
Negotiation context
- It's been on market 18 days — a 2% lower offer ($103k) is reasonable based on typical stale-listing flexibility.
- 2 sale attempts since 5y ago with the ask held roughly flat each time — persistent listings suggest the price (not the market) is what's stuck; bring a comps-based counter.
- Current owner paid $67k; list at $105k implies a 57% gain — meaningful room to come down on a strong offer.
Risks & watch-outs
- Watch-outs: built in 1857 — expect roof / HVAC / electrical / plumbing capex.
Questions for the listing agent
- Built in 1857 — when were the roof, HVAC, electrical panel, plumbing, and water heater last replaced?
- Is there a deadline driving the sale (1031 exchange, divorce, estate, relocation)? That informs how much negotiation room exists.
- Crime grade is D in this area — have there been break-ins, vandalism, or insurance claims at this property in the last 3 years? What carrier currently insures it and at what premium?
- The area grade is low — what's the realistic commute time and amenity access for the typical tenant pool here? Any planned neighborhood developments (good or bad) we should know about?
- What's the average days-on-market for RENTAL listings here right now (not sales)? A rising rental-DOM trend means longer vacancies and softer asking-rent achievability than the comps imply.
- What's the recent tenant-quality profile in this submarket — average credit score on applications, eviction rate, late-payment / NSF rate, and stable-employment percentage? A property-management company in the area should have these aggregated.
- How much new for-sale + rental construction is in the pipeline within 1–3 miles? Heavy new supply typically softens prices + rents 12–24 months out; constrained supply supports both.
Investment metrics
- 1% rule
- 0.85% ✗
- Cap rate
- 6.39%
- Cash-on-cash
- 0.34%
- DSCR
- 1.02
- GRM
- 9.8
CMA / ARV
- ARV (on-the-fly)
- $87,360
- Comps found
- 12
Show comp detail 12 sales within ~0.75 mi
| Address | Dist | Beds/Ba | Sqft | Sold | Price | $/sf | Match |
|---|---|---|---|---|---|---|---|
| 2009 S Central Ave | 0.26mi | 1/1.0 (-1) | 824 (-2%) | 2mo | $99,000 | $120 | 78 |
| 2136 S Central Ave | 0.27mi | 2/1.0 | 792 (-6%) | 5mo | $82,000 | $104 | 74 |
| 1809 S 15th St | 0.51mi | 2/1.0 | 850 (+1%) | 1mo | $58,000 | $68 | 73 |
| 2218 S 10th St St | 0.29mi | 2/1.0 | 884 (+5%) | 10mo | $94,500 | $107 | 70 |
| 2432 S 3rd St | 0.35mi | 1/1.0 (-1) | 888 (+6%) | 4mo | $79,000 | $89 | 66 |
| 2229 S 12th St | 0.43mi | 2/1.0 | 780 (-7%) | 4mo | $95,750 | $123 | 65 |
| 1104 Lynnwood Dr | 0.62mi | 2/1.0 | 816 (-3%) | 3mo | $132,000 | $162 | 64 |
| 1320 S 10th St | 0.46mi | 2/1.0 | 927 (+10%) | 1mo | $29,401 | $32 | 61 |
| 1229 Harrison Ave Ave | 0.35mi | 2/1.0 | 748 (-11%) | 10mo | $65,000 | $87 | 57 |
| 2230 S 3rd St | 0.31mi | 2/1.0 | 720 (-14%) | 7mo | $65,000 | $90 | 55 |
| 1609 Acres St | 0.70mi | 2/1.0 | 912 (+9%) | 0mo | $124,000 | $136 | 53 |
| 1904 Delmar St | 0.75mi | 1/1.0 (-1) | 924 (+10%) | 7mo | $70,000 | $76 | 38 |
Match score weights: distance 35% · size 25% · config 20% · recency 20%. Top-matched comps best support the ARV.
Projected returns pro-forma
-3.0% appreciation · 3.0% rent growth · sell at horizon
- IRR
- -15.8%
- Equity multiple
- 0.44×
- Total profit
- $-16,484
- Equity at exit
- $15,656
- IRR
- -7.3%
- Equity multiple
- 0.53×
- Total profit
- $-13,679
- Equity at exit
- $9,078
Cash invested: $29,400 (down + closing). Projections, not guarantees.
Landlord ↔ Tenant lean methodology
- Overall (STATE)
- 83 Strongly Landlord-Friendly
- State Iowa
- 83 Strongly Landlord-Friendly · R+6
- County
- — inherits STATE
- City
- — inherits STATE
ZIP-level market 52601
- Active inventory
- 184
- Price-to-rent
- 9.8×
Monthly cashflow live
- Estimated rent
- $895 medium interval (Pro) →
- Mortgage (P&I)
- −$551
- Tax from tax record
- −$105 /mo · $1,256/yr
- Insurance
- −$44
- HOA
- −$0
- Vacancy / Maint / Mgmt
- −$188
- Net cashflow
- $8
Break-even live
UW: 25.0% down · 7.5% · 30yr · 1.5% tax · 5.0% vac · 8.0% maint · 8.0% mgmt
Financing live
Cash to close
- Down payment
- $26,250
- Closing costs
- $3,150
- Reserves months
- —
- Total cash needed
- —
Loan-product check · same deal, 3 products live
Conventional
25% down · 7.5% · 30yr
- Down + closing
- —
- Monthly P&I
- —
- Monthly cashflow
- —
- DSCR
- —
- Eligible?
- —
Personal DTI + credit; lowest rate.
DSCR
20% down · 8.5% · 30yr
- Down + closing
- —
- Monthly P&I
- —
- Monthly cashflow
- —
- DSCR
- —
- Eligible?
- —
No personal income docs; deal must DSCR.
Hard money
10% down · 12.0% · 12mo
- Down + closing
- —
- Monthly P&I
- —
- Monthly cashflow
- —
- DSCR
- —
- Eligible?
- —
Short-term bridge; refi at stabilization.
Rent comps 3 comps
| Address | Beds | Baths | Sqft | Rent | $/sqft | DOM | Units | Dist |
|---|---|---|---|---|---|---|---|---|
| 2216 Piper Pl Unit 1 Burlington, IA | 2.0 | 1.0 | 728 | $875 | $1.20 | 43d | 1 | 0.59mi |
| 116 N 4th St Unit 205 Burlington, IA | 1.0 | 1.0 | 930 | $900 | $0.97 | 43d | 1 | 1.43mi |
| 116 N 5th St Unit 402 Burlington, IA | 1.0 | 1.0 | 1025 | $1,020 | $1.00 | 43d | 1 | 1.46mi |
Listing history 14 events
-
2026-06-19days on market $105,000 Active 18 DOM
-
2026-06-18days on market $105,000 Active 17 DOM
-
2026-06-17days on market $105,000 Active 16 DOM
-
2026-06-16days on market $105,000 Active 15 DOM
-
2026-06-15days on market $105,000 Active 14 DOM
-
2026-06-14days on market $105,000 Active 12 DOM
-
2026-06-12days on market $105,000 Active 11 DOM
-
2026-06-09days on market $105,000 Active 8 DOM
-
2026-06-08days on market $105,000 Active 7 DOM
-
2026-06-07days on market $105,000 Active 6 DOM
-
2026-06-07days on market $105,000 Active 5 DOM
-
2026-06-03days on market $105,000 Active 2 DOM
-
2026-06-01remarks 651-char remark
-
2026-06-01$105,000 Active 1 DOM
ⓘ Source: listings_history table (triggers on properties + properties_extension) + one-shot
backfill from property_details.listing_events for pre-trigger history.
Tax reassessment forecast IA · Partial reset (capped growth)
- Current annual tax
- $1,256 · $105/mo
- Projected year-2 tax
- $1,452 · $121/mo
- Expected delta
- +$196/yr (+$16/mo · 15.6%)
ⓘ Screening estimate from a state-policy table — verify with the county assessor before closing.
Climate risk First Street
- Flood 1/10 Low FEMA zone X (unshaded) · 0% chance over 30 yrs
- Wildfire 1/10 Low
- Heat 3/10 Moderate 7 d/yr ≥106°F today · 16 d/yr by 30 yrs out
- Wind 2/10 Low
- Air quality 2/10 Low 0 unhealthy d/yr today · 1 by 30 yrs out
Nearby sold comps map
Loading sold comps map…
Walkable amenities ~0.75 mi
Loading nearby amenities…
Taxation est. · year 1
- Rental income
- $10,746
- − Mortgage interest
- −$5,882
- − Property taxes
- −$1,256
- − Insurance
- −$525
- − Repairs & maintenance
- −$860
- − Management
- −$860
- − Depreciation
- −$3,055
- Taxable loss
- −$1,691
- Est. tax savings @ 24.0%
- +$406
- After-tax cash flow
- $506/yr
For passive investors: Depreciation is non-cash, so a rental often shows a tax loss while cash-flowing — sheltering income. Rental losses are passive: they offset passive income freely, and up to $25,000/yr can offset ordinary (W-2) income if you actively participate and your MAGI is under $100k (phasing out to $0 by $150k); unused losses carry forward. On sale, claimed depreciation is recaptured at up to 25%, and gains may owe capital-gains tax (a 1031 exchange can defer both). Figures are a year-1 estimate at your 24.0% rate — not tax advice; consult a CPA.
Schools (NCES district)
- District
- Burlington Community School District
- NCES district ID
- 1905790
- Math proficiency
- 42% ▼ -4.00%
- Reading proficiency
- 54% ▼ -1.00%
- Median HH income
- $41,833
- Composite
- 40.3/100
- National rank
- #3753
- State rank
- #286 of 289 in IA
Livability — Burlington
- Score
- 73/100
- State rank
- #287
- US rank
- #5540
Category grades
Schools grade is shown separately in the Schools card above.
Census & demographics
- Census place
- Burlington, IA
- County
- Des Moines County · 27,341 people
- City population
- 27,341
- Metro
- Burlington, IA-IL
- Population (ZIP)
- 27,341
- Household income
- $60,983
- Rent vs Own
- Severe rent burden
- 963.0
Population outlook (Des Moines County) Hauer SSP2
- Today (2025)
- 39,735 people
- By 2030
- 39,257 · -1.2%
- By 2040
- 38,090 · -4.1%
- By 2050
- 37,156 · -6.5%
- By 2075
- 36,905 · -7.1%
- By 2100
- 37,222 · -6.3%
Race, ethnicity, and origin ACS 2023
- Neighborhood character
- Predominantly White (83%)
- Race & ethnicity
- White 83% Two or more races 8% Black 5% Hispanic / Latino 4% Asian 1%
- Common ancestry
- Iranian 2% Lithuanian 2% Slovak 2%
- Foreign-born
- 3% · Canada
- Languages at home
- 95% English-only · Spanish 3% Other Asian/Pacific 1%
Political lean MEDSL · Des Moines
- 2024 margin
- R (+15.1) · D 41.8% · R 56.8% · Other 1.4%
- 2008→2024 swing
- -38.1pp toward R · 2008: 23.0pp · 2024: -15.1pp
- All cycles
- 2024: R+15.1 2020: R+8.5 2016: R+7.0 2012: D+18.5 2008: D+23.0
Not yet ingested
- Civics
- —
Market trends
- HPI YoY
- ▼ -83.48%
- Current HPI
- 149.7662
- Rent YoY
- —
- Metro
- Burlington, IA-IL
- State GDP YoY
- ▲ 2.48%
- F500 in state
- 4
Industry mix (Fortune 500 HQ in IA)
| Industry | F500 HQs | Revenue |
|---|---|---|
| Financial Services | 1 | $16B |
|
||
| Retail / Convenience | 1 | $15B |
|
||
Price history
+92.7% since first listed7 events — show timeline
- 2026-06-01 Listed $105,000 IAR
- 2021-07-13 Sold (Public Records) $67,000 Public Records
- 2021-07-09 Sold (MLS) $67,000 IAR
- 2021-03-29 Listed $74,900 IAR
- 2013-10-31 Sold (Public Records) $58,500 Public Records
- 2008-07-22 Sold (Public Records) $54,500 Public Records
- 2007-11-28 Sold (Public Records) $54,500 Public Records
Property tax history
+2.5%/yrLatest (2025): $1,256 · +14.6% YoY. Source: county tax records.
Cash-flow waterfall
monthlySold comps — $/sqft
last 12 mo · ≤1 miLoading sold comps…