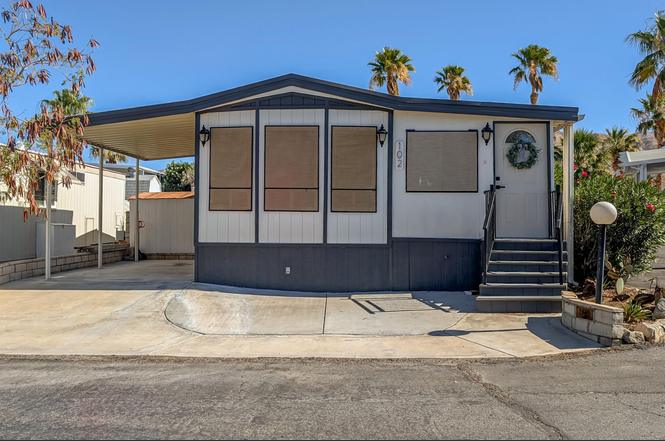
70200 Dillon Rd #102 · Desert Edge, CA
Flood risk 1/10 · Minimal
- FEMA flood zone
- A
- Chance of flooding over 30 yrs
- 0.0%
- Est. flood insurance / yr
- $1,009 – $1,996
Fire risk 5/10 · Moderate
- Est. fire insurance / yr
- $659 – $1,223
Heat risk 8/10 · Major
- Hot days now (above 109°F)
- 6 days/yr
- Hot days in 30 yrs
- 16 days/yr
Wind risk 1/10 · Minimal
- Chance of severe wind over 30 yrs
- —
Air-quality risk 5/10 · Moderate
- Unhealthy air days now
- 6 days/yr
- Unhealthy air days in 30 yrs
- 8 days/yr
Risk factors via First Street. Map © Google.
Why this score? — see what drove the B+ grade
The composite is a weighted blend of 9 inputs, each scored 0–100. Each bar is that input's sub-score; the figure is the points it added to the 100-point composite (weight × sub-score).
- Cash flow +30.0/30.0
- ARV discount +14.3/15.0
- 1% rule +10.0/10.0
- DSCR +10.0/10.0
- Condition / age +4.0/5.0
- Livability +3.4/5.0
- Schools +2.7/10.0
- Rent growth +2.5/5.0
- Appreciation +0.0/10.0
$72,000
🖨 Deal sheet 📄 Offer letter ✓ Due diligence
Listing remarks
This beautifully renovated, turnkey park model home offers 2 bedrooms, 1 bathroom, and approximately 800 sq. ft. of comfortable living space, ideal for entertaining. The home features modern designer touches, abundant natural light, new flooring throughout, updated countertops, new kitchen cabinets, and a beautifully upgraded spa-like bathroom. A fantastic, covered patio provides a private, serene place to relax. Located in Caliente Springs 55+ Resort, residents enjoy amenities including a 9-hole golf course, hot mineral springs pool and spas, 8 pickleball courts, and an active, welcoming community. Space rent is $711; the lot is leased, not owned.
Key facts
- Covered patio
- 9-hole golf course
- 8 pickleball courts
Tags
Property features AI
Finance
- Other: Space rent includes trash (monthly space rent listed); Mobile home to remain; manager approval obtained; Located in an RV park / resort (Caliente Springs Resort)
- HOA & community: Zero monthly association fee listed; Gated senior community with community amenities
Exterior
- Parking: Three total parking spaces; One covered space; One carport space; Assigned parking and driveway parking
- Security: Automatic gate in a gated community; Community security features
- Utilities: Water provided by district (Mission); Septic tank; Has water well; PUD: Yes
- Home design: Detached park-model style home; Single-story, ground-level entry; Park model builder: Casa Royale
- Construction: Siding exterior; Pier jacks and tie-down foundation; Park-model unit manufactured in 1988
- Exterior features: Covered patio; Accessory buildings/shed; Vinyl and some no fencing; Landscaped, private and level lot; Close to clubhouse; Leisure-facing north with front door facing south; Has views of city lights, pond, park/greenbelt, peek-a-boo views, mountains, hills and desert
Interior
- Kitchen: Laminate counters; Gas cooktop; Gas oven; Microwave; Refrigerator; Dishwasher
- Bedrooms: Two master bedrooms
- Flooring: Laminate flooring
- Bathrooms: One full bathroom; One half bathroom; Shower stall
- Heating & cooling: Electric forced air heating; Air conditioning; Ceiling fans
- Interior features: Vaulted ceilings; Sliding doors; Awnings on windows; Ground-level entry with steps; Turnkey furnished
- Laundry & utility: Washer; Laundry in an individual room / laundry area; Water heater unit
Neighborhood map
What this means for you Summary
Snapshot
- This is a 2-bed/1.5-bath manufactured listed at $72k. Condition is rated good.
Deal economics
- At list price, monthly cash flow is $856 ($10k/yr) — positive.
- The deal already cash-flows at list — no discount required.
- Meets the 1% rule at list price ($2k rent vs $72k).
- Cap rate 22.6% vs local median 14.8% in Desert Edge — top-decile yield for the area; either an underpriced asset or a hidden risk that comps aren't pricing in. Stress-test before assuming the spread holds.
Location & tenants
- Location reads 68/100 on livability (#297 in CA) — a middle-class / working-renter tenant base. Strengths: cost of living A+, housing A+; Watch: crime C-, schools F, commute D-.
- Palm Springs Unified (suburban): math 21% / reading 42% proficiency, ranked #328 of 517 in CA (top 63%) — families likely to look elsewhere, expect single-tenant / working-renter base with shorter leases; 73% free/reduced lunch — lower-income household profile, screen leases tightly.
- Market conditions: 216 active listings in the ZIP; 5 comparable units currently listed for rent nearby; rentals at typical pace (median 25d on market — plan ~3-4 weeks tenant-placement turnaround); 40% of comp listings sitting > 30 days — soft ceiling on asking rent; 9,195 units permitted in Riverside County in 2024 (1,512 in 5+ unit buildings).
Forward outlook
- Local home prices are declining (-3.0%/yr); year-one equity from $498 of loan paydown is wiped out by about $2k of value loss. Plan a longer hold.
- Riverside County population projected at +22% by 2050 — long-run rental-demand tailwind backs the buy-and-hold thesis.
- At projected returns (-3.0% appreciation + 3.0% rent growth), your $20k cash investment doubles in ~3 years — after that, you're playing with house money.
Negotiation context
- Only 3 days on market — expect competitive offers; lowballing is unlikely to land.
Risks & watch-outs
- Watch-outs: flood insurance adds $125/mo.
- Climate carrying-cost: in FEMA flood zone A (mandatory federal flood insurance); moderate wildfire risk; extreme-heat days projected 6→16/yr by 2055 (HVAC capex compounding) — expect insurance premiums to compound above CPI over the hold.
Questions for the listing agent
- What's the actual annual flood-insurance premium (NFIP or private), and is the property in a SFHA with mandatory coverage?
- Is there a deadline driving the sale (1031 exchange, divorce, estate, relocation)? That informs how much negotiation room exists.
- Schools are F-rated, which usually means shorter tenancies and higher turnover. Who's the typical renter profile here, and what's been the actual vacancy rate?
- What's the average days-on-market for RENTAL listings here right now (not sales)? A rising rental-DOM trend means longer vacancies and softer asking-rent achievability than the comps imply.
- What's the recent tenant-quality profile in this submarket — average credit score on applications, eviction rate, late-payment / NSF rate, and stable-employment percentage? A property-management company in the area should have these aggregated.
- How much new for-sale + rental construction is in the pipeline within 1–3 miles? Heavy new supply typically softens prices + rents 12–24 months out; constrained supply supports both.
Investment metrics
- 1% rule
- 2.60% ✓
- Cap rate
- 22.64%
- Cash-on-cash
- 58.40%
- DSCR
- 3.60
- GRM
- 3.2
CMA / ARV
- ARV (on-the-fly)
- $84,800
- Comps found
- 12
Show comp detail 12 sales within ~0.75 mi
| Address | Dist | Beds/Ba | Sqft | Sold | Price | $/sf | Match |
|---|---|---|---|---|---|---|---|
| 70200 Dillon Rd #102 | 0.00mi | 2/1.5 | 800 (0%) | 0mo | $72,000 | $90 | 100 |
| 70200 Dillon Rd #550 | 0.00mi | 2/2.0 | 800 (0%) | 1mo | $122,000 | $153 | 97 |
| 70200 Dillon Rd #664 | 0.16mi | 2/1.5 | 800 (0%) | 3mo | $95,000 | $119 | 90 |
| 70200 Dillon Rd #376 | 0.11mi | 1/1.0 (-1) | 800 (0%) | 3mo | $60,000 | $75 | 86 |
| 70200 Dillon Rd #536 | 0.11mi | 2/1.5 | 750 (-6%) | 1mo | $90,000 | $120 | 84 |
| 70200 Dillon Rd #437 | 0.16mi | 1/1.0 (-1) | 780 (-2%) | 1mo | $65,000 | $83 | 80 |
| 70200 Dillon Rd #569 | 0.11mi | 1/1.0 (-1) | 700 (-12%) | 4mo | $74,000 | $106 | 64 |
| 70200 Dillon Rd #436 | 0.17mi | 2/1.0 | 700 (-12%) | 7mo | $98,000 | $140 | 64 |
| 17625 Langlois #105 | 0.55mi | 2/2.0 | 840 (+5%) | 1mo | $55,000 | $65 | 64 |
| 70200 Dillon Rd #157 | 0.11mi | 1/1.0 (-1) | 700 (-12%) | 6mo | $54,800 | $78 | 62 |
| 17555-2 Corkill Rd #28 | 0.54mi | 2/2.0 | 880 (+10%) | 3mo | $99,990 | $114 | 53 |
| 17625 Langlois #9 | 0.55mi | 2/1.0 | 700 (-12%) | 3mo | $15,000 | $21 | 49 |
Match score weights: distance 35% · size 25% · config 20% · recency 20%. Top-matched comps best support the ARV.
Projected returns pro-forma
-3.0% appreciation · 3.0% rent growth · sell at horizon
- IRR
- 48.8%
- Equity multiple
- 3.13×
- Total profit
- $42,948
- Equity at exit
- $10,735
- IRR
- 54.4%
- Equity multiple
- 6.36×
- Total profit
- $108,015
- Equity at exit
- $6,225
Cash invested: $20,160 (down + closing). Projections, not guarantees.
Landlord ↔ Tenant lean methodology
- Overall (STATE)
- 18 Strongly Tenant-Friendly
- State California
- 18 Strongly Tenant-Friendly · D+13
- County
- — inherits STATE
- City
- — inherits STATE
ZIP-level market 92241
- Home prices YoY
- -22.8%
- Active inventory
- 216
- Price-to-rent
- 3.2×
Monthly cashflow live
- Estimated rent
- $1,872 high interval (Pro) →
- Mortgage (P&I)
- −$378
- Tax est. 1.5%
- −$90 /mo · $1,080/yr
- Insurance
- −$30
- Flood insurance flood zone
- −$125 /mo · $1,502/yr
- HOA
- −$0
- Vacancy / Maint / Mgmt
- −$393
- Net cashflow
- $856
Break-even live
UW: 25.0% down · 7.5% · 30yr · 1.5% tax · 5.0% vac · 8.0% maint · 8.0% mgmt
Financing live
Cash to close
- Down payment
- $18,000
- Closing costs
- $2,160
- Reserves months
- —
- Total cash needed
- —
Loan-product check · same deal, 3 products live
Conventional
25% down · 7.5% · 30yr
- Down + closing
- —
- Monthly P&I
- —
- Monthly cashflow
- —
- DSCR
- —
- Eligible?
- —
Personal DTI + credit; lowest rate.
DSCR
20% down · 8.5% · 30yr
- Down + closing
- —
- Monthly P&I
- —
- Monthly cashflow
- —
- DSCR
- —
- Eligible?
- —
No personal income docs; deal must DSCR.
Hard money
10% down · 12.0% · 12mo
- Down + closing
- —
- Monthly P&I
- —
- Monthly cashflow
- —
- DSCR
- —
- Eligible?
- —
Short-term bridge; refi at stabilization.
Rent comps 5 comps
| Address | Beds | Baths | Sqft | Rent | $/sqft | DOM | Units | Dist |
|---|---|---|---|---|---|---|---|---|
| 70875 Dillon Rd Desert Hot Springs, CA | 2.0 | 2.0 | 720 | $2,200 | $3.06 | 44d | 1 | 0.80mi |
| 69360 Poolside Dr Desert Hot Springs, CA | 3.0 | 2.0 | 648 | $1,800 | $2.78 | 2d | 1 | 0.82mi |
| 18070 Langlois Rd #257 Desert Hot Springs, CA | 2.0 | 2.0 | 1056 | $1,850 | $1.75 | 44d | 1 | 0.95mi |
| 18070 Langlois Rd Dsrt Hot Spgs, CA | 2.0 | 2.0 | 950 | $1,850 | $1.95 | 24d | 1 | 0.95mi |
| 15935 Mary Cir Desert Hot Springs, CA | 1.0 | 1.0 | 550 | $1,350 | $2.45 | 18d | 1 | 1.37mi |
Listing history 4 events
-
2026-06-15status $72,000 Pending 3 DOM
-
2026-06-13days on market $72,000 Active 3 DOM
-
2026-06-13remarks 656-char remark
-
2026-06-13$72,000 Active 2 DOM
ⓘ Source: listings_history table (triggers on properties + properties_extension) + one-shot
backfill from property_details.listing_events for pre-trigger history.
Climate risk First Street
- Flood 1/10 Low FEMA zone A · 0% chance over 30 yrs
- Wildfire 5/10 Major
- Heat 8/10 Severe 6 d/yr ≥109°F today · 16 d/yr by 30 yrs out
- Wind 1/10 Low
- Air quality 5/10 Major 6 unhealthy d/yr today · 8 by 30 yrs out
Nearby sold comps map
Loading sold comps map…
Walkable amenities ~0.75 mi
Loading nearby amenities…
Taxation est. · year 1
- Rental income
- $22,460
- − Mortgage interest
- −$4,033
- − Property taxes
- −$1,080
- − Insurance
- −$1,862
- − Repairs & maintenance
- −$1,797
- − Management
- −$1,797
- − Depreciation
- −$2,095
- Taxable income
- $9,796
- Est. tax owed @ 24.0%
- −$2,351
- After-tax cash flow
- $7,919/yr
For passive investors: Depreciation is non-cash, so a rental often shows a tax loss while cash-flowing — sheltering income. Rental losses are passive: they offset passive income freely, and up to $25,000/yr can offset ordinary (W-2) income if you actively participate and your MAGI is under $100k (phasing out to $0 by $150k); unused losses carry forward. On sale, claimed depreciation is recaptured at up to 25%, and gains may owe capital-gains tax (a 1031 exchange can defer both). Figures are a year-1 estimate at your 24.0% rate — not tax advice; consult a CPA.
Condition & rehab AI · 13 photos
This beautifully renovated park model home offers modern updates and a serene outdoor space, ideal for a turnkey living experience.
Value-add opportunities
- Both landscaping — enhances curb appeal and value
- Both paint exterior — improves curb appeal and value
Renovation cost estimate screening
Value-add ROI direction
- Both landscaping — enhances curb appeal and value ↑
- Both paint exterior — improves curb appeal and value ↑
ⓘ Cost ranges are severity-bucket heuristics (US national rule-of-thumb). Get contractor quotes + a written scope before underwriting a rehab budget.
Schools (NCES district)
- District
- Palm Springs Unified
- NCES district ID
- 0629550
- Math proficiency
- 21% ▼ -7.00%
- Reading proficiency
- 42% ▬ 0.00%
- Median HH income
- $43,638
- Composite
- 26.76/100
- National rank
- #7131
- State rank
- #328 of 517 in CA
Livability — Desert Edge
- Score
- 68/100
- State rank
- #297
- US rank
- #9953
Category grades
Schools grade is shown separately in the Schools card above.
Census & demographics
- Census place
- Desert Edge, CA
- Population (ZIP)
- 8,624
Population outlook (Riverside County) Hauer SSP2
- Today (2025)
- 2,664,475 people
- By 2030
- 2,802,692 · +5.2%
- By 2040
- 3,050,904 · +14.5%
- By 2050
- 3,256,783 · +22.2%
- By 2075
- 3,655,058 · +37.2%
- By 2100
- 3,766,594 · +41.4%
Race, ethnicity, and origin ACS 2023
- Race & ethnicity
- White 50% Hispanic / Latino 46% Two or more races 16% Asian 2% Native American 1%
- Hispanic origin (detail)
- Mexican 36%
- Common ancestry
- Lithuanian 3% Slovak 2% Portuguese 2%
- Foreign-born
- 28% · Canada, South Korea
- Languages at home
- 57% English-only · Spanish 38% Chinese 1% Russian/Polish/Slavic 1%
Political lean MEDSL · Riverside
- 2024 margin
- Toss-up / Even · D 48.0% · R 49.3% · Other 2.6%
- 2008→2024 swing
- -3.6pp toward R · 2008: 2.3pp · 2024: -1.3pp
- All cycles
- 2024: R+1.3 2020: D+8.0 2016: D+4.3 2012: R+0.4 2008: D+2.3
Not yet ingested
- Civics
- —
Market trends
- HPI YoY
- ▼ -118.23%
- Current HPI
- 400.5663
- Rent YoY
- —
- Metro
- —
- State GDP YoY
- ▲ 3.21%
- F500 in state
- 116
Industry mix (Fortune 500 HQ in CA)
| Industry | F500 HQs | Revenue |
|---|---|---|
| Technology | 27 | $1,492B |
|
||
| Financial Services | 3 | $174B |
|
||
| Retail | 3 | $44B |
|
||
| Insurance | 3 | $26B |
|
||
| Media / Entertainment | 2 | $115B |
|
||
| Pharmaceuticals / Biotech | 2 | $62B |
|
||
Price history
1 event — show timeline
- 2026-06-10 Listed $72,000 GPSMLS
Cash-flow waterfall
monthlySold comps — $/sqft
last 12 mo · ≤1 miLoading sold comps…