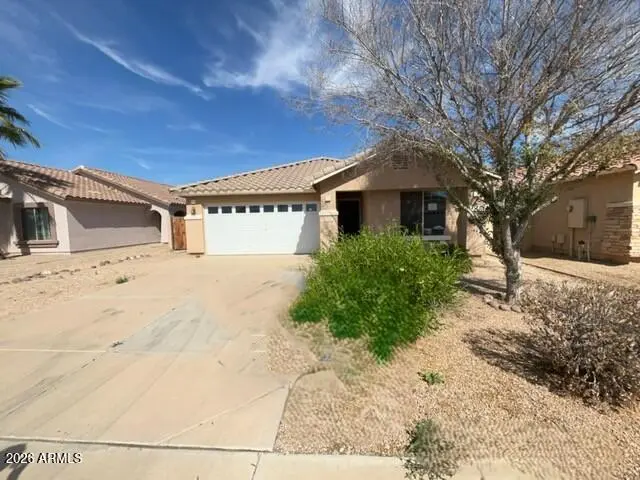
17720 W Calavar Rd · Surprise, AZ
Flood risk 1/10 · Minimal
- FEMA flood zone
- X (shaded)
- Chance of flooding over 30 yrs
- 0.0%
- Est. flood insurance / yr
- $507 – $1,088
Fire risk 6/10 · Moderate
- Est. fire insurance / yr
- $610 – $1,132
Heat risk 9/10 · Severe
- Hot days now (above 112°F)
- 6 days/yr
- Hot days in 30 yrs
- 16 days/yr
Wind risk 1/10 · Minimal
- Chance of severe wind over 30 yrs
- —
Air-quality risk 2/10 · Minimal
- Unhealthy air days now
- 1 days/yr
- Unhealthy air days in 30 yrs
- 1 days/yr
Risk factors via First Street. Map © Google.
Why this score? — see what drove the D grade
The composite is a weighted blend of 9 inputs, each scored 0–100. Each bar is that input's sub-score; the figure is the points it added to the 100-point composite (weight × sub-score).
- Cash flow +10.2/30.0
- ARV discount +9.5/15.0
- Appreciation +5.1/10.0
- Livability +3.7/5.0
- Schools +3.3/10.0
- DSCR +2.9/10.0
- Condition / age +2.5/5.0
- Rent growth +2.4/5.0
- 1% rule +2.1/10.0
$305,000
🖨 Deal sheet 📄 Offer letter ✓ Due diligence
Listing remarks MLS
Welcome to Sierra Montana! A Community filled w/ parks, greenbelts & walking paths! This well-maintained home offers 3 bed, 2 bath and a lg kitchen. With North/South exposure, this open concept home is light and bright and perfect for entertaining. The spacious eat-in kitchen offers ample cabinets, newer appliances and plenty of counter space. Tile flooring throughout the house for easy cleaning. The master BR with en-suite features a lg soaking tub and walk in closet. Step outside and enjoy a covered patio with extended slab ready for those backyard BBQs. Bring your toys as there is a large RV gate and paved side yard perfect for parking. All this, and a great location close to fabulous shopping, a wide variety of restaurants, good schools, & very convenient access to State Route 303!
Key facts
- Open floor plan
- Convenient access
- Fenced backyard
Tags
Property features AI
Finance
- HOA & community: Homeowners association with quarterly fee; Association fee $210 quarterly; Association fee includes: Other (see remarks)
Exterior
- Parking: 2 covered spaces; 2 open parking spaces; 2-car garage
- Utilities: City water; Public sewer
- Home design: Single family residence; Fee simple ownership
- Construction: Stucco and painted exterior with stone accents; Composition roof
- Exterior features: Desert front and desert back landscaping; Biking/walking path in the community
Interior
- Kitchen: Dishwasher; Laminate counters
- Bedrooms: Up to 3 bedrooms; Master bedroom on main level (approx. 12 x 16)
- Flooring: Tile flooring
- Bathrooms: 2 full bathrooms
- Heating & cooling: Electric heating; Central air; Ceiling fans
- Interior features: Double vanity; Eat-in kitchen; Full bath in master bedroom; Laminate countertops
- Laundry & utility: Indoor laundry with washer/dryer hookups (washer/dryer not included)
Neighborhood map
What this means for you Summary
Snapshot
- This is a 3-bed/2.0-bath single-family listed at $305k.
Deal economics
- At list price, monthly cash flow is $-172 ($-2k/yr) — negative.
- To cash-flow at today's rent, offer at most $275k (10.0% below list).
- To meet the 1% rule (rent ≥ 1% of price), the offer needs to be $217k (28.9% below list).
- Recommended offer: $217k (28.9% below list) — sets the bar for 1% rule.
- Cap rate 5.6% vs local median 3.3% in Surprise — top-decile yield for the area; either an underpriced asset or a hidden risk that comps aren't pricing in. Stress-test before assuming the spread holds.
Location & tenants
- Location reads 74/100 on livability (#19 in AZ, #4,616 nationally) — a middle-class / working-renter tenant base. Strengths: crime A+, housing A+, employment A-; Watch: health & safety D+, amenities D-, commute F.
- Dysart Unified District (4243) (suburban): math 34% / reading 40% proficiency, ranked #73 of 249 in AZ (top 29%) — families likely to look elsewhere, expect single-tenant / working-renter base with shorter leases.
- Zoned schools: Sunset Hills Elementary (math 37% / reading 48%, grade F, #367 of 1,109 statewide, top 33%, 969 students, 42% FRL); Shadow Ridge High School (math 34% / reading 39%, grade F, #88 of 381 statewide, top 24%, 2,323 students, 21% FRL).
- Market conditions: Rents soft (-0.6%/yr); 376 active listings in the ZIP; 27 comparable units currently listed for rent nearby; rentals at typical pace (median 22d on market — plan ~3-4 weeks tenant-placement turnaround); high-income renter base; 36,011 units permitted in Maricopa County in 2024 (12,801 in 5+ unit buildings).
Forward outlook
- In year one you build about $3k of equity ($2k loan paydown + $867 appreciation (0.3% local appreciation)).
- Maricopa County population projected at +38% by 2050 — long-run rental-demand tailwind backs the buy-and-hold thesis.
- By year 9, paydown + projected appreciation supports a ~$32k cash-out refi (75% LTV) — recoverable capital for the next deal without selling this one.
Negotiation context
- It's been on market 33 days — a 3% lower offer ($296k) is reasonable based on typical stale-listing flexibility.
- 7 sale attempts since 6y ago with the ask held roughly flat each time — persistent listings suggest the price (not the market) is what's stuck; bring a comps-based counter.
Risks & watch-outs
- Climate carrying-cost: major wildfire risk; extreme-heat days projected 6→16/yr by 2055 (HVAC capex compounding) — expect insurance premiums to compound above CPI over the hold.
Questions for the listing agent
- What do current leases actually rent for vs. the listed asking? Can we see a recent rent roll and the last 12 months of T-12 income?
- It's been on market 33 days. Have you received any prior offers? Is the seller open to a 29% concession, seller financing, or rate buy-down credit?
- What does the HOA fee cover, when was the last increase, and are there any pending special assessments or reserve-fund shortfalls?
- Is there a deadline driving the sale (1031 exchange, divorce, estate, relocation)? That informs how much negotiation room exists.
- The area grade is low — what's the realistic commute time and amenity access for the typical tenant pool here? Any planned neighborhood developments (good or bad) we should know about?
- What's the average days-on-market for RENTAL listings here right now (not sales)? A rising rental-DOM trend means longer vacancies and softer asking-rent achievability than the comps imply.
- What's the recent tenant-quality profile in this submarket — average credit score on applications, eviction rate, late-payment / NSF rate, and stable-employment percentage? A property-management company in the area should have these aggregated.
- How much new for-sale + rental construction is in the pipeline within 1–3 miles? Heavy new supply typically softens prices + rents 12–24 months out; constrained supply supports both.
Investment metrics
- 1% rule
- 0.71% ✗
- Cap rate
- 5.62%
- Cash-on-cash
- -2.42%
- DSCR
- 0.89
- GRM
- 11.7
CMA / ARV
- ARV (on-the-fly)
- $319,308
- Comps found
- 12
Show comp detail 12 sales within ~0.75 mi
| Address | Dist | Beds/Ba | Sqft | Sold | Price | $/sf | Match |
|---|---|---|---|---|---|---|---|
| 17765 W Ventura St | 0.11mi | 3/2.0 | 1,353 (0%) | 2mo | $339,900 | $251 | 93 |
| 17755 W Hearn Rd | 0.15mi | 3/2.0 | 1,403 (+4%) | 2mo | $367,000 | $262 | 85 |
| 17545 W Watson Ln | 0.22mi | 3/2.0 | 1,295 (-4%) | 0mo | $325,000 | $251 | 82 |
| 17517 W Ventura St | 0.21mi | 3/2.0 | 1,454 (+8%) | 0mo | $328,000 | $226 | 77 |
| 17611 W Watson Ln | 0.19mi | 3/2.0 | 1,283 (-5%) | 7mo | $349,900 | $273 | 77 |
| 17449 W Calavar Rd | 0.26mi | 3/2.0 | 1,265 (-6%) | 3mo | $347,000 | $274 | 74 |
| 17433 W Ventura St | 0.30mi | 4/2.0 (+1) | 1,454 (+8%) | 6mo | $343,000 | $236 | 64 |
| 14915 N 177th Ave | 0.61mi | 3/2.5 | 1,298 (-4%) | 4mo | $285,000 | $220 | 59 |
| 17737 W Mandalay Ln | 0.44mi | 3/2.5 | 1,495 (+10%) | 4mo | $330,000 | $221 | 57 |
| 14723 N 177th Ave | 0.49mi | 3/2.5 | 1,506 (+11%) | 3mo | $319,000 | $212 | 54 |
| 17766 W Banff Ln | 0.52mi | 3/2.5 | 1,499 (+11%) | 4mo | $326,000 | $217 | 52 |
| 17769 W Woodrow Ln | 0.56mi | 3/2.5 | 1,499 (+11%) | 4mo | $322,500 | $215 | 50 |
Match score weights: distance 35% · size 25% · config 20% · recency 20%. Top-matched comps best support the ARV.
Projected returns pro-forma
0.28% appreciation · 0.0% rent growth · sell at horizon
- IRR
- -5.5%
- Equity multiple
- 0.74×
- Total profit
- $-22,235
- Equity at exit
- $92,923
- IRR
- -1.5%
- Equity multiple
- 0.84×
- Total profit
- $-13,742
- Equity at exit
- $115,239
Cash invested: $85,400 (down + closing). Projections, not guarantees.
Landlord ↔ Tenant lean methodology
- Overall (STATE)
- 87 Strongly Landlord-Friendly
- State Arizona
- 87 Strongly Landlord-Friendly · R+3
- County
- — inherits STATE
- City
- — inherits STATE
ZIP-level market 85388
- Home prices YoY
- 0.1%
- Rents YoY
- -0.6%
- Active inventory
- 376
- Price-to-rent
- 11.7×
Monthly cashflow live
- Estimated rent
- $2,168 high interval (Pro) →
- Mortgage (P&I)
- −$1,599
- Tax from tax record
- −$88 /mo · $1,055/yr
- Insurance
- −$127
- HOA
- −$70
- Vacancy / Maint / Mgmt
- −$455
- Net cashflow
- $-172
Break-even live
UW: 25.0% down · 7.5% · 30yr · 1.5% tax · 5.0% vac · 8.0% maint · 8.0% mgmt
Financing live
Cash to close
- Down payment
- $76,250
- Closing costs
- $9,150
- Reserves months
- —
- Total cash needed
- —
Loan-product check · same deal, 3 products live
Conventional
25% down · 7.5% · 30yr
- Down + closing
- —
- Monthly P&I
- —
- Monthly cashflow
- —
- DSCR
- —
- Eligible?
- —
Personal DTI + credit; lowest rate.
DSCR
20% down · 8.5% · 30yr
- Down + closing
- —
- Monthly P&I
- —
- Monthly cashflow
- —
- DSCR
- —
- Eligible?
- —
No personal income docs; deal must DSCR.
Hard money
10% down · 12.0% · 12mo
- Down + closing
- —
- Monthly P&I
- —
- Monthly cashflow
- —
- DSCR
- —
- Eligible?
- —
Short-term bridge; refi at stabilization.
Rent comps 27 comps
| Address | Beds | Baths | Sqft | Rent | $/sqft | DOM | Units | Dist |
|---|---|---|---|---|---|---|---|---|
| 17715 W Redfield Rd Surprise, AZ | 3.0 | 2.0 | 1353 | $2,100 | $1.55 | 5d | 1 | 0.03mi |
| 17520 W Watson Ln Surprise, AZ | 2.0 | 2.0 | 1265 | $1,800 | $1.42 | 5d | 1 | 0.25mi |
| 17863 W Calavar Rd Surprise, AZ | 3.0 | 2.0 | 1615 | $1,750 | $1.08 | 43d | 1 | 0.26mi |
| 17618 W Mandalay Ln Surprise, AZ | 3.0 | 2.0 | 1578 | $1,795 | $1.14 | 43d | 1 | 0.46mi |
| 14743 N 177th Ave Surprise, AZ | 2.0 | 2.5 | 1362 | $1,695 | $1.24 | 21d | 1 | 0.51mi |
| 17746 W Banff Ln Surprise, AZ | 3.0 | 2.5 | 1495 | $1,785 | $1.19 | 43d | 1 | 0.53mi |
| 17730 W Banff Ln Surprise, AZ | 3.0 | 2.5 | 1839 | $2,495 | $1.36 | 24d | 1 | 0.54mi |
| 17724 W Woodrow Ln Surprise, AZ | 3.0 | 2.0 | 1298 | $1,850 | $1.43 | 12d | 1 | 0.60mi |
| 14916 N 177th Ave Surprise, AZ | 3.0 | 2.0 | 1298 | $1,849 | $1.42 | 4d | 1 | 0.62mi |
| 17180 W Sweetwater Ave Surprise, AZ | 1.0–2.0 | 1.0–2.0 | 818 | $1,925 | $2.35 | 2d | 25 | 0.77mi |
| 13500 N Cotton Ln Surprise, AZ | 2.0–4.0 | 2.0 | 1134 | $1,645 | $1.45 | 24d | 388 | 0.79mi |
| 17938 W Port Royale Ln Surprise, AZ | 3.0 | 2.0 | 1775 | $2,149 | $1.21 | 5d | 1 | 0.80mi |
| 14945 N 172nd Ln Surprise, AZ | 4.0 | 2.0 | 1699 | $2,099 | $1.24 | 5d | 1 | 0.81mi |
| 17923 W Port au Prince Ln Surprise, AZ | 3.0 | 2.0 | 1610 | $1,900 | $1.18 | 43d | 1 | 0.86mi |
| 17218 W Country Gables Dr Surprise, AZ | 3.0 | 2.0 | 1502 | $1,800 | $1.20 | 11d | 1 | 0.90mi |
| 17862 W Caribbean Ln Surprise, AZ | 3.0 | 2.0 | 1766 | $2,600 | $1.47 | 18d | 1 | 0.92mi |
| 17176 W Corrine Dr Surprise, AZ | 4.0 | 2.0 | 1685 | $2,000 | $1.19 | 21d | 1 | 0.99mi |
| 17867 W Westpark Blvd Surprise, AZ | 4.0 | 2.0 | 1767 | $3,500 | $1.98 | 43d | 1 | 1.13mi |
| 17190 W Desert Ln Surprise, AZ | 3.0 | 2.0 | 1506 | $1,699 | $1.13 | 23d | 1 | 1.17mi |
| 12350 N Cotton Ln Surprise, AZ | 1.0–3.0 | 1.0–2.0 | 977 | $2,479 | $2.54 | 1d | 1 | 1.18mi |
| 17244 W Vacaville St Surprise, AZ | 2.0 | 2.0 | 1530 | $2,995 | $1.96 | 24d | 1 | 1.29mi |
| 18184 W Saguaro Ln Surprise, AZ | 3.0 | 2.0 | 1682 | $1,895 | $1.13 | 24d | 1 | 1.35mi |
| 17714 W Marshall Ln Surprise, AZ | 3.0 | 2.0 | 1407 | $1,485 | $1.06 | 18d | 1 | 1.36mi |
| 17722 W Marshall Ln Surprise, AZ | 4.0 | 2.0 | 1756 | $2,185 | $1.24 | 1d | 1 | 1.36mi |
| 17794 W Rimrock St Surprise, AZ | 3.0 | 2.0 | 1407 | $1,800 | $1.28 | 43d | 1 | 1.41mi |
| 17009 W Marconi Ave Surprise, AZ | 3.0 | 2.0 | 1419 | $1,862 | $1.31 | 43d | 1 | 1.44mi |
| 15927 N 171st Dr Surprise, AZ | 3.0 | 2.0 | 1670 | $3,200 | $1.92 | 43d | 1 | 1.44mi |
HOA detail
- Monthly dues
- $70 · $840/yr
Listing history 10 events
-
2026-06-15days on market $305,000 Active 33 DOM
-
2026-06-13days on market $305,000 Active 31 DOM
-
2026-06-09days on market $305,000 Active 27 DOM
-
2026-06-08days on market $305,000 Active 26 DOM
-
2026-06-07days on market $305,000 Active 25 DOM
-
2026-06-04days on market $305,000 Active 22 DOM
-
2026-06-03days on market $305,000 Active 21 DOM
-
2026-06-02days on market $305,000 Active 20 DOM
-
2026-06-01days on market $305,000 Active 19 DOM
-
2026-05-31days on market $305,000 Active 18 DOM
ⓘ Source: listings_history table (triggers on properties + properties_extension) + one-shot
backfill from property_details.listing_events for pre-trigger history.
Tax reassessment forecast AZ · Resets to sale price
- Current annual tax
- $1,055 · $88/mo
- Projected year-2 tax
- $2,013 · $168/mo
- Expected delta
- +$958/yr (+$80/mo · 90.7%)
ⓘ Screening estimate from a state-policy table — verify with the county assessor before closing.
Climate risk First Street
- Flood 1/10 Low FEMA zone X (shaded) · 0% chance over 30 yrs
- Wildfire 6/10 Major
- Heat 9/10 Extreme 6 d/yr ≥112°F today · 16 d/yr by 30 yrs out
- Wind 1/10 Low
- Air quality 2/10 Low 1 unhealthy d/yr today · 1 by 30 yrs out
Nearby sold comps map
Loading sold comps map…
Walkable amenities ~0.75 mi
Loading nearby amenities…
Taxation est. · year 1
- Rental income
- $26,013
- − Mortgage interest
- −$17,085
- − Property taxes
- −$1,055
- − Insurance
- −$1,525
- − Repairs & maintenance
- −$2,081
- − Management
- −$2,081
- − HOA
- −$840
- − Depreciation
- −$8,873
- Taxable loss
- −$7,527
- Est. tax savings @ 24.0%
- +$1,807
- After-tax cash flow
- $-257/yr
For passive investors: Depreciation is non-cash, so a rental often shows a tax loss while cash-flowing — sheltering income. Rental losses are passive: they offset passive income freely, and up to $25,000/yr can offset ordinary (W-2) income if you actively participate and your MAGI is under $100k (phasing out to $0 by $150k); unused losses carry forward. On sale, claimed depreciation is recaptured at up to 25%, and gains may owe capital-gains tax (a 1031 exchange can defer both). Figures are a year-1 estimate at your 24.0% rate — not tax advice; consult a CPA.
Schools (NCES district)
- District
- Dysart Unified District (4243)
- NCES district ID
- 0402690
- Math proficiency
- 34% ▼ -10.00%
- Reading proficiency
- 40% ▼ -5.00%
- Median HH income
- $58,033
- Composite
- 32.76/100
- National rank
- #5634
- State rank
- #73 of 249 in AZ
Livability — Surprise
- Score
- 74/100
- State rank
- #19
- US rank
- #4616
Category grades
Schools grade is shown separately in the Schools card above.
Census & demographics
- Census place
- Surprise, AZ
- County
- Maricopa County · 4,537,380 people
- City population
- 160,031
- Metro
- Phoenix-Mesa-Chandler, AZ
- Population (ZIP)
- 35,369
- Household income
- $112,164
- Rent vs Own
- Severe rent burden
- 224.0
Population outlook (Maricopa County) Hauer SSP2
- Today (2025)
- 4,979,203 people
- By 2030
- 5,378,229 · +8.0%
- By 2040
- 6,156,598 · +23.6%
- By 2050
- 6,872,376 · +38.0%
- By 2075
- 8,401,270 · +68.7%
- By 2100
- 9,247,439 · +85.7%
Race, ethnicity, and origin ACS 2023
- Neighborhood character
- Diverse neighborhood (Simpson 0.57)
- Race & ethnicity
- White 61% Hispanic / Latino 22% Two or more races 12% Black 6% Asian 2% Native American 1%
- Hispanic origin (detail)
- Mexican 16%
- Common ancestry
- Romanian 3% Italian 3% Portuguese 2%
- Foreign-born
- 8% · Canada
- Languages at home
- 88% English-only · Spanish 7% Russian/Polish/Slavic 2% Tagalog/Filipino 1%
Political lean MEDSL · Maricopa
- 2024 margin
- Toss-up / Even · D 47.7% · R 51.2% · Other 1.1%
- 2008→2024 swing
- +7.1pp toward D · 2008: -10.6pp · 2024: -3.5pp
- All cycles
- 2024: R+3.5 2020: D+2.2 2016: R+3.5 2012: R+12.0 2008: R+10.6
Not yet ingested
- Civics
- —
Market trends
- HPI YoY
- ▲ 0.28%
- Current HPI
- 272.9859
- Rent YoY
- ▼ -0.57%
- Metro
- Phoenix-Mesa-Chandler, AZ
- State GDP YoY
- ▲ 4.54%
- F500 in state
- 20
Industry mix (Fortune 500 HQ in AZ)
| Industry | F500 HQs | Revenue |
|---|---|---|
| Technology | 2 | $13B |
|
||
| Mining / Metals | 1 | $23B |
|
||
| Environmental Services | 1 | $16B |
|
||
| Metals / Steel | 1 | $14B |
|
||
| Technology Distribution | 1 | $9B |
|
||
| Homebuilding | 1 | $8B |
|
||
Price history
+27.1% since first listed25 events — show timeline
- 2026-05-29 Relisted — ARMLS
- 2026-04-01 Pending — ARMLS
- 2026-04-01 Listing Removed — ARMLS
- 2026-03-16 Listed $305,000 ARMLS
- 2024-05-01 Listing Removed — ARMLS
- 2024-03-03 Price Changed $367,000 ARMLS
- 2024-01-27 Price Changed $373,000 ARMLS
- 2023-11-20 Price Changed $376,900 ARMLS
- 2023-10-04 Listed $385,000 ARMLS
- 2022-11-11 Sold (MLS) $350,000 ARMLS
- 2022-11-09 Sold (Public Records) $350,000 Public Records
- 2022-10-13 Contingent — ARMLS
- 2022-10-07 Price Changed $350,000 ARMLS
- 2022-10-07 Price Changed $360,000 ARMLS
- 2022-10-01 Price Changed $385,000 ARMLS
- 2022-09-10 Listed $399,900 ARMLS
- 2020-07-31 Sold (Public Records) $242,000 Public Records
- 2020-07-31 Sold (MLS) $242,000 ARMLS
- 2020-05-23 Pending — ARMLS
- 2020-05-23 Relisted — ARMLS
- 2020-05-19 Listing Removed — ARMLS
- 2020-05-16 Relisted — ARMLS
- 2020-05-15 Listing Removed — ARMLS
- 2020-01-31 Contingent — ARMLS
- 2020-01-21 Listed $239,900 ARMLS
Property tax history
-0.2%/yrLatest (2025): $1,055 · +1.8% YoY. Source: county tax records.
Cash-flow waterfall
monthlySold comps — $/sqft
last 12 mo · ≤1 miLoading sold comps…