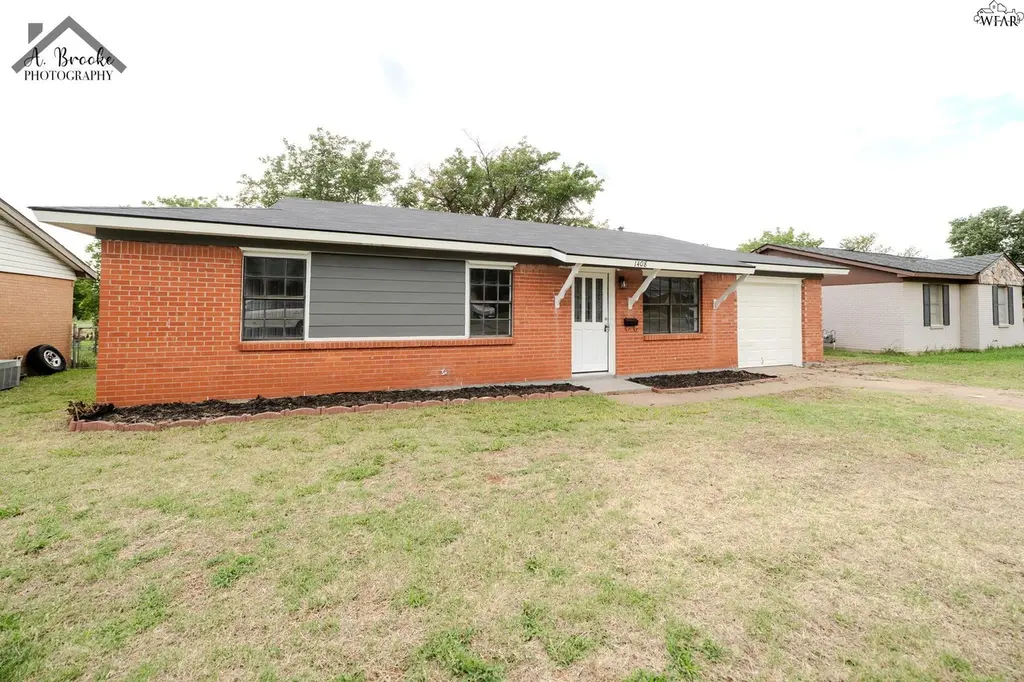
1408 Covington St · Wichita Falls, TX
Flood risk 1/10 · Minimal
- FEMA flood zone
- X (unshaded)
- Chance of flooding over 30 yrs
- 0.0%
- Est. flood insurance / yr
- $507 – $1,088
Fire risk 8/10 · Major
- Est. fire insurance / yr
- $1,222 – $2,270
Heat risk 7/10 · Major
- Hot days now (above 109°F)
- 7 days/yr
- Hot days in 30 yrs
- 20 days/yr
Wind risk 4/10 · Minor
- Chance of severe wind over 30 yrs
- 9.0%
Air-quality risk 1/10 · Minimal
- Unhealthy air days now
- 0 days/yr
- Unhealthy air days in 30 yrs
- 0 days/yr
Risk factors via First Street. Map © Google.
Why this score? — see what drove the F grade
The composite is a weighted blend of 9 inputs, each scored 0–100. Each bar is that input's sub-score; the figure is the points it added to the 100-point composite (weight × sub-score).
- Cash flow +13.3/30.0
- 1% rule +4.2/10.0
- DSCR +4.0/10.0
- Livability +3.5/5.0
- Schools +3.4/10.0
- Rent growth +3.2/5.0
- Condition / age +2.5/5.0
- ARV discount +0.0/15.0
- Appreciation +0.0/10.0
$129,900
🖨 Deal sheet 📄 Offer letter ✓ Due diligence
Listing remarks
Welcome home to this beautifully updated 2 bed 1 bath home in City View. This charming property features a 1 car attached garage, a brand new roof, and all new flooring and paint throughout! Enjoy the updated fixtures and new kitchen! Step outside to enjoy your large decked patio, and mature trees perfect for relaxing or entertaining!
Key facts
- New floors
- Double closet space
- New kitchen
Tags
Property features AI
Finance
- Other: Located in the Sunset Terrace subdivision; Zoned for single-family residential
Exterior
- Parking: Attached garage
- Utilities: Public water; Public sewer
- Home design: Single-family residence; Residential property; One story; Faces northeast
- Construction: Brick and wood siding construction; Slab foundation
- Exterior features: Patio; Composition roof
Interior
- Kitchen: Gas cooktop; Gas oven; Microwave
- Flooring: Tile
- Heating & cooling: Central air conditioning
- Interior features: Tile flooring; Gas cooktop, Gas oven, Microwave
Neighborhood map
What this means for you Summary
Snapshot
- This is a 2-bed/1.0-bath single-family listed at $130k.
Deal economics
- At list price, monthly cash flow is $1 ($14/yr) — positive.
- The deal already cash-flows at list — no discount required.
- To meet the 1% rule (rent ≥ 1% of price), the offer needs to be $119k (8.5% below list).
- Recommended offer: $119k (8.5% below list) — sets the bar for 1% rule.
- Cap rate 6.3% vs local median 4.7% in Wichita Falls — top-decile yield for the area; either an underpriced asset or a hidden risk that comps aren't pricing in. Stress-test before assuming the spread holds.
Location & tenants
- Location reads 69/100 on livability (#437 in TX) — a middle-class / working-renter tenant base. Strengths: cost of living A+, housing A+; Watch: health & safety C-, employment D+, crime D.
- City View ISD (urban): math 40% / reading 39% proficiency, ranked #429 of 826 in TX (top 52%) — families likely to look elsewhere, expect single-tenant / working-renter base with shorter leases.
- Zoned schools: City View El (math 39% / reading 37%, grade F, #1,709 of 4,322 statewide, top 40%, 502 students, 78% FRL); City View Junior/Senior High (math 42% / reading 40%, grade F, #774 of 1,632 statewide, top 49%, 627 students, 70% FRL) — zoned schools average 74% FRL vs 56% district-wide (17 pts higher); higher-poverty schools than district average — tighter screening recommended.
- Market conditions: Rents rising (+2.8%/yr); 114 active listings in the ZIP; 4 comparable units currently listed for rent nearby; rentals lingering (median 44d on market — plan ~5-8 weeks vacancy on turnover, expect pricing pressure); 100% of comp listings sitting > 30 days — soft ceiling on asking rent; 231 units permitted in Wichita County in 2024 (10 in 5+ unit buildings).
- This rent runs 30% of the median local income ($47k/yr) — at the standard rent-burdened threshold; future hikes will face affordability resistance.
Forward outlook
- Local home prices are declining (-3.0%/yr); year-one equity from $898 of loan paydown is wiped out by about $4k of value loss. Plan a longer hold.
- Wichita County population projected to shrink 7% by 2050 — rents likely to lag national; underwrite the cash flow, not the appreciation.
Negotiation context
- Only 7 days on market — expect competitive offers; lowballing is unlikely to land.
Risks & watch-outs
- Climate carrying-cost: severe wildfire risk; extreme-heat days projected 7→20/yr by 2055 (HVAC capex compounding) — expect insurance premiums to compound above CPI over the hold.
Questions for the listing agent
- Built in 1960 — when were the roof, HVAC, electrical panel, plumbing, and water heater last replaced?
- Is there a deadline driving the sale (1031 exchange, divorce, estate, relocation)? That informs how much negotiation room exists.
- Schools are D-rated, which usually means shorter tenancies and higher turnover. Who's the typical renter profile here, and what's been the actual vacancy rate?
- Crime grade is D in this area — have there been break-ins, vandalism, or insurance claims at this property in the last 3 years? What carrier currently insures it and at what premium?
- The area grade is low — what's the realistic commute time and amenity access for the typical tenant pool here? Any planned neighborhood developments (good or bad) we should know about?
- What's the average days-on-market for RENTAL listings here right now (not sales)? A rising rental-DOM trend means longer vacancies and softer asking-rent achievability than the comps imply.
- What's the recent tenant-quality profile in this submarket — average credit score on applications, eviction rate, late-payment / NSF rate, and stable-employment percentage? A property-management company in the area should have these aggregated.
- How much new for-sale + rental construction is in the pipeline within 1–3 miles? Heavy new supply typically softens prices + rents 12–24 months out; constrained supply supports both.
Investment metrics
- 1% rule
- 0.92% ✗
- Cap rate
- 6.30%
- Cash-on-cash
- 0.04%
- DSCR
- 1.00
- GRM
- 9.1
CMA / ARV
- ARV (on-the-fly)
- $104,058
- Comps found
- 3
Show comp detail 3 sales within ~0.75 mi
| Address | Dist | Beds/Ba | Sqft | Sold | Price | $/sf | Match |
|---|---|---|---|---|---|---|---|
| 1406 E Cortez Dr | 0.16mi | 3/1.0 (+1) | 1,196 (-6%) | 11mo | $89,900 | $75 | 68 |
| 1432 Deville St | 0.27mi | 3/1.0 (+1) | 1,218 (-4%) | 10mo | $145,000 | $119 | 67 |
| 4300 Viewpark | 0.49mi | 3/2.0 (+1) | 1,153 (-9%) | 21mo | $94,900 | $82 | 35 |
Match score weights: distance 35% · size 25% · config 20% · recency 20%. Top-matched comps best support the ARV.
Projected returns pro-forma
-3.0% appreciation · 2.81% rent growth · sell at horizon
- IRR
- -16.4%
- Equity multiple
- 0.42×
- Total profit
- $-21,160
- Equity at exit
- $19,369
- IRR
- -8.5%
- Equity multiple
- 0.48×
- Total profit
- $-19,084
- Equity at exit
- $11,231
Cash invested: $36,372 (down + closing). Projections, not guarantees.
Landlord ↔ Tenant lean methodology
- Overall (STATE)
- 87 Strongly Landlord-Friendly
- State Texas
- 87 Strongly Landlord-Friendly · R+5
- County
- — inherits STATE
- City
- — inherits STATE
ZIP-level market 76306
- Home prices YoY
- -30.1%
- Rents YoY
- 2.8%
- Active inventory
- 114
- Price-to-rent
- 9.1×
Monthly cashflow live
- Estimated rent
- $1,189 medium interval (Pro) →
- Mortgage (P&I)
- −$681
- Tax from tax record
- −$203 /mo · $2,434/yr
- Insurance
- −$54
- HOA
- −$0
- Vacancy / Maint / Mgmt
- −$250
- Net cashflow
- $1
Break-even live
UW: 25.0% down · 7.5% · 30yr · 1.5% tax · 5.0% vac · 8.0% maint · 8.0% mgmt
Financing live
Cash to close
- Down payment
- $32,475
- Closing costs
- $3,897
- Reserves months
- —
- Total cash needed
- —
Loan-product check · same deal, 3 products live
Conventional
25% down · 7.5% · 30yr
- Down + closing
- —
- Monthly P&I
- —
- Monthly cashflow
- —
- DSCR
- —
- Eligible?
- —
Personal DTI + credit; lowest rate.
DSCR
20% down · 8.5% · 30yr
- Down + closing
- —
- Monthly P&I
- —
- Monthly cashflow
- —
- DSCR
- —
- Eligible?
- —
No personal income docs; deal must DSCR.
Hard money
10% down · 12.0% · 12mo
- Down + closing
- —
- Monthly P&I
- —
- Monthly cashflow
- —
- DSCR
- —
- Eligible?
- —
Short-term bridge; refi at stabilization.
Rent comps 4 comps
| Address | Beds | Baths | Sqft | Rent | $/sqft | DOM | Units | Dist |
|---|---|---|---|---|---|---|---|---|
| 1450 Kinsale Ct Wichita Falls, TX | 3.0 | 1.0 | 1146 | $1,300 | $1.13 | 43d | 1 | 0.27mi |
| 1200 Ridgeway Dr Wichita Falls, TX | 1.0–3.0 | 1.0–2.0 | 889 | $895 | $1.01 | 43d | 5 | 0.99mi |
| 2801 Roanoke Dr Unit B Wichita Falls, TX | 3.0 | 2.0 | 876 | $990 | $1.13 | 43d | 1 | 1.02mi |
| 115 Becky Dr Unit 115 Wichita Falls, TX | 3.0 | 2.0 | 924 | $875 | $0.95 | 43d | 1 | 1.07mi |
Listing history 7 events
-
2026-06-19days on market $129,900 Active 7 DOM
-
2026-06-18days on market $129,900 Active 6 DOM
-
2026-06-17days on market $129,900 Active 5 DOM
-
2026-06-16days on market $129,900 Active 4 DOM
-
2026-06-15days on market $129,900 Active 3 DOM
-
2026-06-13remarks 336-char remark
-
2026-06-13$129,900 Active 1 DOM
ⓘ Source: listings_history table (triggers on properties + properties_extension) + one-shot
backfill from property_details.listing_events for pre-trigger history.
Tax reassessment forecast TX · Resets to sale price
- Current annual tax
- $2,434 · $203/mo
- Projected year-2 tax
- $2,434 · $203/mo
- Expected delta
- $0/yr ($0/mo · 0.0%)
ⓘ Screening estimate from a state-policy table — verify with the county assessor before closing.
Climate risk First Street
- Flood 1/10 Low FEMA zone X (unshaded) · 0% chance over 30 yrs
- Wildfire 8/10 Severe
- Heat 7/10 Severe 7 d/yr ≥109°F today · 20 d/yr by 30 yrs out
- Wind 4/10 Moderate 9% chance of damaging wind over 30 yrs
- Air quality 1/10 Low 0 unhealthy d/yr today · 0 by 30 yrs out
Nearby sold comps map
Loading sold comps map…
Walkable amenities ~0.75 mi
Loading nearby amenities…
Taxation est. · year 1
- Rental income
- $14,269
- − Mortgage interest
- −$7,276
- − Property taxes
- −$2,434
- − Insurance
- −$650
- − Repairs & maintenance
- −$1,141
- − Management
- −$1,141
- − Depreciation
- −$3,779
- Taxable loss
- −$2,154
- Est. tax savings @ 24.0%
- +$517
- After-tax cash flow
- $531/yr
For passive investors: Depreciation is non-cash, so a rental often shows a tax loss while cash-flowing — sheltering income. Rental losses are passive: they offset passive income freely, and up to $25,000/yr can offset ordinary (W-2) income if you actively participate and your MAGI is under $100k (phasing out to $0 by $150k); unused losses carry forward. On sale, claimed depreciation is recaptured at up to 25%, and gains may owe capital-gains tax (a 1031 exchange can defer both). Figures are a year-1 estimate at your 24.0% rate — not tax advice; consult a CPA.
Schools (NCES district)
- District
- City View ISD
- NCES district ID
- 4814130
- Math proficiency
- 40% ▲ 3.00%
- Reading proficiency
- 39% ▬ 0.00%
- Median HH income
- $46,360
- Composite
- 33.74/100
- National rank
- #5372
- State rank
- #429 of 826 in TX
Livability — Wichita Falls
- Score
- 69/100
- State rank
- #437
- US rank
- #8940
Category grades
Schools grade is shown separately in the Schools card above.
Census & demographics
- Census place
- Wichita Falls, TX
- County
- Wichita County · 95,694 people
- City population
- 95,694
- Metro
- Wichita Falls, TX
- Population (ZIP)
- 13,963
- Household income
- $46,957
- Rent vs Own
- Severe rent burden
- 235.0
Population outlook (Wichita County) Hauer SSP2
- Today (2025)
- 129,638 people
- By 2030
- 128,366 · -1.0%
- By 2040
- 124,466 · -4.0%
- By 2050
- 120,499 · -7.0%
- By 2075
- 113,884 · -12.2%
- By 2100
- 101,818 · -21.5%
Race, ethnicity, and origin ACS 2023
- Neighborhood character
- Diverse neighborhood (Simpson 0.59)
- Race & ethnicity
- White 58% Hispanic / Latino 21% Black 16% Two or more races 9% Asian 2%
- Hispanic origin (detail)
- Mexican 18% Cuban 1%
- Common ancestry
- Italian 2% Serbian 1% Slovak 1%
- Foreign-born
- 6% · Canada
- Languages at home
- 88% English-only · Spanish 8% Tagalog/Filipino 1%
Political lean MEDSL · Wichita
- 2024 margin
- Solid R (+44.0) · D 27.5% · R 71.5%
- 2008→2024 swing
- -5.2pp toward R · 2008: -38.9pp · 2024: -44.0pp
- All cycles
- 2024: R+44.0 2020: R+41.1 2016: R+49.7 2012: R+47.1 2008: R+38.9
Not yet ingested
- Civics
- —
Market trends
- HPI YoY
- ▼ -71.29%
- Current HPI
- 165.6314
- Rent YoY
- ▲ 2.81%
- Metro
- Wichita Falls, TX
- State GDP YoY
- ▲ 3.95%
- F500 in state
- 110
Industry mix (Fortune 500 HQ in TX)
| Industry | F500 HQs | Revenue |
|---|---|---|
| Energy | 16 | $1,198B |
|
||
| Technology | 5 | $198B |
|
||
| Engineering / Construction | 4 | $72B |
|
||
| Energy Services | 3 | $60B |
|
||
| Utilities | 3 | $41B |
|
||
| Healthcare | 2 | $330B |
|
||
Price history
3 events — show timeline
- 2026-06-12 Listed $129,900 WFAOR
- 2008-08-27 Sold (Public Records) — Public Records
- 2004-07-09 Sold (Public Records) — Public Records
Property tax history
+3.8%/yrLatest (2025): $2,434 · +1.5% YoY. Source: county tax records.
Cash-flow waterfall
monthlySold comps — $/sqft
last 12 mo · ≤1 miLoading sold comps…