 Duplex
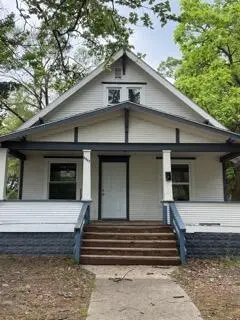
2541 Jefferson St · Muskegon Heights, MI
Flood risk 1/10 · Minimal
- FEMA flood zone
- X (unshaded)
- Chance of flooding over 30 yrs
- 0.0%
- Est. flood insurance / yr
- $473 – $860
Fire risk 1/10 · Minimal
- Est. fire insurance / yr
- $784 – $1,456
Heat risk 1/10 · Minimal
- Hot days now (above 93°F)
- 7 days/yr
- Hot days in 30 yrs
- 14 days/yr
Wind risk 1/10 · Minimal
- Chance of severe wind over 30 yrs
- —
Air-quality risk 4/10 · Minor
- Unhealthy air days now
- 4 days/yr
- Unhealthy air days in 30 yrs
- 6 days/yr
Risk factors via First Street. Map © Google.
Why this score? — see what drove the C- grade
The composite is a weighted blend of 9 inputs, each scored 0–100. Each bar is that input's sub-score; the figure is the points it added to the 100-point composite (weight × sub-score).
- Cash flow +20.7/30.0
- ARV discount +7.5/15.0
- DSCR +6.6/10.0
- 1% rule +5.5/10.0
- Schools +5.0/10.0
- Livability +3.1/5.0
- Rent growth +2.5/5.0
- Condition / age +2.5/5.0
- Appreciation +0.0/10.0
$159,900
🖨 Deal sheet (PDF) 📄 Offer letter ✓ Due diligence
Multi-family units
County records classify this as Multi-Family (2-4 Unit). Listing-text estimate: 2 units. confirmed
Listing remarks MLS
Attention cash or commercial investors! Instant cash flowing duplex is remodeled & ready to go! Many major and minor upgrades in 2021 including all new vinyl double-hung windows, new furnace, new water heater, repainted interior, new plumbing, carpeting, fixtures, blinds etc. Each unit boasts a private entrance, updated kitchen, dining room, living room, private gas, & electric. 2 BR market rent is $855 per month per unit, or $940 including utilities so easy cash flow here. Can be leased for you prior to or after closing if desired but is vacant currently for easy showings. Located just a block from both the elementary and high schools. Owner is an entity partially owned by a licensed real estate broker in Michigan. No offer deadline. Possession at closing. Set appt today!
Key facts
- Fresh paint
- Updated windows
- Updated flooring
Tags
Property features AI
Finance
- Other: Located near corner of Sherman and Jefferson in Muskegon Heights (mailing city: Muskegon)
- Financial info: Multi-family with 2 total units; Unit rents listed at $1,000 and $1,000
- HOA & community: Landlord/association pays water and sewer; Landlord/association pays trash removal
Exterior
- Utilities: Natural gas; Water and sewer service (landlord/association pays); Trash removal (landlord/association pays)
- Home design: Multi-family property; Built in 1935
- Construction: Wood construction; Basement foundation; Built in 1935
- Exterior features: Wood exterior; Basement foundation; Road access via city/county paved streets; Frontage of 50 feet; Lot is approximately 0.14 acres
Interior
- Heating & cooling: Wall heating; Forced air heating; No cooling system; Natural gas fuel
- Interior features: Sidewalks on the lot
Neighborhood map
What this means for you Summary
Snapshot
- This is a 2 × 2-bed/1.0-bath units multifamily listed at $160k.
Deal economics
- At list price, monthly cash flow is $218 ($3k/yr) — positive. Per door: $109/mo.
- The deal already cash-flows at list — no discount required.
- Meets the 1% rule at list price ($2k rent vs $160k).
Location & tenants
- Location reads 61/100 on livability (#574 in MI) — a middle-class / working-renter tenant base. Strengths: cost of living A+, housing A; Watch: schools D+, crime F, amenities F.
- Market conditions: 237 active listings in the ZIP; 4 comparable units currently listed for rent nearby; rentals at typical pace (median 22d on market — plan ~3-4 weeks tenant-placement turnaround); 438 units permitted in Muskegon County in 2024 (115 in 5+ unit buildings).
- This rent runs 38% of the median local income ($53k/yr) — at the standard rent-burdened threshold; future hikes will face affordability resistance.
Forward outlook
- Local home prices are declining (-3.0%/yr); year-one equity from $1k of loan paydown is wiped out by about $5k of value loss. Plan a longer hold.
- Muskegon County population projected to shrink 8% by 2050 — rents likely to lag national; underwrite the cash flow, not the appreciation.
Negotiation context
- Only 5 days on market — expect competitive offers; lowballing is unlikely to land.
- 20 sale attempts since 27y ago with the ask held roughly flat each time — persistent listings suggest the price (not the market) is what's stuck; bring a comps-based counter.
- Current owner paid $118k; 36% above their basis — modest negotiation headroom, anchor on the comps not their cost.
Risks & watch-outs
- Watch-outs: built in 1935 — expect roof / HVAC / electrical / plumbing capex.
Questions for the listing agent
- Can we see the unit-by-unit rent roll, current vacancy, and any below-market leases? What's the average tenancy length?
- What capital expenditures (roof, boiler, parking lot, exteriors) have been made in the last 5 years, and what's planned in the next 2?
- Built in 1935 — when were the roof, HVAC, electrical panel, plumbing, and water heater last replaced?
- Is there a deadline driving the sale (1031 exchange, divorce, estate, relocation)? That informs how much negotiation room exists.
- Schools are D-rated, which usually means shorter tenancies and higher turnover. Who's the typical renter profile here, and what's been the actual vacancy rate?
- Crime grade is F in this area — have there been break-ins, vandalism, or insurance claims at this property in the last 3 years? What carrier currently insures it and at what premium?
- What's the average days-on-market for RENTAL listings here right now (not sales)? A rising rental-DOM trend means longer vacancies and softer asking-rent achievability than the comps imply.
- What's the recent tenant-quality profile in this submarket — average credit score on applications, eviction rate, late-payment / NSF rate, and stable-employment percentage? A property-management company in the area should have these aggregated.
- How much new apartment / multifamily construction is in the pipeline within 1–3 miles? Heavy new supply (>2% of stock underway) typically softens rents 12–24 months out; light construction supports rent growth.
Investment metrics
- 1% rule
- 1.05% ✓
- Cap rate
- 7.93%
- Cash-on-cash
- 5.84%
- DSCR
- 1.26
- GRM
- 8.0
CMA / ARV
- ARV (on-the-fly)
- $100,188
- Comps found
- 1
Show comp detail 1 sale within ~0.75 mi
| Address | Dist | Beds/Ba | Sqft | Sold | Price | $/sf | Match |
|---|---|---|---|---|---|---|---|
| 2936 Sanford St | 0.51mi | 4/2.0 | 1,568 (+8%) | 3mo | $107,900 | $69 | 60 |
Match score weights: distance 35% · size 25% · config 20% · recency 20%. Top-matched comps best support the ARV.
Projected returns pro-forma
-3.0% appreciation · 3.0% rent growth · sell at horizon
- IRR
- -7.3%
- Equity multiple
- 0.73×
- Total profit
- $-12,019
- Equity at exit
- $23,842
- IRR
- 2.3%
- Equity multiple
- 1.17×
- Total profit
- $7,492
- Equity at exit
- $13,825
Cash invested: $44,772 (down + closing). Projections, not guarantees.
Landlord ↔ Tenant lean methodology
- Overall (STATE)
- 62 Landlord-Friendly
- State Michigan
- 62 Landlord-Friendly · EVEN
- County
- — inherits STATE
- City
- — inherits STATE
ZIP-level market 49444
- Active inventory
- 237
- Price-to-rent
- 15.9×
Monthly cashflow live
- Estimated rent
- $1,674 high interval (Pro) →
- Mortgage (P&I)
- −$839
- Tax from tax record
- −$200 /mo · $2,395/yr
- Insurance
- −$67
- HOA
- −$0
- Vacancy / Maint / Mgmt
- −$352
- Net cashflow
- $218
Break-even live
Sensitivity live
| Price | -10% $308 | -5% $263 | +0% $218 | +5% $172 | +10% $127 |
|---|---|---|---|---|---|
| Rent | -10% $85 | -5% $152 | +0% $218 | +5% $284 | +10% $350 |
| Rate | -1.0pp $298 | -0.5pp $258 | base $218 | +0.5pp $176 | +1.0pp $134 |
2-unit breakdown (identical units grouped — click to expand)
| Units | Beds | Baths | Est. rent |
|---|---|---|---|
| 2× units | 2 | 1 | $1,674 |
| #1 | 2 | 1 | $837 |
| #2 | 2 | 1 | $837 |
| Total (2 units) | $1,674 | ||
UW: 25.0% down · 7.5% · 30yr · 1.5% tax · 5.0% vac · 8.0% maint · 8.0% mgmt
Financing live
Cash to close
- Down payment
- $39,975
- Closing costs
- $4,797
- Reserves months
- —
- Total cash needed
- —
Loan-product check · same deal, 3 products live
Conventional
25% down · 7.5% · 30yr
- Down + closing
- —
- Monthly P&I
- —
- Monthly cashflow
- —
- DSCR
- —
- Eligible?
- —
Personal DTI + credit; lowest rate.
DSCR
20% down · 8.5% · 30yr
- Down + closing
- —
- Monthly P&I
- —
- Monthly cashflow
- —
- DSCR
- —
- Eligible?
- —
No personal income docs; deal must DSCR.
Hard money
10% down · 12.0% · 12mo
- Down + closing
- —
- Monthly P&I
- —
- Monthly cashflow
- —
- DSCR
- —
- Eligible?
- —
Short-term bridge; refi at stabilization.
Rent comps 4 comps
| Address | Beds | Baths | Sqft | Rent | $/sqft | DOM | Units | Dist |
|---|---|---|---|---|---|---|---|---|
| 2073 Dowd St Muskegon, MI | 3.0 | 2.5 | 1228 | $1,750 | $1.43 | 21d | 1 | 1.25mi |
| 2065 Dowd St Muskegon, MI | 3.0 | 2.0 | 1228 | $1,695 | $1.38 | 21d | 1 | 1.26mi |
| 1644 Beidler St Muskegon, MI | 3.0 | 2.0 | 1228 | $1,700 | $1.38 | 21d | 1 | 1.41mi |
| 80 E Grand Ave Muskegon, MI | 3.0 | 1.5 | 1200 | $1,300 | $1.08 | 21d | 1 | 1.44mi |
Listing history 9 events
-
2026-06-19days on market $159,900 Active 5 DOM
-
2026-06-18days on market $159,900 Active 4 DOM
-
2026-06-17days on market $159,900 Active 3 DOM
-
2026-06-16days on market $159,900 Active 2 DOM
-
2026-06-15remarks 405-char remark
-
2026-06-15days on market $159,900 Active 1 DOM
-
2026-06-15days on market $159,900 Active 2 DOM
-
2026-06-14remarks 403-char remark
-
2026-06-14$159,900 Active 1 DOM
ⓘ Source: listings_history table (triggers on properties + properties_extension) + one-shot
backfill from property_details.listing_events for pre-trigger history.
Tax reassessment forecast MI · Partial reset (capped growth)
- Current annual tax
- $2,395 · $200/mo
- Projected year-2 tax
- $2,429 · $202/mo
- Expected delta
- +$34/yr (+$3/mo · 1.4%)
ⓘ Screening estimate from a state-policy table — verify with the county assessor before closing.
Climate risk First Street
- Flood 1/10 Low FEMA zone X (unshaded) · 0% chance over 30 yrs
- Wildfire 1/10 Low
- Heat 1/10 Low 7 d/yr ≥93°F today · 14 d/yr by 30 yrs out
- Wind 1/10 Low
- Air quality 4/10 Moderate 4 unhealthy d/yr today · 6 by 30 yrs out
Nearby sold comps map
Loading sold comps map…
Walkable amenities ~0.75 mi
Loading nearby amenities…
Taxation est. · year 1
- Rental income
- $20,088
- − Mortgage interest
- −$8,957
- − Property taxes
- −$2,395
- − Insurance
- −$800
- − Repairs & maintenance
- −$1,607
- − Management
- −$1,607
- − Depreciation
- −$4,652
- Taxable income
- $71
- Est. tax owed @ 24.0%
- −$17
- After-tax cash flow
- $2,596/yr
For passive investors: Depreciation is non-cash, so a rental often shows a tax loss while cash-flowing — sheltering income. Rental losses are passive: they offset passive income freely, and up to $25,000/yr can offset ordinary (W-2) income if you actively participate and your MAGI is under $100k (phasing out to $0 by $150k); unused losses carry forward. On sale, claimed depreciation is recaptured at up to 25%, and gains may owe capital-gains tax (a 1031 exchange can defer both). Figures are a year-1 estimate at your 24.0% rate — not tax advice; consult a CPA.
Schools (NCES district)
No district data.
Livability — Muskegon Heights
- Score
- 61/100
- State rank
- #574
- US rank
- #18269
Category grades
Schools grade is shown separately in the Schools card above.
Census & demographics
- Census place
- Muskegon Heights, MI
- County
- Muskegon County · 107,917 people
- Metro
- Muskegon, MI
- Population (ZIP)
- 26,372
- Household income
- $53,054
- Rent vs Own
- Severe rent burden
- 930.0
Population outlook (Muskegon County) Hauer SSP2
- Today (2025)
- 174,032 people
- By 2030
- 173,365 · -0.4%
- By 2040
- 168,877 · -3.0%
- By 2050
- 160,306 · -7.9%
- By 2075
- 134,426 · -22.8%
- By 2100
- 98,836 · -43.2%
Race, ethnicity, and origin ACS 2023
- Neighborhood character
- Diverse neighborhood (Simpson 0.55)
- Race & ethnicity
- White 59% Black 31% Two or more races 6% Hispanic / Latino 4% Native American 1%
- Common ancestry
- Iranian 6% Romanian 4% Lithuanian 2%
- Foreign-born
- 1% · Canada
- Languages at home
- 97% English-only · Spanish 2%
Political lean MEDSL · Muskegon
- 2024 margin
- Toss-up / Even · D 48.4% · R 50.2% · Other 1.5%
- 2008→2024 swing
- -31.1pp toward R · 2008: 29.3pp · 2024: -1.8pp
- All cycles
- 2024: R+1.8 2020: D+0.6 2016: D+0.9 2012: D+17.8 2008: D+29.3
Not yet ingested
- Civics
- —
Market trends
- HPI YoY
- ▼ -150.02%
- Current HPI
- 209.2698
- Rent YoY
- —
- Metro
- Muskegon, MI
- State GDP YoY
- ▲ 1.37%
- F500 in state
- 28
Industry mix (Fortune 500 HQ in MI)
| Industry | F500 HQs | Revenue |
|---|---|---|
| Automotive Parts | 3 | $48B |
|
||
| Automotive | 2 | $372B |
|
||
| Chemicals | 1 | $45B |
|
||
| Automotive Retail | 1 | $29B |
|
||
| Healthcare / Medical Devices | 1 | $23B |
|
||
| Automotive Technology | 1 | $20B |
|
||
Price history
+300.8% since first listed50 events — show timeline
- 2026-06-13 Listed $159,900 MiRealSource-MiMLS
- 2022-03-07 Sold (Public Records) $118,000 Public Records
- 2022-02-28 Sold (MLS) $118,000 SW Michigan MLS
- 2022-02-28 Sold (MLS) $118,000 REALCOMP
- 2022-01-18 Pending — REALCOMP
- 2022-01-18 Pending — SW Michigan MLS
- 2022-01-01 Price Changed $117,500 REALCOMP
- 2022-01-01 Relisted — REALCOMP
- 2021-12-30 Price Changed $117,500 SW Michigan MLS
- 2021-12-30 Relisted — SW Michigan MLS
- 2021-12-21 Pending — REALCOMP
- 2021-12-21 Pending — SW Michigan MLS
- 2021-12-09 Listed $117,500 MiRealSource-MiMLS
- 2021-12-09 Listed $129,900 SW Michigan MLS
- 2021-12-09 Listed $129,900 REALCOMP
- 2021-05-07 Sold (Public Records) $41,500 Public Records
- 2021-05-07 Sold (Public Records) $29,000 Public Records
- 2021-02-19 Sold (MLS) $41,500 SW Michigan MLS
- 2021-02-19 Sold (MLS) $41,500 REALCOMP
- 2021-01-29 Pending — REALCOMP
- 2021-01-29 Pending — SW Michigan MLS
- 2021-01-29 Relisted — REALCOMP
- 2021-01-29 Relisted — SW Michigan MLS
- 2021-01-15 Pending — SW Michigan MLS
- 2021-01-13 Relisted — SW Michigan MLS
- 2020-12-31 Pending — SW Michigan MLS
- 2020-12-29 Listing Removed — REALCOMP
- 2020-11-06 Listed $49,999 MiRealSource-MiMLS
- 2020-11-06 Listed $49,999 SW Michigan MLS
- 2020-11-06 Listed $49,999 REALCOMP
- 2018-06-22 Listing Removed — SW Michigan MLS
- 2018-06-21 Listing Removed — REALCOMP
- 2017-12-23 Listed $22,000 SW Michigan MLS
- 2017-12-21 Listed $22,000 REALCOMP
- 2015-12-18 Listing Removed — SW Michigan MLS
- 2015-12-18 Sold (MLS) $4,000 SW Michigan MLS
- 2015-12-18 Sold (MLS) $4,000 REALCOMP
- 2015-12-02 Pending — SW Michigan MLS
- 2015-11-13 Price Changed $4,000 SW Michigan MLS
- 2015-10-08 Listed $7,000 SW Michigan MLS
- 2015-10-08 Listed $4,000 REALCOMP
- 2014-10-17 Listing Removed — SW Michigan MLS
- 2014-10-16 Listing Removed — SW Michigan MLS
- 2014-09-24 Listing Removed — SW Michigan MLS
- 2007-11-13 Listed $39,900 SW Michigan MLS
- 2006-05-26 Sold (Public Records) $37,000 Public Records
- 2003-02-07 Sold (MLS) $29,900 SW Michigan MLS
- 2002-08-30 Listed $32,000 SW Michigan MLS
- 2002-05-22 Listed $32,000 SW Michigan MLS
- 1999-11-05 Listed $39,900 SW Michigan MLS
Property tax history
+6.8%/yrLatest (2025): $2,395 · +2.8% YoY. Source: county tax records.
Cash-flow waterfall
monthlySold comps — $/sqft
last 12 mo · ≤1 miLoading sold comps…