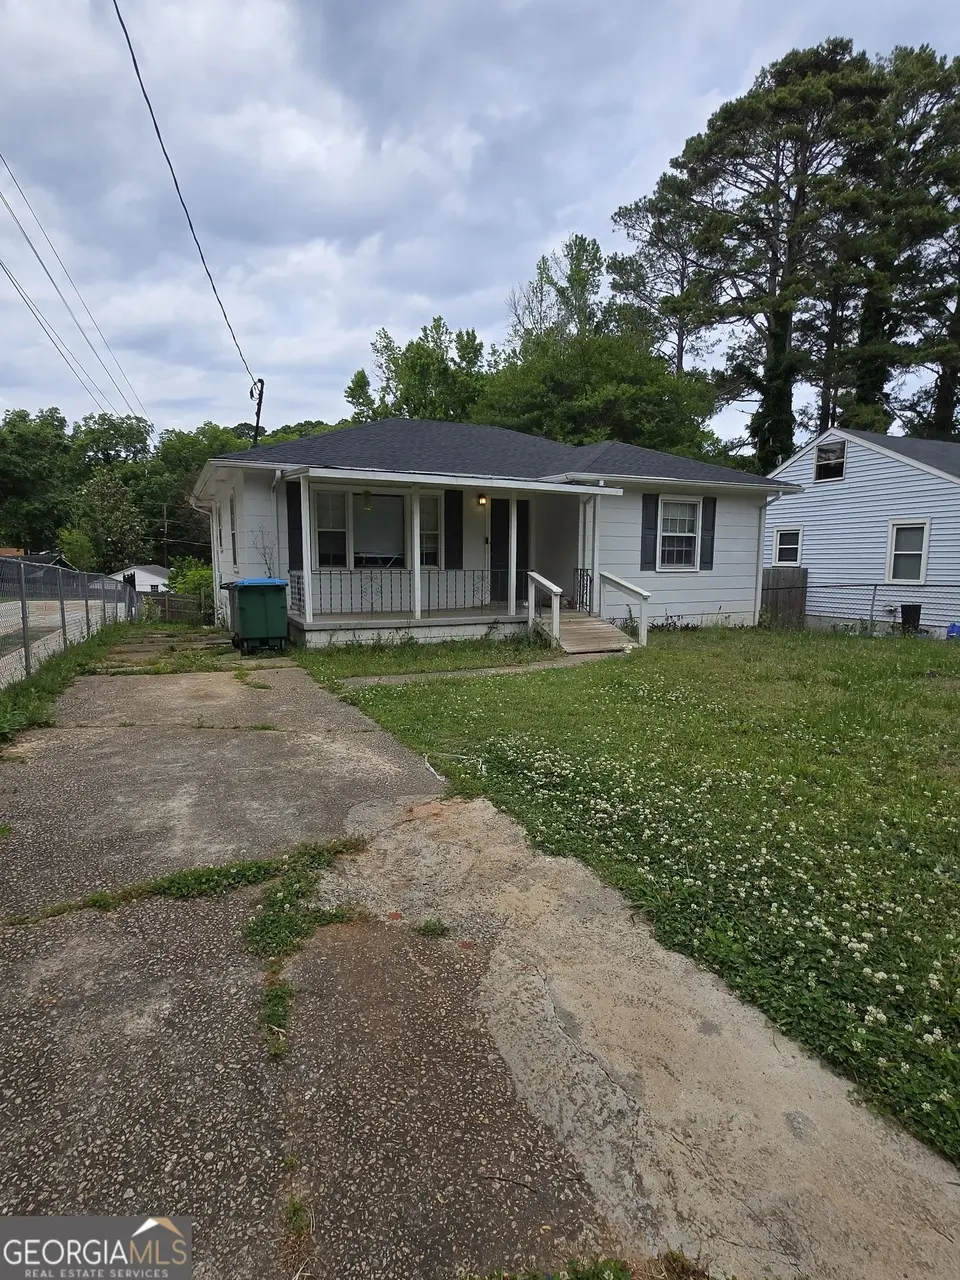
491 Woodrow Ave · Hapeville, GA
Flood risk 1/10 · Minimal
- FEMA flood zone
- X (unshaded)
- Chance of flooding over 30 yrs
- 0.0%
- Est. flood insurance / yr
- $473 – $860
Fire risk 1/10 · Minimal
- Est. fire insurance / yr
- $963 – $1,789
Heat risk 5/10 · Moderate
- Hot days now (above 104°F)
- 7 days/yr
- Hot days in 30 yrs
- 18 days/yr
Wind risk 6/10 · Moderate
- Chance of severe wind over 30 yrs
- 27.0%
Air-quality risk 4/10 · Minor
- Unhealthy air days now
- 4 days/yr
- Unhealthy air days in 30 yrs
- 6 days/yr
Risk factors via First Street. Map © Google.
Why this score? — see what drove the D grade
The composite is a weighted blend of 9 inputs, each scored 0–100. Each bar is that input's sub-score; the figure is the points it added to the 100-point composite (weight × sub-score).
- Cash flow +18.7/30.0
- DSCR +5.9/10.0
- 1% rule +4.5/10.0
- Schools +4.5/10.0
- Rent growth +3.9/5.0
- Livability +3.8/5.0
- Condition / age +2.5/5.0
- ARV discount +0.0/15.0
- Appreciation +0.0/10.0
$181,999
🖨 Deal sheet 📄 Offer letter ✓ Due diligence
Listing remarks
Welcome to this charming 2-bedroom, 1-bath home located in a highly desirable area with strong rental demand and long-term growth potential. Whether you're looking to expand your investment portfolio or purchase your first home, this property offers the perfect blend of value and opportunity. Step inside to a functional layout with plenty of natural light and comfortable living spaces. The home features a solid structure with room to add your own updates and personal touch-ideal for a flip or move-in-ready.
Key facts
- 6,229 sq ft lot
- Built 1950
- Listed 21 days
Property features AI
Finance
- Other: City lot; Lot about 0.143 acre; Public-record living/building area: 982
- HOA & community: Has association; association fee includes other items
Exterior
- Parking: Off-street parking
- Utilities: Public water; Public sewer (connected); Electricity available; Natural gas available; High-speed internet available; Cable available; Phone service available
- Home design: Single-family residence; House structure; Resale property
- Construction: Built in 1950; Wood siding construction; Composition roof
- Exterior features: Composition roof; Wood siding
Interior
- Kitchen: Convection oven; Refrigerator
- Bedrooms: 2 bedrooms on the main level
- Flooring: Hardwood floors
- Bathrooms: 1 full bathroom on the main level
- Heating & cooling: Central heating; Central air conditioning
- Interior features: Other interior features; One-level layout
- Laundry & utility: Laundry located in the kitchen
Neighborhood map
What this means for you Summary
Snapshot
- This is a 2-bed/1.0-bath single-family listed at $182k.
Deal economics
- At list price, monthly cash flow is $181 ($2k/yr) — positive.
- The deal already cash-flows at list — no discount required.
- To meet the 1% rule (rent ≥ 1% of price), the offer needs to be $172k (5.4% below list).
- Recommended offer: $172k (5.4% below list) — sets the bar for 1% rule.
- Cap rate 7.5% vs local median 3.6% in Hapeville — top-decile yield for the area; either an underpriced asset or a hidden risk that comps aren't pricing in. Stress-test before assuming the spread holds.
Location & tenants
- Location reads 76/100 on livability (#25 in GA, #3,590 nationally) — a middle-class / working-renter tenant base. Strengths: cost of living A+, housing A+, employment A-; Watch: commute F.
- Fulton County (suburban): math 49% / reading 53% proficiency, ranked #12 of 174 in GA (top 7%) — acceptable for families but not a draw, mixed tenant base, ~2y average lease.
- Zoned schools: Hapeville Elementary School (math 37% / reading 37%, grade F, #485 of 1,228 statewide, top 41%, 528 students, 100% FRL); Paul D. West Middle School (math 17% / reading 17%, grade F, #381 of 470 statewide, top 82%, 803 students, 100% FRL); Tri-Cities High School (math 5% / reading 30%, grade F, #264 of 424 statewide, top 63%, 1,483 students, 100% FRL) — zoned schools average 100% FRL vs 41% district-wide (59 pts higher); higher-poverty schools than district average — tighter screening recommended.
- Zoned-school proficiency averages 24% at this address vs 51% district-wide (-27 pts) — the specific schools serving this property underperform the Fulton County average; the district grade overstates school quality for this exact location.
- Market conditions: Rents rising fast (+5.5%/yr); 175 active listings in the ZIP; 39 comparable units currently listed for rent nearby; rentals at typical pace (median 15d on market — plan ~3-4 weeks tenant-placement turnaround); 11,565 units permitted in Fulton County in 2024 (8,159 in 5+ unit buildings).
- This rent runs 33% of the median local income ($63k/yr) — at the standard rent-burdened threshold; future hikes will face affordability resistance.
Forward outlook
- Local home prices are declining (-3.0%/yr); year-one equity from $1k of loan paydown is wiped out by about $5k of value loss. Plan a longer hold.
- Fulton County population projected at +38% by 2050 — long-run rental-demand tailwind backs the buy-and-hold thesis.
Negotiation context
- It's been on market 21 days — a 2% lower offer ($179k) is reasonable based on typical stale-listing flexibility.
Risks & watch-outs
- Watch-outs: built in 1950 — expect roof / HVAC / electrical / plumbing capex.
- Climate carrying-cost: major wind risk, 27% chance of damaging wind over 30y; extreme-heat days projected 7→18/yr by 2055 (HVAC capex compounding) — expect insurance premiums to compound above CPI over the hold.
Questions for the listing agent
- Built in 1950 — when were the roof, HVAC, electrical panel, plumbing, and water heater last replaced?
- Is there a deadline driving the sale (1031 exchange, divorce, estate, relocation)? That informs how much negotiation room exists.
- Schools are F-rated, which usually means shorter tenancies and higher turnover. Who's the typical renter profile here, and what's been the actual vacancy rate?
- The area grade is low — what's the realistic commute time and amenity access for the typical tenant pool here? Any planned neighborhood developments (good or bad) we should know about?
- What's the average days-on-market for RENTAL listings here right now (not sales)? A rising rental-DOM trend means longer vacancies and softer asking-rent achievability than the comps imply.
- What's the recent tenant-quality profile in this submarket — average credit score on applications, eviction rate, late-payment / NSF rate, and stable-employment percentage? A property-management company in the area should have these aggregated.
- How much new for-sale + rental construction is in the pipeline within 1–3 miles? Heavy new supply typically softens prices + rents 12–24 months out; constrained supply supports both.
Investment metrics
- 1% rule
- 0.95% ✗
- Cap rate
- 7.49%
- Cash-on-cash
- 4.27%
- DSCR
- 1.19
- GRM
- 8.8
CMA / ARV
- ARV (on-the-fly)
- $152,210
- Comps found
- 12
Show comp detail 12 sales within ~0.75 mi
| Address | Dist | Beds/Ba | Sqft | Sold | Price | $/sf | Match |
|---|---|---|---|---|---|---|---|
| 528 Lake Dr | 0.21mi | 2/1.0 | 936 (-5%) | 0mo | $125,000 | $134 | 82 |
| 544 Lake Dr | 0.24mi | 3/0.5 (+1) | 952 (-3%) | 1mo | $118,000 | $124 | 76 |
| 540 Lake Dr | 0.22mi | 3/1.0 (+1) | 930 (-5%) | 1mo | $102,000 | $110 | 75 |
| 2980 Wanda Cir SW | 0.56mi | 3/1.0 (+1) | 975 (-1%) | 2mo | $120,000 | $123 | 66 |
| 2955 Wanda Cir SW | 0.61mi | 3/1.0 (+1) | 975 (-1%) | 1mo | $151,000 | $155 | 65 |
| 419 Mount Zion Rd SW | 0.35mi | 3/2.0 (+1) | 1,032 (+5%) | 5mo | $225,000 | $218 | 62 |
| 447 North Ave | 0.19mi | 2/1.0 | 1,124 (+14%) | 6mo | $305,000 | $271 | 62 |
| 3010 1st Ave SW | 0.39mi | 3/1.0 (+1) | 1,075 (+10%) | 1mo | $182,500 | $170 | 60 |
| 682 Steve Dr SW | 0.71mi | 2/1.5 | 975 (-1%) | 5mo | $90,000 | $92 | 59 |
| 2931 Diana Dr SW | 0.69mi | 3/1.5 (+1) | 1,000 (+2%) | 1mo | $220,000 | $220 | 57 |
| 3018 Wanda Cir SW | 0.62mi | 3/2.0 (+1) | 1,000 (+2%) | 3mo | $229,000 | $229 | 57 |
| 2928 Diana Dr SW | 0.67mi | 3/1.0 (+1) | 1,000 (+2%) | 5mo | $87,000 | $87 | 57 |
Match score weights: distance 35% · size 25% · config 20% · recency 20%. Top-matched comps best support the ARV.
Projected returns pro-forma
-3.0% appreciation · 5.45% rent growth · sell at horizon
- IRR
- -7.1%
- Equity multiple
- 0.73×
- Total profit
- $-13,613
- Equity at exit
- $27,137
- IRR
- 5.2%
- Equity multiple
- 1.43×
- Total profit
- $21,688
- Equity at exit
- $15,736
Cash invested: $50,960 (down + closing). Projections, not guarantees.
Landlord ↔ Tenant lean methodology
- Overall (STATE)
- 90 Strongly Landlord-Friendly
- State Georgia
- 90 Strongly Landlord-Friendly · R+3
- County
- — inherits STATE
- City
- — inherits STATE
ZIP-level market 30354
- Home prices YoY
- -17.5%
- Rents YoY
- 5.5%
- Active inventory
- 175
- Price-to-rent
- 8.8×
Monthly cashflow live
- Estimated rent
- $1,721 high interval (Pro) →
- Mortgage (P&I)
- −$954
- Tax from tax record
- −$148 /mo · $1,779/yr
- Insurance
- −$76
- HOA
- −$0
- Vacancy / Maint / Mgmt
- −$362
- Net cashflow
- $181
Break-even live
UW: 25.0% down · 7.5% · 30yr · 1.5% tax · 5.0% vac · 8.0% maint · 8.0% mgmt
Financing live
Cash to close
- Down payment
- $45,500
- Closing costs
- $5,460
- Reserves months
- —
- Total cash needed
- —
Loan-product check · same deal, 3 products live
Conventional
25% down · 7.5% · 30yr
- Down + closing
- —
- Monthly P&I
- —
- Monthly cashflow
- —
- DSCR
- —
- Eligible?
- —
Personal DTI + credit; lowest rate.
DSCR
20% down · 8.5% · 30yr
- Down + closing
- —
- Monthly P&I
- —
- Monthly cashflow
- —
- DSCR
- —
- Eligible?
- —
No personal income docs; deal must DSCR.
Hard money
10% down · 12.0% · 12mo
- Down + closing
- —
- Monthly P&I
- —
- Monthly cashflow
- —
- DSCR
- —
- Eligible?
- —
Short-term bridge; refi at stabilization.
Rent comps 39 comps
| Address | Beds | Baths | Sqft | Rent | $/sqft | DOM | Units | Dist |
|---|---|---|---|---|---|---|---|---|
| 3301 Old Jonesboro Rd Atlanta, GA | 2.0 | 1.0 | 899 | $2,250 | $2.50 | 5d | 1 | 0.20mi |
| 535 Lake Dr Atlanta, GA | 3.0 | 2.0 | 1080 | $2,275 | $2.11 | 43d | 1 | 0.21mi |
| 231 Maple St Atlanta, GA | 3.0 | 2.0 | 1068 | $1,645 | $1.54 | 43d | 1 | 0.23mi |
| 3116 Jackson St Atlanta, GA | 2.0 | 2.0 | 1016 | $1,900 | $1.87 | 43d | 1 | 0.24mi |
| 278 Moreland Way Atlanta, GA | 3.0 | 2.0 | 1000 | $1,945 | $1.95 | 24d | 1 | 0.26mi |
| 518 North Ave Atlanta, GA | 2.0 | 1.5 | 1096 | $2,150 | $1.96 | 10d | 1 | 0.27mi |
| 3287 Russell St Atlanta, GA | 2.0 | 1.0 | 800 | $1,195 | $1.49 | 43d | 1 | 0.27mi |
| 735 Oak Dr Hapeville, GA | 2.0 | 1.0 | 1053 | $1,550 | $1.47 | 22d | 1 | 0.39mi |
| 3054 Waters Rd SW Atlanta, GA | 3.0 | 1.0 | 891 | $1,800 | $2.02 | 7d | 1 | 0.43mi |
| 2959 Forrest Hills Dr SW Atlanta, GA | 1.0–2.0 | 1.0–1.5 | 925 | $1,250 | $1.35 | 13d | 1 | 0.45mi |
| 2959 Forrest Hills Dr SW Atlanta, GA | 1.0–2.0 | 1.0–1.5 | 925 | $1,250 | $1.35 | 16d | 2 | 0.45mi |
| 2955 1st Ave SW Unit 1 Atlanta, GA | 1.0 | 1.0 | 600 | $1,050 | $1.75 | 24d | 1 | 0.46mi |
| 3028 Grand Ave SW Atlanta, GA | 1.0 | 1.0 | 1048 | $900 | $0.86 | 5d | 1 | 0.46mi |
| 3018 Grand Ave SW Atlanta, GA | 2.0 | 1.0 | 825 | $1,400 | $1.70 | 4d | 1 | 0.47mi |
| 3162 Oakdale Rd Atlanta, GA | 3.0 | 1.0 | 1040 | $3,200 | $3.08 | 43d | 1 | 0.57mi |
| 2875 3rd Ave SW Unit A Atlanta, GA | 2.0 | 1.0 | 900 | $1,245 | $1.38 | 2d | 1 | 0.59mi |
| 2857 1st Ave SW Atlanta, GA | 3.0 | 2.0 | 696 | $1,899 | $2.73 | 24d | 1 | 0.63mi |
| 45 Baker Dr SW Atlanta, GA | 3.0 | 2.0 | 1056 | $1,600 | $1.52 | 24d | 1 | 0.74mi |
| 3558 Elm St Atlanta, GA | 3.0 | 1.0–2.0 | 1098 | $2,751 | $2.50 | 12d | 33 | 0.85mi |
| 397 N Central Ave Hapeville, GA | 1.0–2.0 | 1.0–2.0 | 950 | $2,704 | $2.85 | 1d | 24 | 0.89mi |
| 536 College St Hapeville, GA | 2.0 | 1.0 | 765 | $1,295 | $1.69 | 17d | 1 | 0.91mi |
| 536 College St Apt 10 Hapeville, GA | 2.0 | 1.0 | 636 | $1,295 | $2.04 | 43d | 1 | 0.91mi |
| 852 Custer St Hapeville, GA | 1.0 | 1.0 | 610 | $1,600 | $2.62 | 18d | 1 | 0.93mi |
| 558 College St Atlanta, GA | 1.0–2.0 | 1.5 | 850 | $1,289 | $1.52 | 15d | 6 | 0.93mi |
| 532 Cleveland Ave SW Atlanta, GA | 2.0 | 1.0 | 836 | $950 | $1.14 | 14d | 1 | 0.94mi |
| 532 Cleveland Ave SW Atlanta, GA | 2.0 | 1.0 | 836 | $925 | $1.11 | 22d | 1 | 0.94mi |
| 3188 Ward Dr SW Atlanta, GA | 3.0 | 1.5 | 1025 | $1,800 | $1.76 | 12d | 1 | 0.94mi |
| 2786 Old Hapeville Rd SW Atlanta, GA | 2.0 | 1.5 | 1050 | $1,150 | $1.10 | 24d | 1 | 0.96mi |
| 2745 Old Hapeville Rd SW Atlanta, GA | 2.0–3.0 | 2.0 | 1007 | $1,250 | $1.24 | 15d | 1 | 0.98mi |
| 3640 S Fulton Ave Atlanta, GA | 1.0–2.0 | 1.0–2.0 | 950 | $1,793 | $1.89 | 2d | 27 | 1.01mi |
| 2952 Palm Dr Atlanta, GA | 3.0 | 2.0 | 1120 | $1,875 | $1.67 | 5d | 1 | 1.06mi |
| 2801 Palm Dr Atlanta, GA | 3.0 | 1.0 | 1064 | $1,550 | $1.46 | 12d | 1 | 1.22mi |
| 488 Pomona Cir SW Atlanta, GA | 3.0 | 1.0 | 1000 | $1,800 | $1.80 | 24d | 1 | 1.28mi |
| 2611 Springdale Rd SW Atlanta, GA | 1.0 | 1.0 | 546 | $1,071 | $1.96 | 24d | 1 | 1.28mi |
| 324 Macedonia Rd SE Atlanta, GA | 3.0 | 1.0 | 1000 | $1,295 | $1.29 | 7d | 1 | 1.36mi |
| 2744 Miles Cir Unit 2746 Atlanta, GA | 2.0 | 1.0 | 800 | $1,295 | $1.62 | 1d | 1 | 1.39mi |
| 331 Simca St SE Atlanta, GA | 3.0 | 1.0 | 1000 | $1,700 | $1.70 | 2d | 1 | 1.43mi |
| 2748 Blount St Atlanta, GA | 3.0 | 1.0 | 1068 | $1,850 | $1.73 | 43d | 1 | 1.43mi |
| 2718 Miles Cir Unit 1 Atlanta, GA | 2.0 | 1.0 | 750 | $1,300 | $1.73 | 15d | 1 | 1.46mi |
Listing history 14 events
-
2026-06-18days on market $181,999 Active 21 DOM
-
2026-06-17days on market $181,999 Active 20 DOM
-
2026-06-16days on market $181,999 Active 19 DOM
-
2026-06-15days on market $181,999 Active 18 DOM
-
2026-06-13days on market $181,999 Active 16 DOM
-
2026-06-09days on market $181,999 Active 12 DOM
-
2026-06-08days on market $181,999 Active 11 DOM
-
2026-06-07pricedays on market $181,999 Active 10 DOM
-
2026-06-04days on market $182,000 Active 7 DOM
-
2026-06-03days on market $182,000 Active 6 DOM
-
2026-06-01days on market $182,000 Active 4 DOM
-
2026-05-31days on market $182,000 Active 3 DOM
-
2026-05-18$182,000 New
-
2022-06-23soldstatus $175,000
ⓘ Source: listings_history table (triggers on properties + properties_extension) + one-shot
backfill from property_details.listing_events for pre-trigger history.
Tax reassessment forecast GA · Resets to sale price
- Current annual tax
- $1,779 · $148/mo
- Projected year-2 tax
- $1,779 · $148/mo
- Expected delta
- $0/yr ($0/mo · 0.0%)
ⓘ Screening estimate from a state-policy table — verify with the county assessor before closing.
Climate risk First Street
- Flood 1/10 Low FEMA zone X (unshaded) · 0% chance over 30 yrs
- Wildfire 1/10 Low
- Heat 5/10 Major 7 d/yr ≥104°F today · 18 d/yr by 30 yrs out
- Wind 6/10 Major 27% chance of damaging wind over 30 yrs
- Air quality 4/10 Moderate 4 unhealthy d/yr today · 6 by 30 yrs out
Nearby sold comps map
Loading sold comps map…
Walkable amenities ~0.75 mi
Loading nearby amenities…
Taxation est. · year 1
- Rental income
- $20,657
- − Mortgage interest
- −$10,195
- − Property taxes
- −$1,779
- − Insurance
- −$910
- − Repairs & maintenance
- −$1,653
- − Management
- −$1,653
- − Depreciation
- −$5,295
- Taxable loss
- −$826
- Est. tax savings @ 24.0%
- +$198
- After-tax cash flow
- $2,375/yr
For passive investors: Depreciation is non-cash, so a rental often shows a tax loss while cash-flowing — sheltering income. Rental losses are passive: they offset passive income freely, and up to $25,000/yr can offset ordinary (W-2) income if you actively participate and your MAGI is under $100k (phasing out to $0 by $150k); unused losses carry forward. On sale, claimed depreciation is recaptured at up to 25%, and gains may owe capital-gains tax (a 1031 exchange can defer both). Figures are a year-1 estimate at your 24.0% rate — not tax advice; consult a CPA.
Schools (NCES district)
- District
- Fulton County
- NCES district ID
- 1302280
- Math proficiency
- 49% ▼ -2.00%
- Reading proficiency
- 53% ▬ 0.00%
- Median HH income
- $68,035
- Composite
- 45.33/100
- National rank
- #2640
- State rank
- #12 of 174 in GA
Livability — Hapeville
- Score
- 76/100
- State rank
- #25
- US rank
- #3590
Category grades
Schools grade is shown separately in the Schools card above.
Census & demographics
- Census place
- Hapeville, GA
- County
- Fulton County · 1,094,430 people
- Metro
- Atlanta-Sandy Springs-Alpharetta, GA
- Population (ZIP)
- 16,182
- Household income
- $63,189
- Rent vs Own
- Severe rent burden
- 930.0
Population outlook (Fulton County) Hauer SSP2
- Today (2025)
- 1,203,707 people
- By 2030
- 1,299,706 · +8.0%
- By 2040
- 1,488,256 · +23.6%
- By 2050
- 1,664,580 · +38.3%
- By 2075
- 2,036,072 · +69.2%
- By 2100
- 2,222,402 · +84.6%
Race, ethnicity, and origin ACS 2023
- Neighborhood character
- Predominantly Black (68%)
- Race & ethnicity
- Black 68% Hispanic / Latino 16% White 10% Two or more races 9% Native American 2% Asian 1%
- Hispanic origin (detail)
- Mexican 13%
- Common ancestry
- Italian 2% Romanian 1% Swedish 1%
- Foreign-born
- 11% · Canada, Vietnam, Guatemala
- Languages at home
- 81% English-only · Spanish 15% German/W. Germanic 1% Vietnamese 1%
Political lean MEDSL · Fulton
- 2024 margin
- Solid D (+44.9) · D 71.9% · R 27.0% · Other 1.1%
- 2008→2024 swing
- +9.8pp toward D · 2008: 35.0pp · 2024: 44.9pp
- All cycles
- 2024: D+44.9 2020: D+46.4 2016: D+42.1 2012: D+29.6 2008: D+35.0
Not yet ingested
- Civics
- —
Market trends
- HPI YoY
- ▼ -67.78%
- Current HPI
- 320.1111
- Rent YoY
- ▲ 5.45%
- Metro
- Atlanta-Sandy Springs-Alpharetta, GA
- State GDP YoY
- ▲ 2.66%
- F500 in state
- 28
Industry mix (Fortune 500 HQ in GA)
| Industry | F500 HQs | Revenue |
|---|---|---|
| Paper / Packaging | 2 | $29B |
|
||
| Retail | 1 | $160B |
|
||
| Transportation / Logistics | 1 | $91B |
|
||
| Airlines | 1 | $62B |
|
||
| Consumer Goods | 1 | $47B |
|
||
| Utilities | 1 | $25B |
|
||
Price history
+4.0% since first listed2 events — show timeline
- 2026-05-18 Listed $182,000 GAMLS
- 2022-06-23 Sold (Public Records) $175,000 Public Records
Property tax history
+27.2%/yrLatest (2025): $1,779 · -10.8% YoY. Source: county tax records.
Cash-flow waterfall
monthlySold comps — $/sqft
last 12 mo · ≤1 miLoading sold comps…