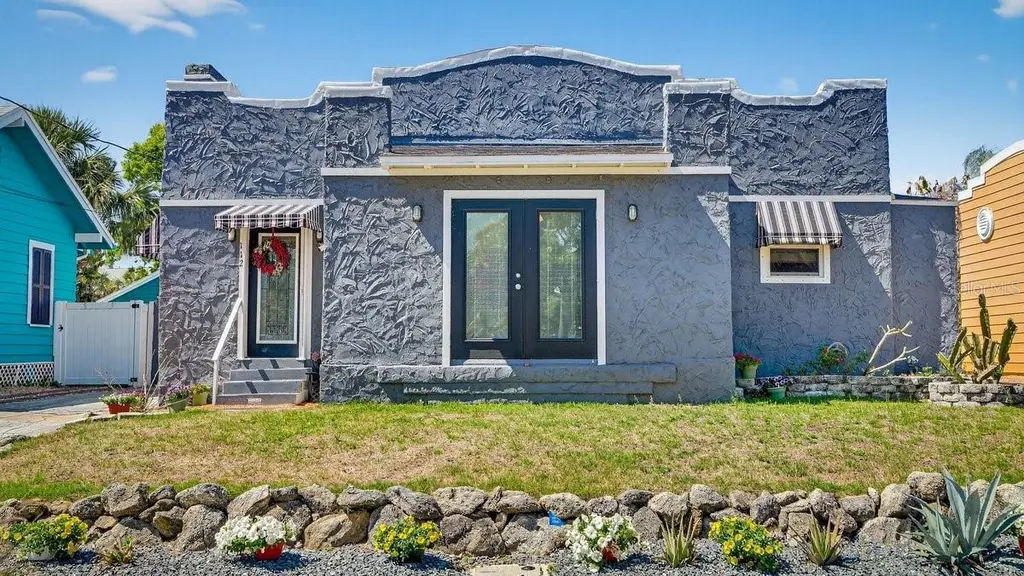
112 S Oleander Ave · Daytona Beach, FL
Flood risk 5/10 · Moderate
- FEMA flood zone
- X (unshaded)
- Chance of flooding over 30 yrs
- 0.23%
- Est. flood insurance / yr
- $507 – $1,088
Fire risk 1/10 · Minimal
- Est. fire insurance / yr
- $947 – $1,759
Heat risk 10/10 · Severe
- Hot days now (above 103°F)
- 7 days/yr
- Hot days in 30 yrs
- 20 days/yr
Wind risk 10/10 · Severe
- Chance of severe wind over 30 yrs
- 99.0%
Air-quality risk 2/10 · Minimal
- Unhealthy air days now
- 2 days/yr
- Unhealthy air days in 30 yrs
- 2 days/yr
Risk factors via First Street. Map © Google.
Why this score? — see what drove the D grade
The composite is a weighted blend of 9 inputs, each scored 0–100. Each bar is that input's sub-score; the figure is the points it added to the 100-point composite (weight × sub-score).
- Cash flow +13.8/30.0
- ARV discount +7.5/15.0
- DSCR +4.2/10.0
- Livability +4.2/5.0
- Schools +3.9/10.0
- 1% rule +2.9/10.0
- Condition / age +2.5/5.0
- Rent growth +2.4/5.0
- Appreciation +0.0/10.0
$319,900
🖨 Deal sheet 📄 Offer letter ✓ Due diligence
Listing remarks MLS
Own a piece of Daytona Beachside charm at 112 S Oleander Ave. Set in a prime coastal location just a short distance from the ocean, this unique property offers versatility, character, and opportunity. The main house features a 2-bedroom, 1-bath layout, with a connected 1-bedroom, 1-bath suite in the rear, creating flexible options for multi-generational living, guests, or added income potential. The main house boasts original hardwood floors that brings out the vintage beach house vibes. A private courtyard in the middle adds to the property's charm and creates an inviting outdoor space for relaxing or entertaining. There is also the possibility for an additional 1-bedroom, 1-bath efficiency suite, making this an especially appealing opportunity for buyers seeking flexible living arrangements or investment upside. Electrical, AC, doors, and most windows have all been updated from 2017 to current. Laundry facilities in efficiency unit. Great investment or multi-generational opportunity! With close proximity to the beach, dining, shopping, and entertainment, this property stands out for its location, layout, and potential.
Key facts
- Updated electrical
- Updated ac
- Updated windows
Tags
Neighborhood map
What this means for you Summary
Snapshot
- This is a 4-bed/3.0-bath single-family listed at $320k.
Deal economics
- At list price, monthly cash flow is $27 ($322/yr) — positive.
- The deal already cash-flows at list — no discount required.
- To meet the 1% rule (rent ≥ 1% of price), the offer needs to be $252k (21.1% below list).
- Recommended offer: $252k (21.1% below list) — sets the bar for 1% rule.
Location & tenants
- Location reads 83/100 on livability (#46 in FL, #867 nationally) — a professional / high-income tenant draw. Strengths: amenities A+, commute A+, cost of living A+; Watch: schools D+, employment D-.
- Volusia (suburban): math 44% / reading 49% proficiency, ranked #47 of 73 in FL (top 64%) — families likely to look elsewhere, expect single-tenant / working-renter base with shorter leases.
- Market conditions: Rents soft (-0.2%/yr); 920 active listings in the ZIP; 10 comparable units currently listed for rent nearby; rentals at typical pace (median 24d on market — plan ~3-4 weeks tenant-placement turnaround); 3,402 units permitted in Volusia County in 2024 (681 in 5+ unit buildings).
- At $2,524/mo this rent would consume 49% of the median local household income ($61k/yr) (locally 937% of renters already pay >50% of income on rent) — very limited rent-growth headroom before tenants either downsize or default.
Forward outlook
- Local home prices are declining (-3.0%/yr); year-one equity from $2k of loan paydown is wiped out by about $10k of value loss. Plan a longer hold.
- Volusia County population projected at +19% by 2050 — long-run rental-demand tailwind backs the buy-and-hold thesis.
Negotiation context
- It's been on market 79 days — a 6% lower offer ($301k) is reasonable based on typical stale-listing flexibility.
- 10 sale attempts since 13y ago with the ask held roughly flat each time — persistent listings suggest the price (not the market) is what's stuck; bring a comps-based counter.
- Current owner paid $165k; list at $320k implies a 94% gain — meaningful room to come down on a strong offer.
Risks & watch-outs
- Watch-outs: built in 1926 — expect roof / HVAC / electrical / plumbing capex.
- Climate carrying-cost: moderate flood risk; severe wind risk, 99% chance of damaging wind over 30y; extreme-heat days projected 7→20/yr by 2055 (HVAC capex compounding) — expect insurance premiums to compound above CPI over the hold.
Questions for the listing agent
- It's been on market 79 days. Have you received any prior offers? Is the seller open to a 21% concession, seller financing, or rate buy-down credit?
- Built in 1926 — when were the roof, HVAC, electrical panel, plumbing, and water heater last replaced?
- Why hasn't it sold? Are there any deal-killer items the seller is aware of (foundation, flood, title, zoning, code violations)?
- Is there a deadline driving the sale (1031 exchange, divorce, estate, relocation)? That informs how much negotiation room exists.
- Schools are D-rated, which usually means shorter tenancies and higher turnover. Who's the typical renter profile here, and what's been the actual vacancy rate?
- The area grade is low — what's the realistic commute time and amenity access for the typical tenant pool here? Any planned neighborhood developments (good or bad) we should know about?
- What's the average days-on-market for RENTAL listings here right now (not sales)? A rising rental-DOM trend means longer vacancies and softer asking-rent achievability than the comps imply.
- What's the recent tenant-quality profile in this submarket — average credit score on applications, eviction rate, late-payment / NSF rate, and stable-employment percentage? A property-management company in the area should have these aggregated.
- How much new for-sale + rental construction is in the pipeline within 1–3 miles? Heavy new supply typically softens prices + rents 12–24 months out; constrained supply supports both.
Investment metrics
- 1% rule
- 0.79% ✗
- Cap rate
- 6.39%
- Cash-on-cash
- 0.36%
- DSCR
- 1.02
- GRM
- 10.6
CMA / ARV
No comps found within radius.
Projected returns pro-forma
-3.0% appreciation · 0.0% rent growth · sell at horizon
- IRR
- -18.8%
- Equity multiple
- 0.36×
- Total profit
- $-57,638
- Equity at exit
- $47,698
- IRR
- -18.0%
- Equity multiple
- 0.14×
- Total profit
- $-77,027
- Equity at exit
- $27,659
Cash invested: $89,572 (down + closing). Projections, not guarantees.
Landlord ↔ Tenant lean methodology
- Overall (STATE)
- 87 Strongly Landlord-Friendly
- State Florida
- 87 Strongly Landlord-Friendly · R+3
- County
- — inherits STATE
- City
- — inherits STATE
ZIP-level market 32118
- Rents YoY
- -0.2%
- Active inventory
- 920
- Price-to-rent
- 10.6×
Monthly cashflow live
- Estimated rent
- $2,524 high interval (Pro) →
- Mortgage (P&I)
- −$1,678
- Tax from tax record
- −$156 /mo · $1,871/yr
- Insurance
- −$133
- HOA
- −$0
- Vacancy / Maint / Mgmt
- −$530
- Net cashflow
- $27
Break-even live
UW: 25.0% down · 7.5% · 30yr · 1.5% tax · 5.0% vac · 8.0% maint · 8.0% mgmt
Financing live
Cash to close
- Down payment
- $79,975
- Closing costs
- $9,597
- Reserves months
- —
- Total cash needed
- —
Loan-product check · same deal, 3 products live
Conventional
25% down · 7.5% · 30yr
- Down + closing
- —
- Monthly P&I
- —
- Monthly cashflow
- —
- DSCR
- —
- Eligible?
- —
Personal DTI + credit; lowest rate.
DSCR
20% down · 8.5% · 30yr
- Down + closing
- —
- Monthly P&I
- —
- Monthly cashflow
- —
- DSCR
- —
- Eligible?
- —
No personal income docs; deal must DSCR.
Hard money
10% down · 12.0% · 12mo
- Down + closing
- —
- Monthly P&I
- —
- Monthly cashflow
- —
- DSCR
- —
- Eligible?
- —
Short-term bridge; refi at stabilization.
Rent comps 10 comps
| Address | Beds | Baths | Sqft | Rent | $/sqft | DOM | Units | Dist |
|---|---|---|---|---|---|---|---|---|
| 122 S Peninsula Dr Daytona Beach, FL | 4.0 | 2.0 | 1900 | $1,695 | $0.89 | 21d | 1 | 0.15mi |
| 502 Rio Vista Ave Daytona Beach, FL | 4.0 | 3.0 | 2031 | $2,195 | $1.08 | 23d | 1 | 0.71mi |
| 628 N Halifax Ave Daytona Beach, FL | 4.0 | 3.0 | 2480 | $2,250 | $0.91 | 14d | 1 | 0.89mi |
| 602 Temko Ter Daytona Beach, FL | 3.0 | 2.0 | 1642 | $3,500 | $2.13 | 23d | 1 | 1.16mi |
| 231 Riverside Dr #1210 Holly Hill, FL | 3.0 | 3.0 | 2079 | $4,200 | $2.02 | 23d | 1 | 1.20mi |
| 231 Riverside Dr Unit 1509-1 Daytona Beach, FL | 3.0 | 3.0 | 1922 | $3,300 | $1.72 | 19d | 1 | 1.20mi |
| 241 Riverside Dr Unit 1546408P Holly Hill, FL | 3.0 | 3.0 | 1915 | $4,994 | $2.61 | 14d | 1 | 1.22mi |
| 241 Riverside Dr #1710 Daytona Beach, FL | 3.0 | 3.0 | 1922 | $3,000 | $1.56 | 23d | 1 | 1.24mi |
| 241 Riverside Dr #2610 Daytona Beach, FL | 3.0 | 3.0 | 1922 | $3,295 | $1.71 | 21d | 1 | 1.24mi |
| 241 Riverside Dr #410 Daytona Beach, FL | 3.0 | 3.0 | 1922 | $4,500 | $2.34 | 23d | 1 | 1.24mi |
Listing history 47 events
-
2026-06-18days on market $319,900 Active 79 DOM
-
2026-06-17pricedays on market $319,900 Active 78 DOM
-
2026-06-16days on market $324,900 Active 77 DOM
-
2026-06-15days on market $324,900 Active 76 DOM
-
2026-06-14days on market $324,900 Active 74 DOM
-
2026-06-10days on market $324,900 Active 71 DOM
-
2026-06-09days on market $324,900 Active 70 DOM
-
2026-06-08days on market $324,900 Active 69 DOM
-
2026-06-07days on market $324,900 Active 68 DOM
-
2026-06-05days on market $324,900 Active 65 DOM
-
2026-06-03days on market $324,900 Active 64 DOM
-
2026-06-03days on market $324,900 Active 63 DOM
-
2026-06-01days on market $324,900 Active 62 DOM
-
2026-05-31days on market $324,900 Active 61 DOM
-
2026-05-31days on market $324,900 Active 60 DOM
-
2026-03-31$324,900 Active 1141-char remark
Show marketing remark (1138 chars)
Own a piece of Daytona Beachside charm at 112 S Oleander Ave. Set in a prime coastal location just a short distance from the ocean, this unique property offers versatility, character, and opportunity. The main house features a 2-bedroom, 1-bath layout, with a connected 1-bedroom, 1-bath suite in the rear, creating flexible options for multi-generational living, guests, or added income potential. The main house boasts original hardwood floors that brings out the vintage beach house vibes. A private courtyard in the middle adds to the property's charm and creates an inviting outdoor space for relaxing or entertaining. There is also the possibility for an additional 1-bedroom, 1-bath efficiency suite, making this an especially appealing opportunity for buyers seeking flexible living arrangements or investment upside. Electrical, AC, doors, and most windows have all been updated from 2017 to current. Laundry facilities in efficiency unit. Great investment or multi-generational opportunity! With close proximity to the beach, dining, shopping, and entertainment, this property stands out for its location, layout, and potential.
-
2026-03-31$324,900 Active 1138-char remark
Show marketing remark (1138 chars)
Own a piece of Daytona Beachside charm at 112 S Oleander Ave. Set in a prime coastal location just a short distance from the ocean, this unique property offers versatility, character, and opportunity. The main house features a 2-bedroom, 1-bath layout, with a connected 1-bedroom, 1-bath suite in the rear, creating flexible options for multi-generational living, guests, or added income potential. The main house boasts original hardwood floors that brings out the vintage beach house vibes. A private courtyard in the middle adds to the property's charm and creates an inviting outdoor space for relaxing or entertaining. There is also the possibility for an additional 1-bedroom, 1-bath efficiency suite, making this an especially appealing opportunity for buyers seeking flexible living arrangements or investment upside. Electrical, AC, doors, and most windows have all been updated from 2017 to current. Laundry facilities in efficiency unit. Great investment or multi-generational opportunity! With close proximity to the beach, dining, shopping, and entertainment, this property stands out for its location, layout, and potential.
-
2026-02-01price $325,000
-
2025-12-06status Active
-
2025-12-05status Pending
-
2025-12-05historical
-
2025-12-01price $330,000
-
2025-11-03price $335,000
-
2025-08-31$339,500 Active
-
2025-08-19$360,000 Active
-
2025-08-19historical
-
2025-06-10price $349,900
-
2025-03-24price $350,000
-
2025-03-11price $374,900
-
2024-11-12price $379,900
-
2024-10-24status Active
-
2024-10-14status Pending
-
2024-10-14historical
-
2024-09-30$389,900 Active
-
2017-02-23soldstatus $165,000
-
2017-02-22soldstatus $165,000 Closed
-
2017-02-03historical Contingent
-
2016-11-23price $173,000
-
2016-11-10price $168,000
-
2016-10-16$195,000 Active
-
2014-10-03soldstatus $40,000
-
2013-04-25$50,000
-
2013-04-11$75,000
-
2004-10-04soldstatus $80,000
-
2001-10-13soldstatus $200,000
-
1990-01-01soldstatus $96,900
-
1988-10-01soldstatus $78,000
ⓘ Source: listings_history table (triggers on properties + properties_extension) + one-shot
backfill from property_details.listing_events for pre-trigger history.
Tax reassessment forecast FL · Resets to sale price
- Current annual tax
- $1,871 · $156/mo
- Projected year-2 tax
- $2,655 · $221/mo
- Expected delta
- +$785/yr (+$65/mo · 41.9%)
ⓘ Screening estimate from a state-policy table — verify with the county assessor before closing.
Climate risk First Street
- Flood 5/10 Major FEMA zone X (unshaded) · 23% chance over 30 yrs
- Wildfire 1/10 Low
- Heat 10/10 Extreme 7 d/yr ≥103°F today · 20 d/yr by 30 yrs out
- Wind 10/10 Extreme 99% chance of damaging wind over 30 yrs
- Air quality 2/10 Low 2 unhealthy d/yr today · 2 by 30 yrs out
Nearby sold comps map
Loading sold comps map…
Walkable amenities ~0.75 mi
Loading nearby amenities…
Taxation est. · year 1
- Rental income
- $30,282
- − Mortgage interest
- −$17,919
- − Property taxes
- −$1,871
- − Insurance
- −$1,600
- − Repairs & maintenance
- −$2,423
- − Management
- −$2,423
- − Depreciation
- −$9,306
- Taxable loss
- −$5,259
- Est. tax savings @ 24.0%
- +$1,262
- After-tax cash flow
- $1,584/yr
For passive investors: Depreciation is non-cash, so a rental often shows a tax loss while cash-flowing — sheltering income. Rental losses are passive: they offset passive income freely, and up to $25,000/yr can offset ordinary (W-2) income if you actively participate and your MAGI is under $100k (phasing out to $0 by $150k); unused losses carry forward. On sale, claimed depreciation is recaptured at up to 25%, and gains may owe capital-gains tax (a 1031 exchange can defer both). Figures are a year-1 estimate at your 24.0% rate — not tax advice; consult a CPA.
Schools (NCES district)
- District
- Volusia
- NCES district ID
- 1201920
- Math proficiency
- 44% ▼ -9.00%
- Reading proficiency
- 49% ▼ -3.00%
- Median HH income
- $42,946
- Composite
- 39.2/100
- National rank
- #4019
- State rank
- #47 of 73 in FL
Livability — Daytona Beach
- Score
- 83/100
- State rank
- #46
- US rank
- #867
Category grades
Schools grade is shown separately in the Schools card above.
Census & demographics
- Census place
- Daytona Beach, FL
- County
- Volusia County · 556,871 people
- City population
- 67,539
- Metro
- Deltona-Daytona Beach-Ormond Beach, FL
- Population (ZIP)
- 18,383
- Household income
- $61,266
- Rent vs Own
- Severe rent burden
- 937.0
Population outlook (Volusia County) Hauer SSP2
- Today (2025)
- 572,749 people
- By 2030
- 598,695 · +4.5%
- By 2040
- 644,880 · +12.6%
- By 2050
- 681,451 · +19.0%
- By 2075
- 759,957 · +32.7%
- By 2100
- 778,902 · +36.0%
Race, ethnicity, and origin ACS 2023
- Neighborhood character
- Predominantly White (81%)
- Race & ethnicity
- White 81% Two or more races 7% Hispanic / Latino 7% Black 4% Asian 2%
- Hispanic origin (detail)
- Mexican 1% Puerto Rican 2%
- Common ancestry
- Romanian 3% Lithuanian 3% Slovak 2%
- Foreign-born
- 12% · Canada, Vietnam, Dominican Republic
- Languages at home
- 85% English-only · Spanish 5% Other Indo-European 3% Russian/Polish/Slavic 2%
Political lean MEDSL · Volusia
- 2024 margin
- Strong R (+21.8) · D 38.7% · R 60.5%
- 2008→2024 swing
- -27.4pp toward R · 2008: 5.7pp · 2024: -21.8pp
- All cycles
- 2024: R+21.8 2020: R+14.1 2016: R+13.1 2012: R+1.2 2008: D+5.7
Not yet ingested
- Civics
- —
Market trends
- HPI YoY
- ▼ -534.90%
- Current HPI
- 262.3757
- Rent YoY
- ▼ -0.21%
- Metro
- Deltona-Daytona Beach-Ormond Beach, FL
- State GDP YoY
- ▲ 3.28%
- F500 in state
- 36
Industry mix (Fortune 500 HQ in FL)
| Industry | F500 HQs | Revenue |
|---|---|---|
| Industrial Technology | 2 | $29B |
|
||
| Insurance | 2 | $17B |
|
||
| Retail | 1 | $60B |
|
||
| Technology Distribution | 1 | $58B |
|
||
| Homebuilding | 1 | $35B |
|
||
| Technology Manufacturing | 1 | $35B |
|
||
Price history
+316.5% since first listed32 events — show timeline
- 2026-03-31 Listed $324,900 Daytona MLS
- 2026-03-31 Listed $324,900 Stellar MLS as Distributed by MLS Grid
- 2026-02-01 Price Changed $325,000 Daytona MLS
- 2025-12-06 Relisted — Daytona MLS
- 2025-12-05 Pending — Daytona MLS
- 2025-12-05 Listing Removed — Daytona MLS
- 2025-12-01 Price Changed $330,000 Daytona MLS
- 2025-11-03 Price Changed $335,000 Daytona MLS
- 2025-08-31 Listed $339,500 Daytona MLS
- 2025-08-19 Listed $360,000 realMLS
- 2025-08-19 Listing Removed — realMLS
- 2025-06-10 Price Changed $349,900 Daytona MLS
- 2025-03-24 Price Changed $350,000 Daytona MLS
- 2025-03-11 Price Changed $374,900 Daytona MLS
- 2024-11-12 Price Changed $379,900 Daytona MLS
- 2024-10-24 Relisted — Daytona MLS
- 2024-10-14 Pending — Daytona MLS
- 2024-10-14 Listing Removed — Daytona MLS
- 2024-09-30 Listed $389,900 Daytona MLS
- 2017-02-23 Sold (Public Records) $165,000 Public Records
- 2017-02-22 Sold (MLS) $165,000 Daytona MLS
- 2017-02-03 Contingent — Daytona MLS
- 2016-11-23 Price Changed $173,000 Daytona MLS
- 2016-11-10 Price Changed $168,000 Daytona MLS
- 2016-10-16 Listed $195,000 Daytona MLS
- 2014-10-03 Sold (MLS) $40,000 Daytona MLS
- 2013-04-25 Listed $50,000 Daytona MLS
- 2013-04-11 Listed $75,000 Daytona MLS
- 2004-10-04 Sold (Public Records) $80,000 Public Records
- 2001-10-13 Sold (Public Records) $200,000 Public Records
- 1990-01-01 Sold (Public Records) $96,900 Public Records
- 1988-10-01 Sold (Public Records) $78,000 Public Records
Property tax history
+4.1%/yrLatest (2025): $1,871 · +3.3% YoY. Source: county tax records.
Cash-flow waterfall
monthlySold comps — $/sqft
last 12 mo · ≤1 miLoading sold comps…