15 Maple View Dr · Bradford, NH
Flood risk 1/10 · Minimal
- FEMA flood zone
- X (unshaded)
- Chance of flooding over 30 yrs
- 0.0%
- Est. flood insurance / yr
- $507 – $1,088
Fire risk 3/10 · Minor
- Est. fire insurance / yr
- $507 – $941
Heat risk 2/10 · Minimal
- Hot days now (above 92°F)
- 7 days/yr
- Hot days in 30 yrs
- 16 days/yr
Wind risk 4/10 · Minor
- Chance of severe wind over 30 yrs
- 9.0%
Air-quality risk 1/10 · Minimal
- Unhealthy air days now
- 0 days/yr
- Unhealthy air days in 30 yrs
- 0 days/yr
Risk factors via First Street. Map © Google.
Why this score? — see what drove the B+ grade
The composite is a weighted blend of 9 inputs, each scored 0–100. Each bar is that input's sub-score; the figure is the points it added to the 100-point composite (weight × sub-score).
- Cash flow +27.7/30.0
- ARV discount +10.1/15.0
- Appreciation +10.0/10.0
- DSCR +9.7/10.0
- 1% rule +8.0/10.0
- Schools +4.6/10.0
- Livability +3.4/5.0
- Rent growth +2.5/5.0
- Condition / age +2.5/5.0
$405,000
🖨 Deal sheet 📄 Offer letter ✓ Due diligence
Listing remarks MLS
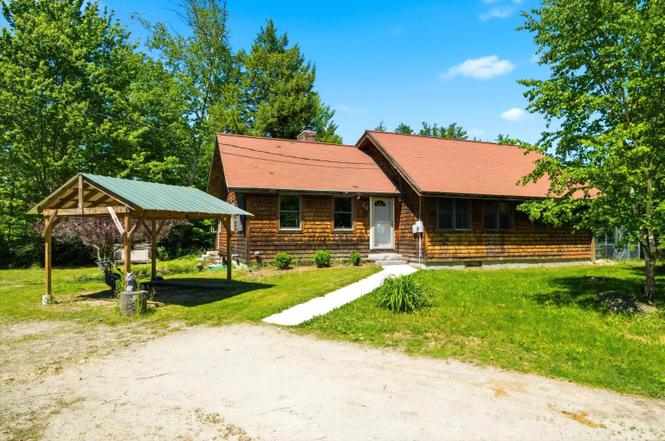
This 3 bedroom, 2 bath ranch home is sited on a level, 2 acre lot and is a great opportunity for someone to make it their own! Enter into a large living room with wood floors that leads into the galley style kitchen, and dining area overlooking the backyard. The master bedroom suite features a full bath and a room that can be used as a nursery, office or additional large closet. Down the hall there is a large full bath with dual vanity, and two bedrooms. A large mudroom area with an attached laundry room finishes the first level. The 2nd level features an unfinished bonus room and has an area plumbed for a bathroom. The home sits back from the road and has a private feel. There is a field for small animals, and more yard space could be created. 35 minutes from Concord, 15 minutes to Lake Sunapee and Vail operated Mt. Sunapee.
Key facts
- Backyard oasis
- Private level yard
- Granite counters
Tags
Property features AI
Exterior
- Parking: 1-car garage
- Utilities: Drilled private well; Private septic (1250 gallon); 200 Amp electric service with circuit breakers; LP/bottle gas available; High-speed internet available
- Home design: Ranch-style home; Existing construction
- Construction: Cedar exterior with shake siding and other materials; Shingle roof; Built in 1988
- Exterior features: Country setting on a wooded, interior lot near trails; Privately maintained road frontage (315 feet); Dirt driveway; Approximately 9.34 acres of common land
Interior
- Kitchen: Eat-in kitchen; Double oven
- Bedrooms: Primary bedroom with attached bath (on first level); Two additional bedrooms (on first level)
- Flooring: Hardwood floors; Tile floors
- Bathrooms: 2 full bathrooms
- Heating & cooling: Propane heating
- Interior features: 8 total rooms; Basement with interior and exterior access, slab, and sump pump; Bonus room on the second level
- Laundry & utility: Laundry room on the first level; Washer and dryer included; Water heater
Neighborhood map
What this means for you Summary
Snapshot
- This is a 3-bed/2.0-bath single-family listed at $405k.
Deal economics
- At list price, monthly cash flow is $1k ($15k/yr) — positive.
- The deal already cash-flows at list — no discount required.
- Meets the 1% rule at list price ($5k rent vs $405k).
- Cap rate 9.9% vs local median 2.6% in Bradford — top-decile yield for the area; either an underpriced asset or a hidden risk that comps aren't pricing in. Stress-test before assuming the spread holds.
Location & tenants
- Location reads 67/100 on livability (#62 in NH) — a middle-class / working-renter tenant base. Strengths: crime A+, cost of living A, housing A-; Watch: employment C-, health & safety C-, amenities F.
- Kearsarge Regional School District (rural): math 44% / reading 60% proficiency, ranked #30 of 98 in NH (top 31%) — acceptable for families but not a draw, mixed tenant base, ~2y average lease; only 15% free/reduced lunch — higher-income household profile.
- Market conditions: 19 active listings in the ZIP; 1 comparable units currently listed for rent nearby; 380 units permitted in Merrimack County in 2024 (28 in 5+ unit buildings).
Forward outlook
- In year one you build about $43k of equity ($3k loan paydown + $40k appreciation (10.0% local appreciation)).
- Merrimack County population projected to shrink 5% by 2050 — rents likely to lag national; underwrite the cash flow, not the appreciation.
- At projected returns (10.0% appreciation + 3.0% rent growth), your $113k cash investment doubles in ~2 years — after that, you're playing with house money.
- By year 2, paydown + projected appreciation supports a ~$70k cash-out refi (75% LTV) — recoverable capital for the next deal without selling this one.
Negotiation context
- Only 4 days on market — expect competitive offers; lowballing is unlikely to land.
- 2 sale attempts since 4y ago with the ask held roughly flat each time — persistent listings suggest the price (not the market) is what's stuck; bring a comps-based counter.
- Current owner paid $260k; list at $405k implies a 56% gain — meaningful room to come down on a strong offer.
Questions for the listing agent
- Is there a deadline driving the sale (1031 exchange, divorce, estate, relocation)? That informs how much negotiation room exists.
- Schools are B-rated — typically a magnet for longer-tenancy family renters. What's the average tenant stay here, and is there a school-zone premium baked into asking?
- What's the average days-on-market for RENTAL listings here right now (not sales)? A rising rental-DOM trend means longer vacancies and softer asking-rent achievability than the comps imply.
- What's the recent tenant-quality profile in this submarket — average credit score on applications, eviction rate, late-payment / NSF rate, and stable-employment percentage? A property-management company in the area should have these aggregated.
- How much new for-sale + rental construction is in the pipeline within 1–3 miles? Heavy new supply typically softens prices + rents 12–24 months out; constrained supply supports both.
Investment metrics
- 1% rule
- 1.30% ✓
- Cap rate
- 9.90%
- Cash-on-cash
- 12.89%
- DSCR
- 1.57
- GRM
- 6.4
CMA / ARV
- ARV (on-the-fly)
- $429,833
- Comps found
- 2
Show comp detail 2 sales within ~0.75 mi
| Address | Dist | Beds/Ba | Sqft | Sold | Price | $/sf | Match |
|---|---|---|---|---|---|---|---|
| 16 Hogg Hill Rd | 0.66mi | 3/2.0 | 1,728 (-8%) | 8mo | $395,000 | $229 | 50 |
| 44 Jones Rd | 0.51mi | 2/1.0 (-1) | 1,857 (-1%) | 21mo | $280,000 | $151 | 48 |
Match score weights: distance 35% · size 25% · config 20% · recency 20%. Top-matched comps best support the ARV.
Projected returns pro-forma
10.0% appreciation · 3.0% rent growth · sell at horizon
- IRR
- 33.8%
- Equity multiple
- 3.63×
- Total profit
- $298,301
- Equity at exit
- $364,856
- IRR
- 29.1%
- Equity multiple
- 8.21×
- Total profit
- $817,766
- Equity at exit
- $786,826
Cash invested: $113,400 (down + closing). Projections, not guarantees.
Landlord ↔ Tenant lean methodology
- Overall (STATE)
- 56 Moderately Landlord-Leaning
- State New Hampshire
- 56 Moderately Landlord-Leaning · D+1
- County
- — inherits STATE
- City
- — inherits STATE
ZIP-level market 03221
- Home prices YoY
- 17.4%
- Active inventory
- 19
- Price-to-rent
- 6.4×
Monthly cashflow live
- Estimated rent
- $5,250 medium interval (Pro) →
- Mortgage (P&I)
- −$2,124
- Tax from tax record
- −$637 /mo · $7,644/yr
- Insurance
- −$169
- HOA
- −$0
- Vacancy / Maint / Mgmt
- −$1,102
- Net cashflow
- $1,218
Break-even live
UW: 25.0% down · 7.5% · 30yr · 1.5% tax · 5.0% vac · 8.0% maint · 8.0% mgmt
Financing live
Cash to close
- Down payment
- $101,250
- Closing costs
- $12,150
- Reserves months
- —
- Total cash needed
- —
Loan-product check · same deal, 3 products live
Conventional
25% down · 7.5% · 30yr
- Down + closing
- —
- Monthly P&I
- —
- Monthly cashflow
- —
- DSCR
- —
- Eligible?
- —
Personal DTI + credit; lowest rate.
DSCR
20% down · 8.5% · 30yr
- Down + closing
- —
- Monthly P&I
- —
- Monthly cashflow
- —
- DSCR
- —
- Eligible?
- —
No personal income docs; deal must DSCR.
Hard money
10% down · 12.0% · 12mo
- Down + closing
- —
- Monthly P&I
- —
- Monthly cashflow
- —
- DSCR
- —
- Eligible?
- —
Short-term bridge; refi at stabilization.
Rent comps 1 comps
| Address | Beds | Baths | Sqft | Rent | $/sqft | DOM | Units | Dist |
|---|---|---|---|---|---|---|---|---|
| 31 Water St Unit 1 Bradford, NH | 4.0 | 1.0 | 2000 | $5,250 | $2.62 | 21d | 1 | 1.06mi |
Listing history 7 events
-
2026-06-18status $405,000 Pending 4 DOM
-
2026-06-17days on market $405,000 Active 4 DOM
-
2026-06-16days on market $405,000 Active 3 DOM
-
2026-06-15days on market $405,000 Active 2 DOM
-
2026-06-14statusdays on market $405,000 Active 1 DOM
-
2026-06-13remarks 693-char remark
-
2026-06-13$405,000 Coming Soon 2 DOM
ⓘ Source: listings_history table (triggers on properties + properties_extension) + one-shot
backfill from property_details.listing_events for pre-trigger history.
Tax reassessment forecast NH · Partial reset (capped growth)
- Current annual tax
- $7,644 · $637/mo
- Projected year-2 tax
- $8,236 · $686/mo
- Expected delta
- +$592/yr (+$49/mo · 7.8%)
ⓘ Screening estimate from a state-policy table — verify with the county assessor before closing.
Climate risk First Street
- Flood 1/10 Low FEMA zone X (unshaded) · 0% chance over 30 yrs
- Wildfire 3/10 Moderate
- Heat 2/10 Low 7 d/yr ≥92°F today · 16 d/yr by 30 yrs out
- Wind 4/10 Moderate 9% chance of damaging wind over 30 yrs
- Air quality 1/10 Low 0 unhealthy d/yr today · 0 by 30 yrs out
Nearby sold comps map
Loading sold comps map…
Walkable amenities ~0.75 mi
Loading nearby amenities…
Taxation est. · year 1
- Rental income
- $63,000
- − Mortgage interest
- −$22,686
- − Property taxes
- −$7,644
- − Insurance
- −$2,025
- − Repairs & maintenance
- −$5,040
- − Management
- −$5,040
- − Depreciation
- −$11,782
- Taxable income
- $8,783
- Est. tax owed @ 24.0%
- −$2,108
- After-tax cash flow
- $12,507/yr
For passive investors: Depreciation is non-cash, so a rental often shows a tax loss while cash-flowing — sheltering income. Rental losses are passive: they offset passive income freely, and up to $25,000/yr can offset ordinary (W-2) income if you actively participate and your MAGI is under $100k (phasing out to $0 by $150k); unused losses carry forward. On sale, claimed depreciation is recaptured at up to 25%, and gains may owe capital-gains tax (a 1031 exchange can defer both). Figures are a year-1 estimate at your 24.0% rate — not tax advice; consult a CPA.
Schools (NCES district)
- District
- Kearsarge Regional School District
- NCES district ID
- 3304040
- Math proficiency
- 44% ▼ -15.00%
- Reading proficiency
- 60% ▼ -3.00%
- Median HH income
- $70,357
- Composite
- 46.33/100
- National rank
- #2467
- State rank
- #30 of 98 in NH
Livability — Bradford
- Score
- 67/100
- State rank
- #62
- US rank
- #10685
Category grades
Schools grade is shown separately in the Schools card above.
Census & demographics
- Population (ZIP)
- 2,210
Population outlook (Merrimack County) Hauer SSP2
- Today (2025)
- 151,287 people
- By 2030
- 151,867 · +0.4%
- By 2040
- 149,927 · -0.9%
- By 2050
- 144,081 · -4.8%
- By 2075
- 132,018 · -12.7%
- By 2100
- 111,733 · -26.1%
Race, ethnicity, and origin ACS 2023
- Neighborhood character
- Predominantly White (96%)
- Race & ethnicity
- White 96% Two or more races 2% Asian 2% Hispanic / Latino 1%
- Common ancestry
- Lithuanian 9% Italian 3% Slovak 3%
- Foreign-born
- 3% · South Korea, Canada
Political lean MEDSL · Merrimack
- 2024 margin
- Lean D (+5.2) · D 52.1% · R 46.9% · Other 1.0%
- 2008→2024 swing
- -8.7pp toward R · 2008: 13.9pp · 2024: 5.2pp
- All cycles
- 2024: D+5.2 2020: D+9.8 2016: D+3.1 2012: D+12.7 2008: D+13.9
Not yet ingested
- Civics
- —
Market trends
- HPI YoY
- ▲ 59.19%
- Current HPI
- 399.4332
- Rent YoY
- —
- Metro
- —
- State GDP YoY
- —
- F500 in state
- 0
Price history
+42.1% since first listed7 events — show timeline
- 2026-06-13 Listed $405,000 PrimeMLS
- 2026-06-10 Coming Soon $405,000 PrimeMLS
- 2022-05-25 Sold (Public Records) $260,000 Public Records
- 2022-05-25 Sold (MLS) $260,000 PrimeMLS
- 2022-04-02 Contingent — PrimeMLS
- 2022-03-24 Listed $285,000 PrimeMLS
- 2021-08-03 Price Changed $285,000 PrimeMLS
Property tax history
+3.3%/yrLatest (2025): $7,644 · +0.3% YoY. Source: county tax records.
Cash-flow waterfall
monthlySold comps — $/sqft
last 12 mo · ≤1 miLoading sold comps…