901 S 23rd St · Copperas Cove, TX
Flood risk 1/10 · Minimal
- FEMA flood zone
- X (unshaded)
- Chance of flooding over 30 yrs
- 0.0%
- Est. flood insurance / yr
- $507 – $1,088
Fire risk 6/10 · Moderate
- Est. fire insurance / yr
- $1,222 – $2,270
Heat risk 7/10 · Major
- Hot days now (above 106°F)
- 7 days/yr
- Hot days in 30 yrs
- 23 days/yr
Wind risk 6/10 · Moderate
- Chance of severe wind over 30 yrs
- 50.0%
Air-quality risk 1/10 · Minimal
- Unhealthy air days now
- 0 days/yr
- Unhealthy air days in 30 yrs
- 0 days/yr
Risk factors via First Street. Map © Google.
Why this score? — see what drove the C grade
The composite is a weighted blend of 9 inputs, each scored 0–100. Each bar is that input's sub-score; the figure is the points it added to the 100-point composite (weight × sub-score).
- Cash flow +20.9/30.0
- ARV discount +15.0/15.0
- DSCR +6.7/10.0
- 1% rule +4.5/10.0
- Schools +3.6/10.0
- Livability +3.2/5.0
- Condition / age +2.5/5.0
- Rent growth +2.4/5.0
- Appreciation +0.0/10.0
$106,999
🖨 Deal sheet (PDF) 📄 Offer letter ✓ Due diligence
Listing remarks MLS
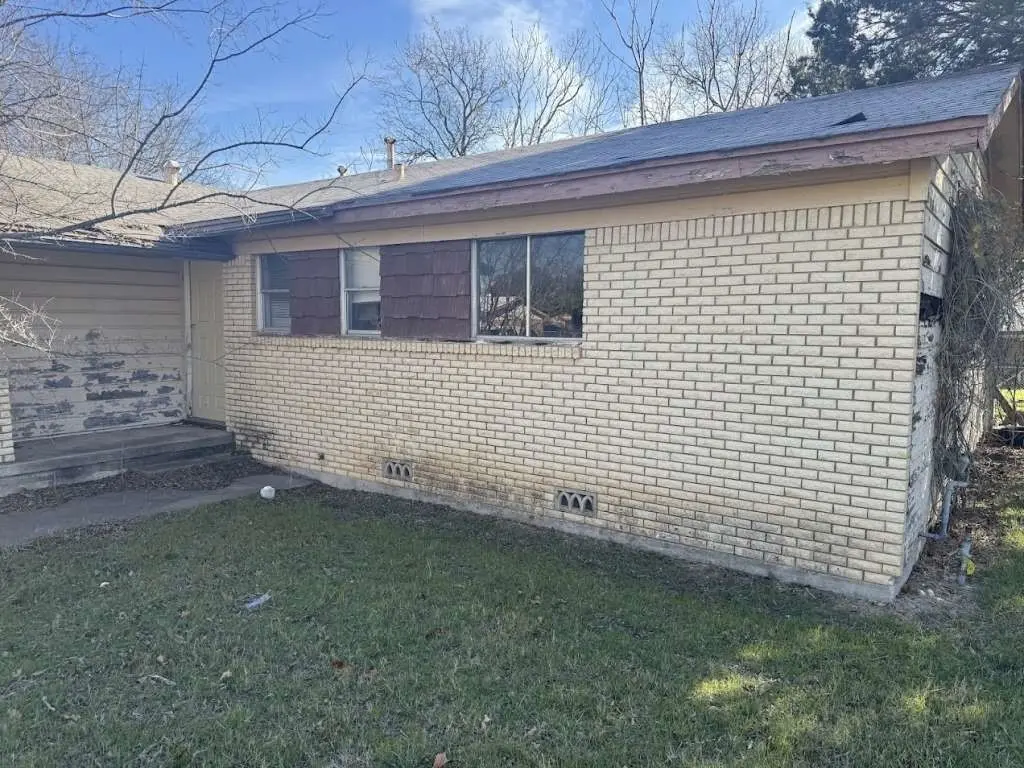
BRICK FIXER UPPER! Take a look at this brick home with attached 2 car garage in Copperas Cove! Situated on a spacious corner lot and about an hour drive from Austin, Texas! WE MAKE IT EASY TO OWN. This is a great opportunity! Don't wait call us today to get more information on the owner's easy terms and smooth process that may be able to put the deed in your name and make this your dream home.
Key facts
- Spacious corner lot
- Brick home
- 8,324 sq ft lot
Tags
Neighborhood map
What this means for you Summary
Snapshot
- This is a 3-bed/2.0-bath single-family listed at $107k.
Deal economics
- At list price, monthly cash flow is $149 ($2k/yr) — positive.
- The deal already cash-flows at list — no discount required.
- To meet the 1% rule (rent ≥ 1% of price), the offer needs to be $102k (4.8% below list).
- Recommended offer: $94k (12.0% below list) — sets the bar for market timing.
- Cap rate 8.0% vs local median 3.5% in Copperas Cove — top-decile yield for the area; either an underpriced asset or a hidden risk that comps aren't pricing in. Stress-test before assuming the spread holds.
Location & tenants
- Location reads 65/100 on livability (#706 in TX) — a middle-class / working-renter tenant base. Strengths: cost of living A+, housing A+; Watch: employment D+, amenities F, commute F.
- Copperas Cove ISD (suburban): math 41% / reading 42% proficiency, ranked #340 of 826 in TX (top 41%) — families likely to look elsewhere, expect single-tenant / working-renter base with shorter leases.
- Zoned schools: Fairview/Miss Jewell El (math 39% / reading 42%, grade F, #1,490 of 4,322 statewide, top 35%, 500 students, 77% FRL); Copperas Cove J H (math 43% / reading 42%, grade D-, #553 of 1,662 statewide, top 34%, 924 students, 63% FRL); Copperas Cove H S (math 29% / reading 42%, grade F, #941 of 1,632 statewide, top 58%, 2,277 students, 52% FRL) — zoned schools average 64% FRL vs 41% district-wide (23 pts higher); higher-poverty schools than district average — tighter screening recommended.
- Market conditions: Rents soft (-0.2%/yr); 610 active listings in the ZIP; 40 comparable units currently listed for rent nearby; rentals lingering (median 45d on market — plan ~5-8 weeks vacancy on turnover, expect pricing pressure); 58% of comp listings sitting > 30 days — soft ceiling on asking rent; 386 units permitted in Coryell County in 2024 (0 in 5+ unit buildings).
- This rent is only 17% of the median local income ($72k/yr) — well below the 30% rent-burden line; pricing power to push rent on renewal without tenant pushback.
Forward outlook
- Local home prices are declining (-3.0%/yr); year-one equity from $740 of loan paydown is wiped out by about $3k of value loss. Plan a longer hold.
Negotiation context
- It's been on market 375 days — a 12% lower offer ($94k) is reasonable based on typical stale-listing flexibility.
Risks & watch-outs
- Climate carrying-cost: major wind risk, 50% chance of damaging wind over 30y; major wildfire risk; extreme-heat days projected 7→23/yr by 2055 (HVAC capex compounding) — expect insurance premiums to compound above CPI over the hold.
Questions for the listing agent
- It's been on market 375 days. Have you received any prior offers? Is the seller open to a 12% concession, seller financing, or rate buy-down credit?
- Built in 1963 — when were the roof, HVAC, electrical panel, plumbing, and water heater last replaced?
- Why hasn't it sold? Are there any deal-killer items the seller is aware of (foundation, flood, title, zoning, code violations)?
- Is there a deadline driving the sale (1031 exchange, divorce, estate, relocation)? That informs how much negotiation room exists.
- What's the average days-on-market for RENTAL listings here right now (not sales)? A rising rental-DOM trend means longer vacancies and softer asking-rent achievability than the comps imply.
- What's the recent tenant-quality profile in this submarket — average credit score on applications, eviction rate, late-payment / NSF rate, and stable-employment percentage? A property-management company in the area should have these aggregated.
- How much new for-sale + rental construction is in the pipeline within 1–3 miles? Heavy new supply typically softens prices + rents 12–24 months out; constrained supply supports both.
Investment metrics
- 1% rule
- 0.95% ✗
- Cap rate
- 7.97%
- Cash-on-cash
- 5.98%
- DSCR
- 1.27
- GRM
- 8.8
CMA / ARV
- ARV (median comp)
- $134,745
- List price
- $106,999
- Delta
- -20.59%
- Verdict
- UNDERPRICED
- Comps
- 20 within 1.0 mi
Show comp detail 12 sales within ~0.75 mi
| Address | Dist | Beds/Ba | Sqft | Sold | Price | $/sf | Match |
|---|---|---|---|---|---|---|---|
| 803 Sandy Ct | 0.19mi | 2/1.0 (-1) | 936 (-1%) | 5mo | $60,000 | $64 | 76 |
| 1005 S 25th St | 0.15mi | 3/1.0 | 989 (+4%) | 7mo | $138,000 | $140 | 76 |
| 1106 S 15th St | 0.26mi | 3/1.5 | 1,032 (+9%) | 1mo | $160,882 | $156 | 70 |
| 2122 Circle Dr | 0.40mi | 3/2.0 | 1,036 (+9%) | 4mo | $165,000 | $159 | 63 |
| 1004 S 17th St | 0.16mi | 3/2.0 | 1,086 (+15%) | 7mo | $165,000 | $152 | 62 |
| 1102 S 3rd St | 0.51mi | 3/2.0 | 1,039 (+10%) | 2mo | $115,000 | $111 | 58 |
| 2313 Post Oak Ave | 0.63mi | 3/1.5 | 1,008 (+6%) | 2mo | $168,500 | $167 | 56 |
| 401 Veterans Ave | 0.69mi | 2/1.0 (-1) | 912 (-4%) | 2mo | $98,000 | $107 | 50 |
| 2321 Terrace Dr | 0.48mi | 3/1.0 | 1,056 (+12%) | 8mo | $169,900 | $161 | 48 |
| 506 Veterans Ave | 0.66mi | 3/1.0 | 1,034 (+9%) | 3mo | $150,000 | $145 | 48 |
| 2806 Live Oak Dr | 0.60mi | 3/1.5 | 1,056 (+12%) | 5mo | $175,000 | $166 | 46 |
| 2410 Meadow Ln | 0.63mi | 3/1.0 | 1,022 (+8%) | 9mo | $129,900 | $127 | 46 |
Match score weights: distance 35% · size 25% · config 20% · recency 20%. Top-matched comps best support the ARV.
Projected returns pro-forma
-3.0% appreciation · 0.0% rent growth · sell at horizon
- IRR
- -10.2%
- Equity multiple
- 0.64×
- Total profit
- $-10,854
- Equity at exit
- $15,954
- IRR
- -5.2%
- Equity multiple
- 0.70×
- Total profit
- $-8,893
- Equity at exit
- $9,251
Cash invested: $29,960 (down + closing). Projections, not guarantees.
Landlord ↔ Tenant lean methodology
- Overall (STATE)
- 87 Strongly Landlord-Friendly
- State Texas
- 87 Strongly Landlord-Friendly · R+5
- County
- — inherits STATE
- City
- — inherits STATE
ZIP-level market 76522
- Home prices YoY
- -22.4%
- Rents YoY
- -0.2%
- Active inventory
- 610
- Price-to-rent
- 8.8×
Monthly cashflow live
- Estimated rent
- $1,018 high interval (Pro) →
- Mortgage (P&I)
- −$561
- Tax from tax record
- −$49 /mo · $593/yr
- Insurance
- −$45
- HOA
- −$0
- Vacancy / Maint / Mgmt
- −$214
- Net cashflow
- $149
Break-even live
Sensitivity live
| Price | -10% $210 | -5% $180 | +0% $149 | +5% $119 | +10% $89 |
|---|---|---|---|---|---|
| Rent | -10% $69 | -5% $109 | +0% $149 | +5% $189 | +10% $230 |
| Rate | -1.0pp $203 | -0.5pp $176 | base $149 | +0.5pp $121 | +1.0pp $93 |
UW: 25.0% down · 7.5% · 30yr · 1.5% tax · 5.0% vac · 8.0% maint · 8.0% mgmt
Financing live
Cash to close
- Down payment
- $26,750
- Closing costs
- $3,210
- Reserves months
- —
- Total cash needed
- —
Loan-product check · same deal, 3 products live
Conventional
25% down · 7.5% · 30yr
- Down + closing
- —
- Monthly P&I
- —
- Monthly cashflow
- —
- DSCR
- —
- Eligible?
- —
Personal DTI + credit; lowest rate.
DSCR
20% down · 8.5% · 30yr
- Down + closing
- —
- Monthly P&I
- —
- Monthly cashflow
- —
- DSCR
- —
- Eligible?
- —
No personal income docs; deal must DSCR.
Hard money
10% down · 12.0% · 12mo
- Down + closing
- —
- Monthly P&I
- —
- Monthly cashflow
- —
- DSCR
- —
- Eligible?
- —
Short-term bridge; refi at stabilization.
Rent comps 40 comps
| Address | Beds | Baths | Sqft | Rent | $/sqft | DOM | Units | Dist |
|---|---|---|---|---|---|---|---|---|
| 909 S 17th St Unit 907 Copperas Cove, TX | 2.0 | 1.0 | 600 | $875 | $1.46 | 45d | 1 | 0.12mi |
| 915 S 15th St Copperas Cove, TX | 3.0 | 2.0 | 1008 | $850 | $0.84 | 15d | 1 | 0.19mi |
| 1208 S 19th St Copperas Cove, TX | 3.0 | 1.5 | 1010 | $1,525 | $1.51 | 25d | 1 | 0.33mi |
| 1206 Urbantke Ct Unit B Copperas Cove, TX | 2.0 | 1.0 | 754 | $700 | $0.93 | 45d | 1 | 0.33mi |
| 604 S 11th St Copperas Cove, TX | 3.0 | 2.0 | 1119 | $1,300 | $1.16 | 45d | 1 | 0.33mi |
| 1208 Urbantke Ct Unit 6 Copperas Cove, TX | 2.0 | 1.0 | 758 | $695 | $0.92 | 45d | 1 | 0.33mi |
| 1208 Urbantke Ct Unit 10 Copperas Cove, TX | 2.0 | 1.0 | 758 | $595 | $0.78 | 25d | 1 | 0.33mi |
| 1008 S 9th St Unit B Copperas Cove, TX | 2.0 | 1.0 | 796 | $700 | $0.88 | 45d | 1 | 0.35mi |
| 2107 Brantley Ave Copperas Cove, TX | 3.0 | 1.0 | 816 | $995 | $1.22 | 15d | 1 | 0.45mi |
| 808 Mary St Copperas Cove, TX | 3.0 | 1.0 | 1028 | $1,300 | $1.26 | 45d | 1 | 0.46mi |
| 904 Mary St Copperas Cove, TX | 3.0 | 2.0 | 1041 | $1,052 | $1.01 | 45d | 1 | 0.46mi |
| 606 Westview Cir Unit B Copperas Cove, TX | 2.0 | 1.0 | 715 | $700 | $0.98 | 45d | 1 | 0.47mi |
| 606 Westview Cir Unit B Copperas Cove, TX | 2.0 | 1.0 | 715 | $700 | $0.98 | 22d | 1 | 0.47mi |
| 1004 S 3rd St Copperas Cove, TX | 3.0 | 1.0 | 940 | $950 | $1.01 | 25d | 1 | 0.48mi |
| 403 S 7th St Copperas Cove, TX | 3.0 | 1.0 | 910 | $1,100 | $1.21 | 45d | 1 | 0.49mi |
| 1010 Georgetown Rd Copperas Cove, TX | 3.0 | 1.0 | 1018 | $995 | $0.98 | 45d | 1 | 0.52mi |
| 1012 Georgetown Rd Copperas Cove, TX | 2.0 | 1.0 | 690 | $800 | $1.16 | 45d | 1 | 0.53mi |
| 1202 S 3rd St Copperas Cove, TX | 3.0 | 2.0 | 1056 | $1,175 | $1.11 | 45d | 1 | 0.54mi |
| 402 Mary St Apt 204 Copperas Cove, TX | 2.0 | 1.0 | 850 | $725 | $0.85 | 45d | 1 | 0.54mi |
| 624 Sunset Ln Unit B Copperas Cove, TX | 2.0 | 1.0 | 710 | $600 | $0.85 | 15d | 1 | 0.57mi |
| 401 Sunset Ln Unit A Copperas Cove, TX | 2.0 | 1.0 | 690 | $795 | $1.15 | 45d | 1 | 0.61mi |
| 610 Casa Dr Copperas Cove, TX | 2.0 | 1.0 | 750 | $895 | $1.19 | 15d | 1 | 0.61mi |
| 305 Horseshoe Dr Copperas Cove, TX | 2.0 | 1.0 | 850 | $850 | $1.00 | 45d | 1 | 0.64mi |
| 410 Veterans Ave Unit 5 Copperas Cove, TX | 2.0 | 1.0 | 800 | $750 | $0.94 | 45d | 1 | 0.64mi |
| 307 Sunset Ln Unit 4 Copperas Cove, TX | 2.0 | 1.0 | 754 | $700 | $0.93 | 15d | 1 | 0.64mi |
| 307 Sunset Ln Unit 6 Copperas Cove, TX | 2.0 | 1.0 | 800 | $650 | $0.81 | 45d | 1 | 0.65mi |
| 208 Veterans Ave Unit 106 Copperas Cove, TX | 2.0 | 1.0 | 829 | $650 | $0.78 | 25d | 1 | 0.65mi |
| 101 Meggs St Unit F Copperas Cove, TX | 2.0 | 1.0 | 725 | $695 | $0.96 | 45d | 1 | 0.66mi |
| 204 West Avenue F Unit A Copperas Cove, TX | 2.0 | 1.0 | 895 | $725 | $0.81 | 45d | 1 | 0.66mi |
| 204 West Avenue F Unit B Copperas Cove, TX | 2.0 | 1.0 | 895 | $705 | $0.79 | 45d | 1 | 0.67mi |
| 722 West Avenue B Unit B Copperas Cove, TX | 2.0 | 1.0 | 620 | $1,000 | $1.61 | 45d | 1 | 0.67mi |
| 1202 S FM 116 Copperas Cove, TX | 1.0–3.0 | 1.0–2.0 | 922 | $1,560 | $1.69 | 15d | 12 | 0.83mi |
| 310 W Washington Ave Unit A Copperas Cove, TX | 2.0 | 1.0 | 661 | $700 | $1.06 | 45d | 1 | 0.87mi |
| 401 W Lincoln Ave Unit 2 Copperas Cove, TX | 2.0 | 1.0 | 740 | $850 | $1.15 | 25d | 1 | 0.90mi |
| 304 Carpenter St Unit 7 Copperas Cove, TX | 2.0 | 1.0 | 850 | $775 | $0.91 | 25d | 1 | 0.93mi |
| 304 Carpenter St Unit 1 Copperas Cove, TX | 2.0 | 1.0 | 850 | $775 | $0.91 | 45d | 1 | 0.93mi |
| 102 East Avenue A Apt 7 Copperas Cove, TX | 2.0 | 1.0 | 560 | $585 | $1.04 | 15d | 1 | 0.96mi |
| 102 East Avenue A Apt 7 Copperas Cove, TX | 2.0 | 1.0 | 560 | $585 | $1.04 | 25d | 1 | 0.96mi |
| 910 Hill St Copperas Cove, TX | 3.0 | 1.0 | 1036 | $995 | $0.96 | 25d | 1 | 0.98mi |
| 914 Chalk St Copperas Cove, TX | 3.0 | 2.0 | 1107 | $1,200 | $1.08 | 25d | 1 | 0.99mi |
Listing history 18 events
-
2026-06-21days on market $106,999 Active 375 DOM
-
2026-06-18days on market $106,999 Active 372 DOM
-
2026-06-17days on market $106,999 Active 371 DOM
-
2026-06-16days on market $106,999 Active 370 DOM
-
2026-06-15days on market $106,999 Active 369 DOM
-
2026-06-14days on market $106,999 Active 367 DOM
-
2026-06-13days on market $106,999 Active 366 DOM
-
2026-06-10days on market $106,999 Active 364 DOM
-
2026-06-09days on market $106,999 Active 363 DOM
-
2026-06-08days on market $106,999 Active 362 DOM
-
2026-06-07days on market $106,999 Active 361 DOM
-
2026-06-05days on market $106,999 Active 358 DOM
-
2026-06-03days on market $106,999 Active 357 DOM
-
2026-06-02days on market $106,999 Active 356 DOM
-
2026-06-01days on market $106,999 Active 355 DOM
-
2026-05-31days on market $106,999 Active 354 DOM
-
2026-05-30days on market $106,999 Active 353 DOM
-
2025-06-11$106,999 Active 397-char remark
Show marketing remark (397 chars)
BRICK FIXER UPPER! Take a look at this brick home with attached 2 car garage in Copperas Cove! Situated on a spacious corner lot and about an hour drive from Austin, Texas! WE MAKE IT EASY TO OWN. This is a great opportunity! Don't wait call us today to get more information on the owner's easy terms and smooth process that may be able to put the deed in your name and make this your dream home.
ⓘ Source: listings_history table (triggers on properties + properties_extension) + one-shot
backfill from property_details.listing_events for pre-trigger history.
Tax reassessment forecast TX · Resets to sale price
- Current annual tax
- $593 · $49/mo
- Projected year-2 tax
- $1,958 · $163/mo
- Expected delta
- +$1,365/yr (+$114/mo · 230.3%)
ⓘ Screening estimate from a state-policy table — verify with the county assessor before closing.
Climate risk First Street
- Flood 1/10 Low FEMA zone X (unshaded) · 0% chance over 30 yrs
- Wildfire 6/10 Major
- Heat 7/10 Severe 7 d/yr ≥106°F today · 23 d/yr by 30 yrs out
- Wind 6/10 Major 50% chance of damaging wind over 30 yrs
- Air quality 1/10 Low 0 unhealthy d/yr today · 0 by 30 yrs out
Nearby sold comps map
Loading sold comps map…
Walkable amenities ~0.75 mi
Loading nearby amenities…
Taxation est. · year 1
- Rental income
- $12,218
- − Mortgage interest
- −$5,994
- − Property taxes
- −$593
- − Insurance
- −$535
- − Repairs & maintenance
- −$977
- − Management
- −$977
- − Depreciation
- −$3,113
- Taxable income
- $29
- Est. tax owed @ 24.0%
- −$7
- After-tax cash flow
- $1,784/yr
For passive investors: Depreciation is non-cash, so a rental often shows a tax loss while cash-flowing — sheltering income. Rental losses are passive: they offset passive income freely, and up to $25,000/yr can offset ordinary (W-2) income if you actively participate and your MAGI is under $100k (phasing out to $0 by $150k); unused losses carry forward. On sale, claimed depreciation is recaptured at up to 25%, and gains may owe capital-gains tax (a 1031 exchange can defer both). Figures are a year-1 estimate at your 24.0% rate — not tax advice; consult a CPA.
Schools (NCES district)
- District
- Copperas Cove ISD
- NCES district ID
- 4815240
- Math proficiency
- 41% ▼ -6.00%
- Reading proficiency
- 42% ▼ -2.00%
- Median HH income
- $51,072
- Composite
- 35.85/100
- National rank
- #4822
- State rank
- #340 of 826 in TX
Livability — Copperas Cove
- Score
- 65/100
- State rank
- #706
- US rank
- #13158
Category grades
Schools grade is shown separately in the Schools card above.
Census & demographics
- Census place
- Copperas Cove, TX
- County
- Coryell County · 61,053 people
- City population
- 42,118
- Metro
- Killeen-Temple, TX
- Population (ZIP)
- 42,118
- Household income
- $72,206
- Rent vs Own
- Severe rent burden
- 1019.0
Population outlook (Coryell County) Hauer SSP2
- Today (2025)
- 75,485 people
- By 2030
- 75,627 · +0.2%
- By 2040
- 74,898 · -0.8%
- By 2050
- 74,221 · -1.7%
- By 2075
- 72,688 · -3.7%
- By 2100
- 66,862 · -11.4%
Race, ethnicity, and origin ACS 2023
- Neighborhood character
- Diverse neighborhood (Simpson 0.66)
- Race & ethnicity
- White 53% Hispanic / Latino 21% Two or more races 20% Black 14% Asian 2%
- Hispanic origin (detail)
- Mexican 11% Puerto Rican 6%
- Common ancestry
- Romanian 2% Italian 2% Lithuanian 2%
- Foreign-born
- 7% · Canada, South Korea
- Languages at home
- 85% English-only · Spanish 10% German/W. Germanic 2% Other Asian/Pacific 1%
Political lean MEDSL · Coryell
- 2024 margin
- Solid R (+40.7) · D 29.1% · R 69.8% · Other 1.1%
- 2008→2024 swing
- -13.8pp toward R · 2008: -26.9pp · 2024: -40.7pp
- All cycles
- 2024: R+40.7 2020: R+33.5 2016: R+39.5 2012: R+36.6 2008: R+26.9
Not yet ingested
- Civics
- —
Market trends
- HPI YoY
- ▼ -53.11%
- Current HPI
- 183.9452
- Rent YoY
- ▼ -0.25%
- Metro
- Killeen-Temple, TX
- State GDP YoY
- ▲ 3.95%
- F500 in state
- 110
Industry mix (Fortune 500 HQ in TX)
| Industry | F500 HQs | Revenue |
|---|---|---|
| Energy | 16 | $1,198B |
|
||
| Technology | 5 | $198B |
|
||
| Engineering / Construction | 4 | $72B |
|
||
| Energy Services | 3 | $60B |
|
||
| Utilities | 3 | $41B |
|
||
| Healthcare | 2 | $330B |
|
||
Price history
1 event — show timeline
- 2025-06-11 Listed $106,999 HARMLS
Property tax history
-8.4%/yrLatest (2025): $593 · -74.3% YoY. Source: county tax records.
Cash-flow waterfall
monthlySold comps — $/sqft
last 12 mo · ≤1 miLoading sold comps…