 🏷️ Likely Rental
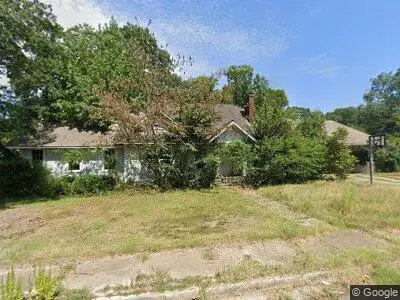
116 Scotta St · Warren, AR
Flood risk 1/10 · Minimal
- FEMA flood zone
- X
- Chance of flooding over 30 yrs
- 0.0%
- Est. flood insurance / yr
- $507 – $1,088
Fire risk 4/10 · Minor
- Est. fire insurance / yr
- $1,499 – $2,785
Heat risk 6/10 · Moderate
- Hot days now (above 110°F)
- 7 days/yr
- Hot days in 30 yrs
- 20 days/yr
Wind risk 6/10 · Moderate
- Chance of severe wind over 30 yrs
- 27.0%
Air-quality risk 1/10 · Minimal
- Unhealthy air days now
- 0 days/yr
- Unhealthy air days in 30 yrs
- 0 days/yr
Risk factors via First Street. Map © Google.
Why this score? — see what drove the D+ grade
The composite is a weighted blend of 9 inputs, each scored 0–100. Each bar is that input's sub-score; the figure is the points it added to the 100-point composite (weight × sub-score).
- Cash flow +15.0/30.0
- ARV discount +7.5/15.0
- Appreciation +5.7/10.0
- 1% rule +5.0/10.0
- DSCR +5.0/10.0
- Livability +3.5/5.0
- Rent growth +2.5/5.0
- Condition / age +2.5/5.0
- Schools +1.9/10.0
$6,500
🖨 Deal sheet (PDF) 📄 Offer letter ✓ Due diligence
Listing remarks
Stately home which is conveniently located on a corner lot within blocks of shopping & amp; the city park. This beautiful home is perfect for the large or growing family. Original details still in the home, butlers pantry in the dining area, small office area located on bottom floor. Massive living room with beautiful mantle. Off the carport is a sun room flanked with bookshelves which makes a perfect quaint reading room. Home also offer& apos; s a separate 400 square foot guest house.
Key facts
- Small office area
- Butlers pantry
- Sun room
Tags
Neighborhood map
What this means for you Summary
Snapshot
- This is a 4-bed/3.0-bath single-family listed at $6k.
Deal economics
- At list price, monthly cash flow is $1k ($13k/yr) — positive.
- The deal already cash-flows at list — no discount required.
- Meets the 1% rule at list price ($1k rent vs $6k).
- Recommended offer: $6k (1.5% below list) — sets the bar for market timing.
Location & tenants
- Location reads 69/100 on livability (#69 in AR) — a middle-class / working-renter tenant base. Strengths: cost of living A+, housing A+, health & safety A+; Watch: schools F, amenities F, commute F.
- Warren School District (town): math 26% / reading 21% proficiency, ranked #198 of 238 in AR (top 83%) — low school quality limits family demand, transient renter base, plan for 1-2y turnover; 66% free/reduced lunch — lower-income household profile, screen leases tightly.
- Market conditions: 37 active listings in the ZIP.
Forward outlook
- In year one you build about $140 of equity ($45 loan paydown + $95 appreciation (1.5% local appreciation)).
- Bradley County population projected at -19% by 2050 — secular population decline; favor cash flow + early exit over multi-decade hold.
- At projected returns (1.5% appreciation + 3.0% rent growth), your $2k cash investment doubles in ~1 year — after that, you're playing with house money.
Negotiation context
- It's been on market 17 days — a 2% lower offer ($6k) is reasonable based on typical stale-listing flexibility.
- 5 sale attempts since 12y ago with the ask held roughly flat each time — persistent listings suggest the price (not the market) is what's stuck; bring a comps-based counter.
Risks & watch-outs
- Watch-outs: built in 1926 — expect roof / HVAC / electrical / plumbing capex.
- Climate carrying-cost: major wind risk, 27% chance of damaging wind over 30y; extreme-heat days projected 7→20/yr by 2055 (HVAC capex compounding) — expect insurance premiums to compound above CPI over the hold.
Questions for the listing agent
- Built in 1926 — when were the roof, HVAC, electrical panel, plumbing, and water heater last replaced?
- Is there a deadline driving the sale (1031 exchange, divorce, estate, relocation)? That informs how much negotiation room exists.
- Schools are F-rated, which usually means shorter tenancies and higher turnover. Who's the typical renter profile here, and what's been the actual vacancy rate?
- The area grade is low — what's the realistic commute time and amenity access for the typical tenant pool here? Any planned neighborhood developments (good or bad) we should know about?
- What's the average days-on-market for RENTAL listings here right now (not sales)? A rising rental-DOM trend means longer vacancies and softer asking-rent achievability than the comps imply.
- What's the recent tenant-quality profile in this submarket — average credit score on applications, eviction rate, late-payment / NSF rate, and stable-employment percentage? A property-management company in the area should have these aggregated.
- How much new for-sale + rental construction is in the pipeline within 1–3 miles? Heavy new supply typically softens prices + rents 12–24 months out; constrained supply supports both.
Investment metrics
- 1% rule
- 21.42% ✓
- Cap rate
- 201.02%
- Cash-on-cash
- 695.46%
- DSCR
- 31.94
- GRM
- 0.4
CMA / ARV
- ARV (on-the-fly)
- $92,380
- Comps found
- 5
Show comp detail 5 sales within ~0.75 mi
| Address | Dist | Beds/Ba | Sqft | Sold | Price | $/sf | Match |
|---|---|---|---|---|---|---|---|
| 201 Arkansas St | 0.35mi | 3/3.0 (-1) | 2,784 (-7%) | 3mo | $195,000 | $70 | 65 |
| 507 Hankins St | 0.73mi | 3/2.5 (-1) | 3,064 (+3%) | 5mo | $75,000 | $24 | 50 |
| 512 Bond St | 0.55mi | 3/2.0 (-1) | 2,907 (-2%) | 15mo | $70,000 | $24 | 49 |
| 401 S Myrtle | 0.35mi | 3/2.0 (-1) | 2,630 (-12%) | 16mo | $210,000 | $80 | 41 |
| 211 E Church | 0.45mi | 4/2.5 | 2,567 (-14%) | 16mo | $80,000 | $31 | 41 |
Match score weights: distance 35% · size 25% · config 20% · recency 20%. Top-matched comps best support the ARV.
Projected returns pro-forma
1.47% appreciation · 3.0% rent growth · sell at horizon
- IRR
- —
- Equity multiple
- 38.07×
- Total profit
- $67,472
- Equity at exit
- $2,378
- IRR
- —
- Equity multiple
- 81.63×
- Total profit
- $146,752
- Equity at exit
- $3,288
Cash invested: $1,820 (down + closing). Projections, not guarantees.
Landlord ↔ Tenant lean methodology
- Overall (STATE)
- 92 Strongly Landlord-Friendly
- State Arkansas
- 92 Strongly Landlord-Friendly · R+14
- County
- — inherits STATE
- City
- — inherits STATE
ZIP-level market 71671
- Home prices YoY
- 1.3%
- Active inventory
- 37
- Price-to-rent
- 0.4×
Monthly cashflow live
- Estimated rent
- $1,392 medium interval (Pro) →
- Mortgage (P&I)
- −$34
- Tax est. 1.5%
- −$8 /mo · $98/yr
- Insurance
- −$3
- HOA
- −$0
- Vacancy / Maint / Mgmt
- −$292
- Net cashflow
- $1,055
Break-even live
Sensitivity live
| Price | -10% $1,059 | -5% $1,057 | +0% $1,055 | +5% $1,053 | +10% $1,050 |
|---|---|---|---|---|---|
| Rent | -10% $945 | -5% $1,000 | +0% $1,055 | +5% $1,110 | +10% $1,165 |
| Rate | -1.0pp $1,058 | -0.5pp $1,056 | base $1,055 | +0.5pp $1,053 | +1.0pp $1,051 |
UW: 25.0% down · 7.5% · 30yr · 1.5% tax · 5.0% vac · 8.0% maint · 8.0% mgmt
Financing live
Cash to close
- Down payment
- $1,625
- Closing costs
- $195
- Reserves months
- —
- Total cash needed
- —
Loan-product check · same deal, 3 products live
Conventional
25% down · 7.5% · 30yr
- Down + closing
- —
- Monthly P&I
- —
- Monthly cashflow
- —
- DSCR
- —
- Eligible?
- —
Personal DTI + credit; lowest rate.
DSCR
20% down · 8.5% · 30yr
- Down + closing
- —
- Monthly P&I
- —
- Monthly cashflow
- —
- DSCR
- —
- Eligible?
- —
No personal income docs; deal must DSCR.
Hard money
10% down · 12.0% · 12mo
- Down + closing
- —
- Monthly P&I
- —
- Monthly cashflow
- —
- DSCR
- —
- Eligible?
- —
Short-term bridge; refi at stabilization.
Listing history 13 events
-
2026-06-19days on market $6,500 Active 17 DOM
-
2026-06-18days on market $6,500 Active 16 DOM
-
2026-06-17days on market $6,500 Active 15 DOM
-
2026-06-16days on market $6,500 Active 14 DOM
-
2026-06-15days on market $6,500 Active 13 DOM
-
2026-06-14days on market $6,500 Active 11 DOM
-
2026-06-12days on market $6,500 Active 10 DOM
-
2026-06-09days on market $6,500 Active 7 DOM
-
2026-06-08days on market $6,500 Active 6 DOM
-
2026-06-07days on market $6,500 Active 5 DOM
-
2026-06-07days on market $6,500 Active 4 DOM
-
2026-06-03remarks 490-char remark
-
2026-06-03$6,500 Active 1 DOM
ⓘ Source: listings_history table (triggers on properties + properties_extension) + one-shot
backfill from property_details.listing_events for pre-trigger history.
Climate risk First Street
- Flood 1/10 Low FEMA zone X · 0% chance over 30 yrs
- Wildfire 4/10 Moderate
- Heat 6/10 Major 7 d/yr ≥110°F today · 20 d/yr by 30 yrs out
- Wind 6/10 Major 27% chance of damaging wind over 30 yrs
- Air quality 1/10 Low 0 unhealthy d/yr today · 0 by 30 yrs out
Nearby sold comps map
Loading sold comps map…
Walkable amenities ~0.75 mi
Loading nearby amenities…
Taxation est. · year 1
- Rental income
- $16,704
- − Mortgage interest
- −$364
- − Property taxes
- −$98
- − Insurance
- −$32
- − Repairs & maintenance
- −$1,336
- − Management
- −$1,336
- − Depreciation
- −$189
- Taxable income
- $13,348
- Est. tax owed @ 24.0%
- −$3,204
- After-tax cash flow
- $9,454/yr
For passive investors: Depreciation is non-cash, so a rental often shows a tax loss while cash-flowing — sheltering income. Rental losses are passive: they offset passive income freely, and up to $25,000/yr can offset ordinary (W-2) income if you actively participate and your MAGI is under $100k (phasing out to $0 by $150k); unused losses carry forward. On sale, claimed depreciation is recaptured at up to 25%, and gains may owe capital-gains tax (a 1031 exchange can defer both). Figures are a year-1 estimate at your 24.0% rate — not tax advice; consult a CPA.
Schools (NCES district)
- District
- Warren School District
- NCES district ID
- 0500006
- Math proficiency
- 26% ▼ -12.00%
- Reading proficiency
- 21% ▼ -6.00%
- Median HH income
- $32,986
- Composite
- 19.22/100
- National rank
- #8810
- State rank
- #198 of 238 in AR
Livability — Warren
- Score
- 69/100
- State rank
- #69
- US rank
- #8546
Category grades
Schools grade is shown separately in the Schools card above.
Census & demographics
- Census place
- Warren, AR
- Population (ZIP)
- 8,788
Population outlook (Bradley County) Hauer SSP2
- Today (2025)
- 10,347 people
- By 2030
- 9,925 · -4.1%
- By 2040
- 9,122 · -11.8%
- By 2050
- 8,336 · -19.4%
- By 2075
- 6,893 · -33.4%
- By 2100
- 5,721 · -44.7%
Race, ethnicity, and origin ACS 2023
- Neighborhood character
- Diverse neighborhood (Simpson 0.62)
- Race & ethnicity
- White 52% Black 28% Hispanic / Latino 16% Native American 6% Two or more races 6%
- Hispanic origin (detail)
- Mexican 16%
- Common ancestry
- Lithuanian 1% Serbian 1% Iranian 1%
- Foreign-born
- 7% · Canada
- Languages at home
- 86% English-only · Spanish 14%
Political lean MEDSL · Bradley
- 2024 margin
- Solid R (+39.0) · D 29.9% · R 69.0% · Other 1.1%
- 2008→2024 swing
- -24.6pp toward R · 2008: -14.4pp · 2024: -39.0pp
- All cycles
- 2024: R+39.0 2020: R+30.7 2016: R+23.4 2012: R+18.5 2008: R+14.4
Not yet ingested
- Civics
- —
Market trends
- HPI YoY
- ▲ 1.47%
- Current HPI
- 114.1937
- Rent YoY
- —
- Metro
- —
- State GDP YoY
- ▲ 3.80%
- F500 in state
- 10
Industry mix (Fortune 500 HQ in AR)
| Industry | F500 HQs | Revenue |
|---|---|---|
| Retail | 1 | $681B |
|
||
| Food / Agriculture | 1 | $53B |
|
||
| Retail / Energy | 1 | $22B |
|
||
| Transportation / Logistics | 1 | $12B |
|
||
| Energy | 1 | $4B |
|
||
Price history
-95.2% since first listed11 events — show timeline
- 2026-06-03 Listed $6,500 FSBO.com
- 2018-02-01 Listing Removed — CARMLS
- 2017-05-25 Listed $99,000 CARMLS
- 2016-12-01 Listing Removed — CARMLS
- 2015-12-04 Listed $115,000 CARMLS
- 2015-11-01 Listing Removed — CARMLS
- 2015-06-03 Listed $124,000 CARMLS
- 2015-01-16 Listing Removed — CARMLS
- 2014-01-15 Listed $137,500 CARMLS
- 2006-11-20 Sold (Public Records) $140,000 Public Records
- 2002-11-27 Sold (Public Records) $135,000 Public Records
Property tax history
-2.7%/yrLatest (2025): $783 · -36.0% YoY. Source: county tax records.
Cash-flow waterfall
monthlySold comps — $/sqft
last 12 mo · ≤1 miLoading sold comps…