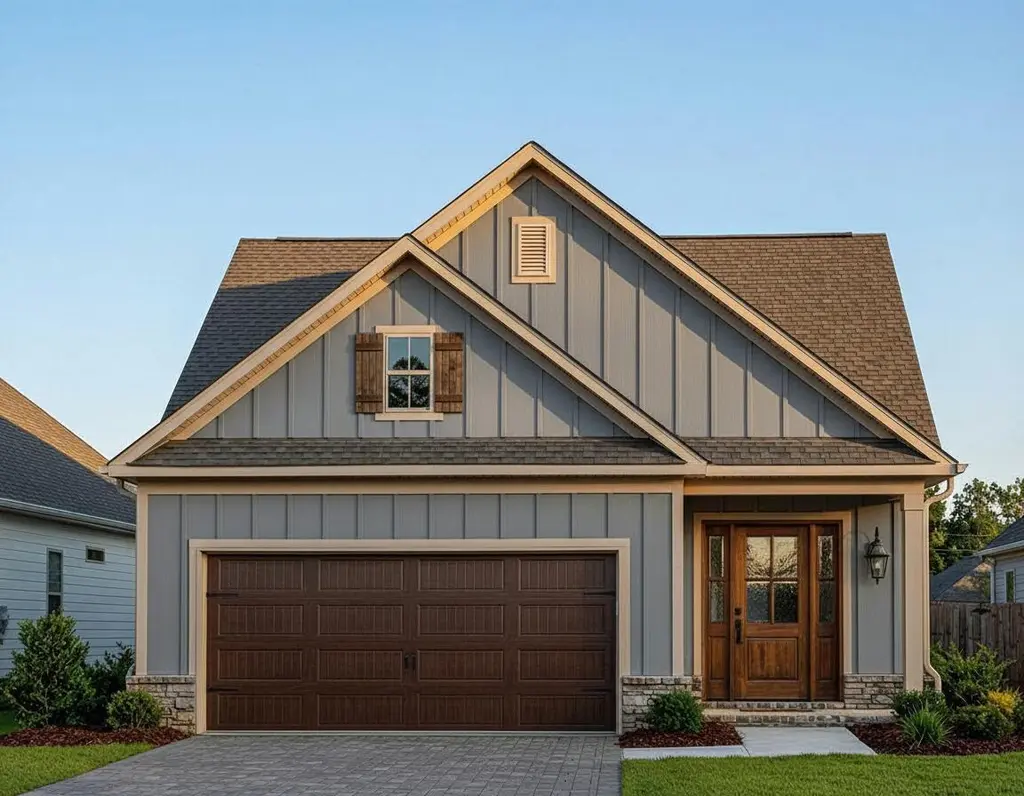
3188 Banter Dr · Burnettown, SC
Flood risk No data
- FEMA flood zone
- —
- Chance of flooding over 30 yrs
- —
- Est. flood insurance / yr
- —
Fire risk No data
- Est. fire insurance / yr
- —
Heat risk No data
- Hot days now (above threshold)
- —
- Hot days in 30 yrs
- —
Wind risk No data
- Chance of severe wind over 30 yrs
- —
Air-quality risk No data
- Unhealthy air days now
- —
- Unhealthy air days in 30 yrs
- —
Risk factors via First Street. Map © Google.
Why this score? — see what drove the D- grade
The composite is a weighted blend of 9 inputs, each scored 0–100. Each bar is that input's sub-score; the figure is the points it added to the 100-point composite (weight × sub-score).
- Appreciation +9.2/10.0
- Cash flow +7.8/30.0
- ARV discount +5.4/15.0
- Condition / age +4.0/5.0
- Schools +3.2/10.0
- Livability +3.2/5.0
- 1% rule +2.5/10.0
- Rent growth +2.5/5.0
- DSCR +1.9/10.0
$359,900
🖨 Deal sheet (PDF) 📄 Offer letter ✓ Due diligence
Listing remarks
Stunning Crawford Construction two-story Mumford Plan featuring 4 bedrooms and 4.5 bathrooms, designed with exceptional attention to detail and quality craftsmanship. Energy-efficient construction includes radiant barrier roofing, while the exterior is enhanced with fiber cement siding, stone accents on the front, and vinyl siding on the sides and rear. Inside, the home offers modern interior trim, designer knock-down ceilings, and upgraded luxury plank flooring with a 20 mil wear layer throughout the main living areas. The gourmet kitchen is beautifully appointed with custom flat-panel soft-close cabinetry, level 1 quartz or granite countertops, an upgraded undermount stainless steel sink,
Key facts
- Fiber cement siding
- Stone accents
- Modern interior trim
Tags
Property features AI
Finance
- Other: Subdivision: Clearwater Preserve
- HOA & community: Homeowners association with annual fee (approximately $533/year); Community pool; Trails; Sport court; Sidewalks and street lights
Exterior
- Parking: Attached garage; 2 garage spaces; 2 total parking spaces; Concrete driveway; Garage door opener
- Security: Smoke detector(s)
- Utilities: Public water; Public sewer; Utilities: see remarks
- Home design: Single-family residence; Two stories; Entry level: 1
- Construction: Stone, vinyl siding, and fiber cement exterior; Composition roof; Slab foundation; New construction; Home warranty included
- Exterior features: Covered patio and porch; Patio; Porch; Fenced yard; Landscaped lot; Front and rear sprinkler systems; Paved road access; Has view
Interior
- Kitchen: Refrigerator; Range; Disposal; Dishwasher; Microwave; Tankless water heater
- Bedrooms: Total rooms: 7
- Flooring: Ceramic tile
- Bathrooms: 4 full bathrooms; 1 half bathroom
- Heating & cooling: Central air; Natural gas heating; Fireplace(s) with insert
- Interior features: Walk-in closets; Entrance foyer; Kitchen island; Pantry; Insulated windows
- Laundry & utility: Washer hookup
Neighborhood map
What this means for you Summary
Snapshot
- This is a 4-bed/4.5-bath single-family listed at $360k. Condition is rated good.
Deal economics
- At list price, monthly cash flow is $-406 ($-5k/yr) — negative.
- To cash-flow at today's rent, offer at most $301k (16.3% below list).
- To meet the 1% rule (rent ≥ 1% of price), the offer needs to be $269k (25.2% below list).
- Recommended offer: $269k (25.2% below list) — sets the bar for 1% rule.
Location & tenants
- Location reads 64/100 on livability (#159 in SC) — a middle-class / working-renter tenant base. Strengths: crime A+, cost of living A+, housing A+; Watch: amenities F, commute F, employment D-.
- Aiken 01 (suburban): math 31% / reading 44% proficiency, ranked #36 of 80 in SC (top 45%) — families likely to look elsewhere, expect single-tenant / working-renter base with shorter leases.
- Zoned schools: Clearwater Elementary (math 42% / reading 47%, grade F, #226 of 597 statewide, top 40%, 370 students, 100% FRL); Langley-Bath-Clearwater Middle (math 25% / reading 35%, grade F, #136 of 229 statewide, top 60%, 634 students, 100% FRL); Midland Valley High (math 31% / reading 83%, grade C, #120 of 196 statewide, top 64%, 1,477 students, 62% FRL) — zoned schools average 87% FRL vs 54% district-wide (33 pts higher); higher-poverty schools than district average — tighter screening recommended.
- Market conditions: 298 active listings in the ZIP; 2 comparable units currently listed for rent nearby; solid renter incomes; 2,500 units permitted in Aiken County in 2024 (1,023 in 5+ unit buildings).
- This rent runs 38% of the median local income ($84k/yr) — at the standard rent-burdened threshold; future hikes will face affordability resistance.
Forward outlook
- In year one you build about $33k of equity ($2k loan paydown + $30k appreciation (8.4% local appreciation)).
- Aiken County population projected at +9% by 2050 — modest demand growth; plan on rents tracking national, not racing it.
- By year 2, paydown + projected appreciation supports a ~$52k cash-out refi (75% LTV) — recoverable capital for the next deal without selling this one.
Negotiation context
- It's been on market 41 days — a 3% lower offer ($349k) is reasonable based on typical stale-listing flexibility.
- 2 sale attempts with the ask held roughly flat each time — persistent listings suggest the price (not the market) is what's stuck; bring a comps-based counter.
Questions for the listing agent
- What do current leases actually rent for vs. the listed asking? Can we see a recent rent roll and the last 12 months of T-12 income?
- It's been on market 41 days. Have you received any prior offers? Is the seller open to a 25% concession, seller financing, or rate buy-down credit?
- What does the HOA fee cover, when was the last increase, and are there any pending special assessments or reserve-fund shortfalls?
- Is there a deadline driving the sale (1031 exchange, divorce, estate, relocation)? That informs how much negotiation room exists.
- Schools are D-rated, which usually means shorter tenancies and higher turnover. Who's the typical renter profile here, and what's been the actual vacancy rate?
- The area grade is low — what's the realistic commute time and amenity access for the typical tenant pool here? Any planned neighborhood developments (good or bad) we should know about?
- What's the average days-on-market for RENTAL listings here right now (not sales)? A rising rental-DOM trend means longer vacancies and softer asking-rent achievability than the comps imply.
- What's the recent tenant-quality profile in this submarket — average credit score on applications, eviction rate, late-payment / NSF rate, and stable-employment percentage? A property-management company in the area should have these aggregated.
- How much new for-sale + rental construction is in the pipeline within 1–3 miles? Heavy new supply typically softens prices + rents 12–24 months out; constrained supply supports both.
Investment metrics
- 1% rule
- 0.75% ✗
- Cap rate
- 4.94%
- Cash-on-cash
- -4.83%
- DSCR
- 0.79
- GRM
- 11.1
CMA / ARV
- ARV (on-the-fly)
- $343,578
- Comps found
- 12
Show comp detail 12 sales within ~0.75 mi
| Address | Dist | Beds/Ba | Sqft | Sold | Price | $/sf | Match |
|---|---|---|---|---|---|---|---|
| 3215 Banter Dr | 0.04mi | 4/3.0 | 2,137 (+8%) | 3mo | $369,900 | $173 | 77 |
| 3216 Banter Dr | 0.01mi | 4/3.0 | 1,800 (-9%) | 1mo | $329,900 | $183 | 77 |
| 7423 Paisley Cir | 0.21mi | 4/2.0 | 2,046 (+3%) | 3mo | $349,900 | $171 | 73 |
| 7400 Paisley Cir | 0.23mi | 3/2.0 (-1) | 2,009 (+1%) | 2mo | $335,155 | $167 | 71 |
| 3229 Banter Dr | 0.02mi | 4/2.5 | 2,221 (+12%) | 3mo | $349,900 | $158 | 68 |
| 8404 Bannock Cir | 0.09mi | 4/2.0 | 1,796 (-10%) | 2mo | $299,900 | $167 | 68 |
| 7288 Paisley Cir | 0.32mi | 4/2.0 | 2,046 (+3%) | 2mo | $346,900 | $170 | 68 |
| 3162 Banter Dr | 0.02mi | 3/2.0 (-1) | 1,766 (-11%) | 1mo | $339,900 | $192 | 65 |
| 7343 Paisley Cir | 0.27mi | 4/3.0 | 1,800 (-9%) | 2mo | $349,900 | $194 | 64 |
| 7326 Paisley Cir | 0.30mi | 4/3.0 | 2,137 (+8%) | 4mo | $369,900 | $173 | 64 |
| 7390 Paisley Cir | 0.24mi | 3/2.0 (-1) | 1,902 (-4%) | 4mo | $332,900 | $175 | 64 |
| 116 Ridgecrest Cir | 0.29mi | 3/2.5 (-1) | 2,141 (+8%) | 3mo | $240,000 | $112 | 58 |
Match score weights: distance 35% · size 25% · config 20% · recency 20%. Top-matched comps best support the ARV.
Projected returns pro-forma
8.38% appreciation · 3.0% rent growth · sell at horizon
- IRR
- 17.2%
- Equity multiple
- 2.30×
- Total profit
- $131,284
- Equity at exit
- $282,784
- IRR
- 16.4%
- Equity multiple
- 4.98×
- Total profit
- $400,791
- Equity at exit
- $570,491
Cash invested: $100,772 (down + closing). Projections, not guarantees.
Landlord ↔ Tenant lean methodology
- Overall (STATE)
- 90 Strongly Landlord-Friendly
- State South Carolina
- 90 Strongly Landlord-Friendly · R+6
- County
- — inherits STATE
- City
- — inherits STATE
ZIP-level market 29829
- Home prices YoY
- 3.0%
- Active inventory
- 298
- Price-to-rent
- 11.1×
Monthly cashflow live
- Estimated rent
- $2,691 medium interval (Pro) →
- Mortgage (P&I)
- −$1,887
- Tax est. 1.5%
- −$450 /mo · $5,398/yr
- Insurance
- −$150
- HOA
- −$44
- Vacancy / Maint / Mgmt
- −$565
- Net cashflow
- $-406
Break-even live
Sensitivity live
| Price | -10% $-157 | -5% $-281 | +0% $-406 | +5% $-530 | +10% $-654 |
|---|---|---|---|---|---|
| Rent | -10% $-618 | -5% $-512 | +0% $-406 | +5% $-299 | +10% $-193 |
| Rate | -1.0pp $-224 | -0.5pp $-314 | base $-406 | +0.5pp $-499 | +1.0pp $-594 |
UW: 25.0% down · 7.5% · 30yr · 1.5% tax · 5.0% vac · 8.0% maint · 8.0% mgmt
Financing live
Cash to close
- Down payment
- $89,975
- Closing costs
- $10,797
- Reserves months
- —
- Total cash needed
- —
Loan-product check · same deal, 3 products live
Conventional
25% down · 7.5% · 30yr
- Down + closing
- —
- Monthly P&I
- —
- Monthly cashflow
- —
- DSCR
- —
- Eligible?
- —
Personal DTI + credit; lowest rate.
DSCR
20% down · 8.5% · 30yr
- Down + closing
- —
- Monthly P&I
- —
- Monthly cashflow
- —
- DSCR
- —
- Eligible?
- —
No personal income docs; deal must DSCR.
Hard money
10% down · 12.0% · 12mo
- Down + closing
- —
- Monthly P&I
- —
- Monthly cashflow
- —
- DSCR
- —
- Eligible?
- —
Short-term bridge; refi at stabilization.
Rent comps 2 comps
| Address | Beds | Baths | Sqft | Rent | $/sqft | DOM | Units | Dist |
|---|---|---|---|---|---|---|---|---|
| 618 Count Fleet Ct Graniteville, SC | 4.0 | 2.5 | 2362 | $2,299 | $0.97 | 23d | 1 | 1.32mi |
| 6279 Whirlaway Rd Graniteville, SC | 3.0 | 2.0 | 1295 | $1,900 | $1.47 | 23d | 1 | 1.41mi |
HOA detail
- Monthly dues
- $44 · $528/yr
Listing history 19 events
-
2026-06-21days on market $359,900 Active 41 DOM
-
2026-06-18days on market $359,900 Active 38 DOM
-
2026-06-17days on market $359,900 Active 37 DOM
-
2026-06-16days on market $359,900 Active 36 DOM
-
2026-06-15days on market $359,900 Active 35 DOM
-
2026-06-14days on market $359,900 Active 33 DOM
-
2026-06-13days on market $359,900 Active 32 DOM
-
2026-06-10days on market $359,900 Active 30 DOM
-
2026-06-09days on market $359,900 Active 29 DOM
-
2026-06-08days on market $359,900 Active 28 DOM
-
2026-06-07days on market $359,900 Active 27 DOM
-
2026-06-03days on market $359,900 Active 23 DOM
-
2026-06-02days on market $359,900 Active 22 DOM
-
2026-06-01days on market $359,900 Active 21 DOM
-
2026-05-31days on market $359,900 Active 20 DOM
-
2026-05-30days on market $359,900 Active 19 DOM
-
2026-05-11historical
-
2026-04-22$359,900 Active
-
2026-04-22$359,900 Active
ⓘ Source: listings_history table (triggers on properties + properties_extension) + one-shot
backfill from property_details.listing_events for pre-trigger history.
Nearby sold comps map
Loading sold comps map…
Walkable amenities ~0.75 mi
Loading nearby amenities…
Taxation est. · year 1
- Rental income
- $32,286
- − Mortgage interest
- −$20,160
- − Property taxes
- −$5,398
- − Insurance
- −$1,800
- − Repairs & maintenance
- −$2,583
- − Management
- −$2,583
- − HOA
- −$528
- − Depreciation
- −$10,470
- Taxable loss
- −$11,235
- Est. tax savings @ 24.0%
- +$2,697
- After-tax cash flow
- $-2,172/yr
For passive investors: Depreciation is non-cash, so a rental often shows a tax loss while cash-flowing — sheltering income. Rental losses are passive: they offset passive income freely, and up to $25,000/yr can offset ordinary (W-2) income if you actively participate and your MAGI is under $100k (phasing out to $0 by $150k); unused losses carry forward. On sale, claimed depreciation is recaptured at up to 25%, and gains may owe capital-gains tax (a 1031 exchange can defer both). Figures are a year-1 estimate at your 24.0% rate — not tax advice; consult a CPA.
Condition & rehab AI · 1 photo
This home is in excellent condition with modern finishes and energy-efficient features. It is move-in ready with minimal maintenance required.
Value-add opportunities
- Both Painting the exterior and interior — Fresh paint enhances curb appeal and interior aesthetics.
- Both Landscaping improvements — Enhanced landscaping can increase both resale and rental value.
- Both Add a smart home system — Modern technology can increase both resale and rental appeal.
- Both Install smart locks — Smart locks can increase both resale and rental value by enhancing security and convenience.
Renovation cost estimate screening
Value-add ROI direction
- Both Painting the exterior and interior — Fresh paint enhances curb appeal and interior aesthetics. ↑
- Both Landscaping improvements — Enhanced landscaping can increase both resale and rental value. ↑
- Both Add a smart home system — Modern technology can increase both resale and rental appeal. ↑
- Both Install smart locks — Smart locks can increase both resale and rental value by enhancing security and convenience. ↑
ⓘ Cost ranges are severity-bucket heuristics (US national rule-of-thumb). Get contractor quotes + a written scope before underwriting a rehab budget.
Schools (NCES district)
- District
- Aiken 01
- NCES district ID
- 4500720
- Math proficiency
- 31% ▼ -11.00%
- Reading proficiency
- 44% ▼ -1.00%
- Median HH income
- $45,081
- Composite
- 31.91/100
- National rank
- #5857
- State rank
- #36 of 80 in SC
Livability — Burnettown
- Score
- 64/100
- State rank
- #159
- US rank
- #14711
Category grades
Schools grade is shown separately in the Schools card above.
Census & demographics
- Census place
- Burnettown, SC
- County
- Aiken County · 116,534 people
- City population
- 931
- Metro
- Augusta-Richmond County, GA-SC
- Population (ZIP)
- 12,385
- Household income
- $84,228
- Rent vs Own
- Severe rent burden
- 213.0
Population outlook (Aiken County) Hauer SSP2
- Today (2025)
- 178,003 people
- By 2030
- 182,876 · +2.7%
- By 2040
- 189,970 · +6.7%
- By 2050
- 193,840 · +8.9%
- By 2075
- 199,453 · +12.1%
- By 2100
- 192,403 · +8.1%
Race, ethnicity, and origin ACS 2023
- Neighborhood character
- Diverse neighborhood (Simpson 0.58)
- Race & ethnicity
- White 59% Black 26% Hispanic / Latino 12% Two or more races 9% Asian 1%
- Hispanic origin (detail)
- Mexican 8% Puerto Rican 1%
- Common ancestry
- Italian 2% Swedish 2% Slovak 1%
- Foreign-born
- 6% · Canada
- Languages at home
- 89% English-only · Spanish 10% Other Indo-European 1%
Political lean MEDSL · Aiken
- 2024 margin
- Strong R (+25.9) · D 36.4% · R 62.2% · Other 1.4%
- 2008→2024 swing
- -1.9pp toward R · 2008: -24.0pp · 2024: -25.9pp
- All cycles
- 2024: R+25.9 2020: R+22.7 2016: R+27.5 2012: R+26.0 2008: R+24.0
Not yet ingested
- Civics
- —
Market trends
- HPI YoY
- ▲ 8.38%
- Current HPI
- 286.4155
- Rent YoY
- —
- Metro
- Augusta-Richmond County, GA-SC
- State GDP YoY
- ▲ 4.51%
- F500 in state
- 2
Industry mix (Fortune 500 HQ in SC)
| Industry | F500 HQs | Revenue |
|---|---|---|
| Packaging | 1 | $7B |
|
||
Price history
+0.0% since first listed3 events — show timeline
- 2026-05-11 Listing Removed — Hive MLS
- 2026-04-22 Listed $359,900 Hive MLS
- 2026-04-22 Listed $359,900 Hive MLS
Cash-flow waterfall
monthlySold comps — $/sqft
last 12 mo · ≤1 miLoading sold comps…