5023 Hulman Dr · Dayton, OH
Flood risk 1/10 · Minimal
- FEMA flood zone
- X (unshaded)
- Chance of flooding over 30 yrs
- 0.0%
- Est. flood insurance / yr
- $473 – $860
Fire risk 1/10 · Minimal
- Est. fire insurance / yr
- $713 – $1,323
Heat risk 3/10 · Minor
- Hot days now (above 103°F)
- 7 days/yr
- Hot days in 30 yrs
- 19 days/yr
Wind risk 2/10 · Minimal
- Chance of severe wind over 30 yrs
- 0.0%
Air-quality risk 3/10 · Minor
- Unhealthy air days now
- 3 days/yr
- Unhealthy air days in 30 yrs
- 4 days/yr
Risk factors via First Street. Map © Google.
Why this score? — see what drove the C+ grade
The composite is a weighted blend of 9 inputs, each scored 0–100. Each bar is that input's sub-score; the figure is the points it added to the 100-point composite (weight × sub-score).
- Cash flow +24.7/30.0
- ARV discount +13.1/15.0
- DSCR +8.0/10.0
- 1% rule +5.8/10.0
- Rent growth +3.3/5.0
- Livability +3.2/5.0
- Condition / age +2.5/5.0
- Schools +1.3/10.0
- Appreciation +0.0/10.0
$94,900
🖨 Deal sheet 📄 Offer letter ✓ Due diligence
Listing remarks MLS
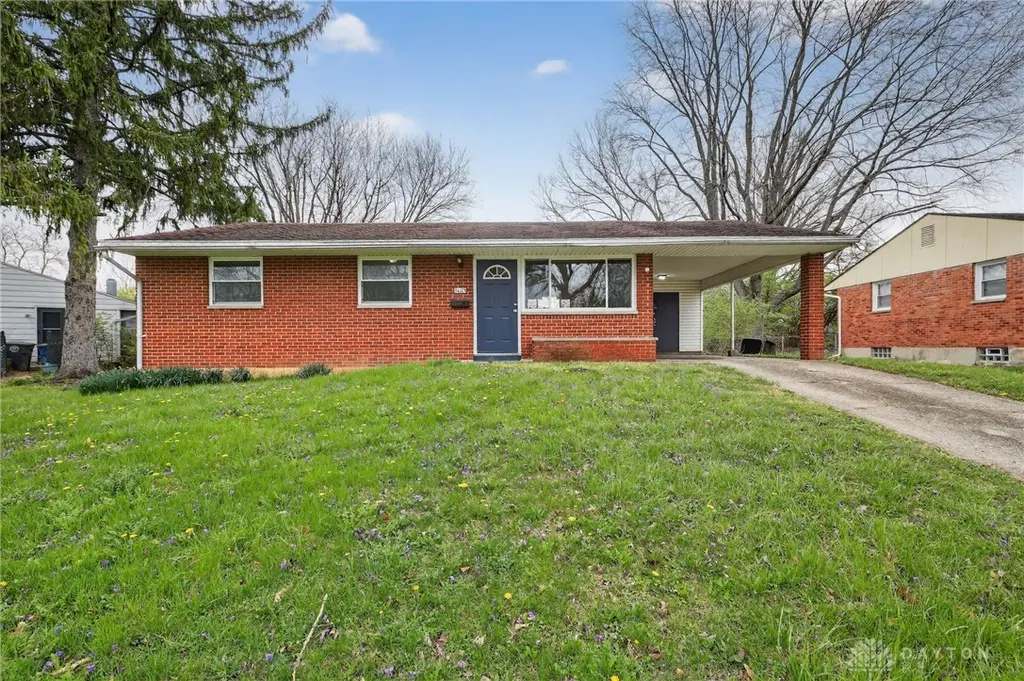
Welcome to this charming and solid brick ranch, perfectly situated on a spacious corner lot in an established Dayton neighborhood. Built in 1956, this home offers a classic and efficient floor plan featuring 3 bedrooms and 1 bathroom across nearly 1,000 square feet of comfortable living space. The low-maintenance brick exterior and tidy yard provide excellent curb appeal, while the backyard offers ample room for outdoor recreation or gardening. Located within the Dayton City School District, this property is conveniently positioned just minutes from local shopping, dining, and public transportation, with easy access to downtown Dayton and major highways. Whether you are an investor looking for a turnkey addition to your rental portfolio or a first-time buyer ready to make a house a home, 5023 Hulman Dr offers significant potential and value. Don't miss out on this fantastic opportunity in a quiet, residential setting!
Key facts
- Outdoor recreation
- Backyard
- Corner lot
Tags
Neighborhood map
What this means for you Summary
Snapshot
- This is a 3-bed/1.0-bath single-family listed at $95k.
Deal economics
- At list price, monthly cash flow is $199 ($2k/yr) — positive.
- The deal already cash-flows at list — no discount required.
- Meets the 1% rule at list price ($1k rent vs $95k).
- Recommended offer: $92k (3.0% below list) — sets the bar for market timing.
Location & tenants
- Location reads 65/100 on livability (#716 in OH) — a middle-class / working-renter tenant base. Strengths: cost of living A+, housing A+, health & safety A; Watch: schools C-, amenities C-, crime F.
- Dayton City (urban): math 12% / reading 21% proficiency, ranked #641 of 656 in OH (top 98%) — low school quality limits family demand, transient renter base, plan for 1-2y turnover; 74% free/reduced lunch — lower-income household profile, screen leases tightly.
- Market conditions: Rents rising (+3.0%/yr); 156 active listings in the ZIP; 23 comparable units currently listed for rent nearby; rentals at typical pace (median 24d on market — plan ~3-4 weeks tenant-placement turnaround); 43% of comp listings sitting > 30 days — soft ceiling on asking rent; lower-income renter base — watch delinquency; 907 units permitted in Montgomery County in 2024 (416 in 5+ unit buildings).
Forward outlook
- Local home prices are declining (-3.0%/yr); year-one equity from $656 of loan paydown is wiped out by about $3k of value loss. Plan a longer hold.
- Montgomery County population projected at -10% by 2050 — secular population decline; favor cash flow + early exit over multi-decade hold.
Negotiation context
- It's been on market 32 days — a 3% lower offer ($92k) is reasonable based on typical stale-listing flexibility.
Risks & watch-outs
- Watch-outs: built in 1956 — expect roof / HVAC / electrical / plumbing capex.
Questions for the listing agent
- It's been on market 32 days. Have you received any prior offers? Is the seller open to a 3% concession, seller financing, or rate buy-down credit?
- Built in 1956 — when were the roof, HVAC, electrical panel, plumbing, and water heater last replaced?
- Is there a deadline driving the sale (1031 exchange, divorce, estate, relocation)? That informs how much negotiation room exists.
- Crime grade is F in this area — have there been break-ins, vandalism, or insurance claims at this property in the last 3 years? What carrier currently insures it and at what premium?
- What's the average days-on-market for RENTAL listings here right now (not sales)? A rising rental-DOM trend means longer vacancies and softer asking-rent achievability than the comps imply.
- What's the recent tenant-quality profile in this submarket — average credit score on applications, eviction rate, late-payment / NSF rate, and stable-employment percentage? A property-management company in the area should have these aggregated.
- How much new for-sale + rental construction is in the pipeline within 1–3 miles? Heavy new supply typically softens prices + rents 12–24 months out; constrained supply supports both.
Investment metrics
- 1% rule
- 1.08% ✓
- Cap rate
- 8.81%
- Cash-on-cash
- 8.99%
- DSCR
- 1.40
- GRM
- 7.7
CMA / ARV
- ARV (median comp)
- $108,399
- List price
- $94,900
- Delta
- -12.45%
- Verdict
- UNDERPRICED
- Comps
- 20 within 1.0 mi
Show comp detail 12 sales within ~0.75 mi
| Address | Dist | Beds/Ba | Sqft | Sold | Price | $/sf | Match |
|---|---|---|---|---|---|---|---|
| 4625 Saint Johns Ave | 0.30mi | 3/2.5 | 1,015 (+4%) | 6mo | $105,000 | $103 | 67 |
| 4647 Greenwich Village Ave | 0.33mi | 3/1.0 | 1,057 (+9%) | 5mo | $20,000 | $19 | 66 |
| 3462 Arlene Ave | 0.44mi | 3/1.0 | 1,044 (+7%) | 3mo | $130,000 | $125 | 65 |
| 4354 Free Pike | 0.46mi | 3/1.0 | 1,044 (+7%) | 3mo | $82,500 | $79 | 64 |
| 4477 Gatewood Pl | 0.56mi | 3/1.5 | 1,032 (+6%) | 1mo | $144,897 | $140 | 61 |
| 4867 Glencross Dr | 0.40mi | 3/1.0 | 1,092 (+12%) | 1mo | $172,000 | $158 | 60 |
| 2451 Grant Ave | 0.66mi | 3/1.0 | 1,056 (+9%) | 3mo | $75,000 | $71 | 53 |
| 4466 Gatewood Pl | 0.54mi | 3/1.0 | 864 (-11%) | 5mo | $77,400 | $90 | 52 |
| 2504 Grant Ave | 0.69mi | 4/1.0 (+1) | 1,056 (+9%) | 1mo | $95,000 | $90 | 48 |
| 4601 Curundu Ave | 0.72mi | 3/1.0 | 884 (-9%) | 5mo | $92,000 | $104 | 47 |
| 4460 Curundu Ave | 0.71mi | 3/1.0 | 864 (-11%) | 3mo | $80,000 | $93 | 46 |
| 4288 Redonda Ln | 0.65mi | 3/2.0 | 864 (-11%) | 4mo | $125,000 | $145 | 44 |
Match score weights: distance 35% · size 25% · config 20% · recency 20%. Top-matched comps best support the ARV.
Projected returns pro-forma
-3.0% appreciation · 3.03% rent growth · sell at horizon
- IRR
- -2.7%
- Equity multiple
- 0.90×
- Total profit
- $-2,676
- Equity at exit
- $14,150
- IRR
- 7.0%
- Equity multiple
- 1.53×
- Total profit
- $14,083
- Equity at exit
- $8,205
Cash invested: $26,572 (down + closing). Projections, not guarantees.
Landlord ↔ Tenant lean methodology
- Overall (STATE)
- 73 Landlord-Friendly
- State Ohio
- 73 Landlord-Friendly · R+6
- County
- — inherits STATE
- City
- — inherits STATE
ZIP-level market 45406
- Rents YoY
- 3.0%
- Active inventory
- 156
- Price-to-rent
- 7.7×
Monthly cashflow live
- Estimated rent
- $1,028 high interval (Pro) →
- Mortgage (P&I)
- −$498
- Tax from tax record
- −$76 /mo · $907/yr
- Insurance
- −$40
- HOA
- −$0
- Vacancy / Maint / Mgmt
- −$216
- Net cashflow
- $199
Break-even live
UW: 25.0% down · 7.5% · 30yr · 1.5% tax · 5.0% vac · 8.0% maint · 8.0% mgmt
Financing live
Cash to close
- Down payment
- $23,725
- Closing costs
- $2,847
- Reserves months
- —
- Total cash needed
- —
Loan-product check · same deal, 3 products live
Conventional
25% down · 7.5% · 30yr
- Down + closing
- —
- Monthly P&I
- —
- Monthly cashflow
- —
- DSCR
- —
- Eligible?
- —
Personal DTI + credit; lowest rate.
DSCR
20% down · 8.5% · 30yr
- Down + closing
- —
- Monthly P&I
- —
- Monthly cashflow
- —
- DSCR
- —
- Eligible?
- —
No personal income docs; deal must DSCR.
Hard money
10% down · 12.0% · 12mo
- Down + closing
- —
- Monthly P&I
- —
- Monthly cashflow
- —
- DSCR
- —
- Eligible?
- —
Short-term bridge; refi at stabilization.
Rent comps 23 comps
| Address | Beds | Baths | Sqft | Rent | $/sqft | DOM | Units | Dist |
|---|---|---|---|---|---|---|---|---|
| 5112 W Hillcrest Ave Unit 1 Dayton, OH | 3.0 | 1.0 | 972 | $700 | $0.72 | 23d | 1 | 0.10mi |
| 2002 Val Vista Ct Dayton, OH | 3.0 | 1.0 | 975 | $1,095 | $1.12 | 21d | 1 | 0.27mi |
| 2014 Hickorydale Dr Unit 2016 Dayton, OH | 2.0 | 1.0 | 800 | $900 | $1.12 | 44d | 1 | 0.33mi |
| 4446 Waymire Ave Dayton, OH | 3.0 | 1.0 | 1100 | $1,100 | $1.00 | 21d | 1 | 0.52mi |
| 4629 Queens Ave Dayton, OH | 2.0 | 1.0 | 900 | $1,100 | $1.22 | 44d | 1 | 0.52mi |
| 2408 Falmouth Ave Dayton, OH | 2.0 | 1.0 | 806 | $950 | $1.18 | 23d | 1 | 0.73mi |
| 2501 Fairport Ave Dayton, OH | 2.0 | 1.0 | 605 | $850 | $1.40 | 44d | 1 | 0.91mi |
| 2609 Fairport Ave Dayton, OH | 3.0 | 1.0 | 1000 | $1,025 | $1.02 | 3d | 1 | 0.93mi |
| 4132 Natchez Ave Dayton, OH | 3.0 | 1.5 | 991 | $1,250 | $1.26 | 3d | 1 | 0.95mi |
| 3711 Pittsburg Ave Dayton, OH | 2.0 | 1.0 | 800 | $875 | $1.09 | 44d | 1 | 1.03mi |
| 4527 Channing Ln Dayton, OH | 3.0 | 1.0 | 946 | $1,600 | $1.69 | 44d | 1 | 1.16mi |
| 1720 Kings Mill Ct Dayton, OH | 2.0 | 1.5 | 975 | $925 | $0.95 | 23d | 1 | 1.20mi |
| 3858 Haney Rd Dayton, OH | 2.0 | 1.0 | 850 | $825 | $0.97 | 3d | 1 | 1.21mi |
| 1732 Harold Dr Dayton, OH | 2.0 | 1.0 | 805 | $925 | $1.15 | 44d | 1 | 1.22mi |
| 3537 Otterbein Ave Unit d Dayton, OH | 2.0 | 1.0 | 900 | $925 | $1.03 | 44d | 1 | 1.26mi |
| 3650 Otterbein Ave Unit 3650 Dayton, OH | 2.0 | 1.0 | 900 | $800 | $0.89 | 3d | 1 | 1.27mi |
| 3652 Otterbein Ave Unit 3652 Dayton, OH | 2.0 | 1.0 | 700 | $800 | $1.14 | 3d | 1 | 1.27mi |
| 4365 Parkway Dr Trotwood, OH | 2.0 | 1.0 | 600 | $800 | $1.33 | 44d | 1 | 1.30mi |
| 3311 Otterbein Ave Dayton, OH | 3.0 | 1.5 | 1004 | $1,300 | $1.29 | 11d | 1 | 1.39mi |
| 4576 Live Oak Dr Dayton, OH | 3.0 | 1.0 | 864 | $1,400 | $1.62 | 44d | 1 | 1.41mi |
| 3552 Stanford Pl Unit 3552 Dayton, OH | 2.0 | 1.0 | 800 | $800 | $1.00 | 44d | 1 | 1.42mi |
| 3552 Stanford Pl Dayton, OH | 2.0 | 1.0 | 800 | $800 | $1.00 | 23d | 1 | 1.42mi |
| 1595 Elaine St Dayton, OH | 3.0 | 1.0 | 864 | $950 | $1.10 | 3d | 1 | 1.49mi |
Listing history 12 events
-
2026-06-18days on market $94,900 Active 32 DOM
-
2026-06-17days on market $94,900 Active 31 DOM
-
2026-06-16days on market $94,900 Active 30 DOM
-
2026-06-15days on market $94,900 Active 29 DOM
-
2026-06-14days on market $94,900 Active 27 DOM
-
2026-06-13pricedays on market $94,900 Active 26 DOM
-
2026-06-10days on market $129,900 Active 24 DOM
-
2026-06-09days on market $129,900 Active 23 DOM
-
2026-06-09pricestatus $129,900 Active 22 DOM
-
2026-05-02status Pending 931-char remark
Show marketing remark (931 chars)
Welcome to this charming and solid brick ranch, perfectly situated on a spacious corner lot in an established Dayton neighborhood. Built in 1956, this home offers a classic and efficient floor plan featuring 3 bedrooms and 1 bathroom across nearly 1,000 square feet of comfortable living space. The low-maintenance brick exterior and tidy yard provide excellent curb appeal, while the backyard offers ample room for outdoor recreation or gardening. Located within the Dayton City School District, this property is conveniently positioned just minutes from local shopping, dining, and public transportation, with easy access to downtown Dayton and major highways. Whether you are an investor looking for a turnkey addition to your rental portfolio or a first-time buyer ready to make a house a home, 5023 Hulman Dr offers significant potential and value. Don't miss out on this fantastic opportunity in a quiet, residential setting!
-
2026-04-10$104,900 Active 931-char remark
Show marketing remark (931 chars)
Welcome to this charming and solid brick ranch, perfectly situated on a spacious corner lot in an established Dayton neighborhood. Built in 1956, this home offers a classic and efficient floor plan featuring 3 bedrooms and 1 bathroom across nearly 1,000 square feet of comfortable living space. The low-maintenance brick exterior and tidy yard provide excellent curb appeal, while the backyard offers ample room for outdoor recreation or gardening. Located within the Dayton City School District, this property is conveniently positioned just minutes from local shopping, dining, and public transportation, with easy access to downtown Dayton and major highways. Whether you are an investor looking for a turnkey addition to your rental portfolio or a first-time buyer ready to make a house a home, 5023 Hulman Dr offers significant potential and value. Don't miss out on this fantastic opportunity in a quiet, residential setting!
-
2024-01-02soldstatus $25,157,500
ⓘ Source: listings_history table (triggers on properties + properties_extension) + one-shot
backfill from property_details.listing_events for pre-trigger history.
Tax reassessment forecast OH · Partial reset (capped growth)
- Current annual tax
- $907 · $76/mo
- Projected year-2 tax
- $1,194 · $99/mo
- Expected delta
- +$287/yr (+$24/mo · 31.6%)
ⓘ Screening estimate from a state-policy table — verify with the county assessor before closing.
Climate risk First Street
- Flood 1/10 Low FEMA zone X (unshaded) · 0% chance over 30 yrs
- Wildfire 1/10 Low
- Heat 3/10 Moderate 7 d/yr ≥103°F today · 19 d/yr by 30 yrs out
- Wind 2/10 Low 0% chance of damaging wind over 30 yrs
- Air quality 3/10 Moderate 3 unhealthy d/yr today · 4 by 30 yrs out
Nearby sold comps map
Loading sold comps map…
Walkable amenities ~0.75 mi
Loading nearby amenities…
Taxation est. · year 1
- Rental income
- $12,333
- − Mortgage interest
- −$5,316
- − Property taxes
- −$907
- − Insurance
- −$474
- − Repairs & maintenance
- −$987
- − Management
- −$987
- − Depreciation
- −$2,761
- Taxable income
- $901
- Est. tax owed @ 24.0%
- −$216
- After-tax cash flow
- $2,173/yr
For passive investors: Depreciation is non-cash, so a rental often shows a tax loss while cash-flowing — sheltering income. Rental losses are passive: they offset passive income freely, and up to $25,000/yr can offset ordinary (W-2) income if you actively participate and your MAGI is under $100k (phasing out to $0 by $150k); unused losses carry forward. On sale, claimed depreciation is recaptured at up to 25%, and gains may owe capital-gains tax (a 1031 exchange can defer both). Figures are a year-1 estimate at your 24.0% rate — not tax advice; consult a CPA.
Schools (NCES district)
- District
- Dayton City
- NCES district ID
- 3904384
- Math proficiency
- 12% ▼ -12.00%
- Reading proficiency
- 21% ▼ -11.00%
- Median HH income
- $28,688
- Composite
- 12.94/100
- National rank
- #9579
- State rank
- #641 of 656 in OH
Livability — Dayton
- Score
- 65/100
- State rank
- #716
- US rank
- #12895
Category grades
Schools grade is shown separately in the Schools card above.
Census & demographics
- Census place
- Dayton, OH
- County
- Montgomery County · 459,541 people
- City population
- 164,387
- Metro
- Dayton-Kettering, OH
- Population (ZIP)
- 19,991
- Household income
- $41,796
- Rent vs Own
- Severe rent burden
- 1504.0
Population outlook (Montgomery County) Hauer SSP2
- Today (2025)
- 523,241 people
- By 2030
- 514,948 · -1.6%
- By 2040
- 493,378 · -5.7%
- By 2050
- 469,639 · -10.2%
- By 2075
- 418,360 · -20.0%
- By 2100
- 353,315 · -32.5%
Race, ethnicity, and origin ACS 2023
- Neighborhood character
- Predominantly Black (75%)
- Race & ethnicity
- Black 75% White 16% Two or more races 7% Hispanic / Latino 3%
- Common ancestry
- Italian 2% Lithuanian 1% Slovak 1%
- Foreign-born
- 2% · Canada
- Languages at home
- 97% English-only · Spanish 1%
Political lean MEDSL · Montgomery
- 2024 margin
- Toss-up / Even · D 49.8% · R 49.3%
- 2008→2024 swing
- -5.8pp toward R · 2008: 6.2pp · 2024: 0.5pp
- All cycles
- 2024: D+0.5 2020: D+2.2 2016: R+1.2 2012: D+3.1 2008: D+6.2
Not yet ingested
- Civics
- —
Market trends
- HPI YoY
- ▼ -113.75%
- Current HPI
- 197.1302
- Rent YoY
- ▲ 3.03%
- Metro
- Dayton-Kettering, OH
- State GDP YoY
- ▲ 1.98%
- F500 in state
- 48
Industry mix (Fortune 500 HQ in OH)
| Industry | F500 HQs | Revenue |
|---|---|---|
| Insurance | 3 | $145B |
|
||
| Industrial Machinery | 3 | $49B |
|
||
| Financial Services | 3 | $24B |
|
||
| Consumer Goods | 2 | $93B |
|
||
| Aerospace / Defense | 2 | $47B |
|
||
| Utilities | 2 | $33B |
|
||
Price history
-99.6% since first listed3 events — show timeline
- 2026-05-02 Pending — Dayton MLS
- 2026-04-10 Listed $104,900 Dayton MLS
- 2024-01-02 Sold (Public Records) $25,157,500 Public Records
Property tax history
+4.0%/yrLatest (2025): $907 · -0.2% YoY. Source: county tax records.
Cash-flow waterfall
monthlySold comps — $/sqft
last 12 mo · ≤1 miLoading sold comps…