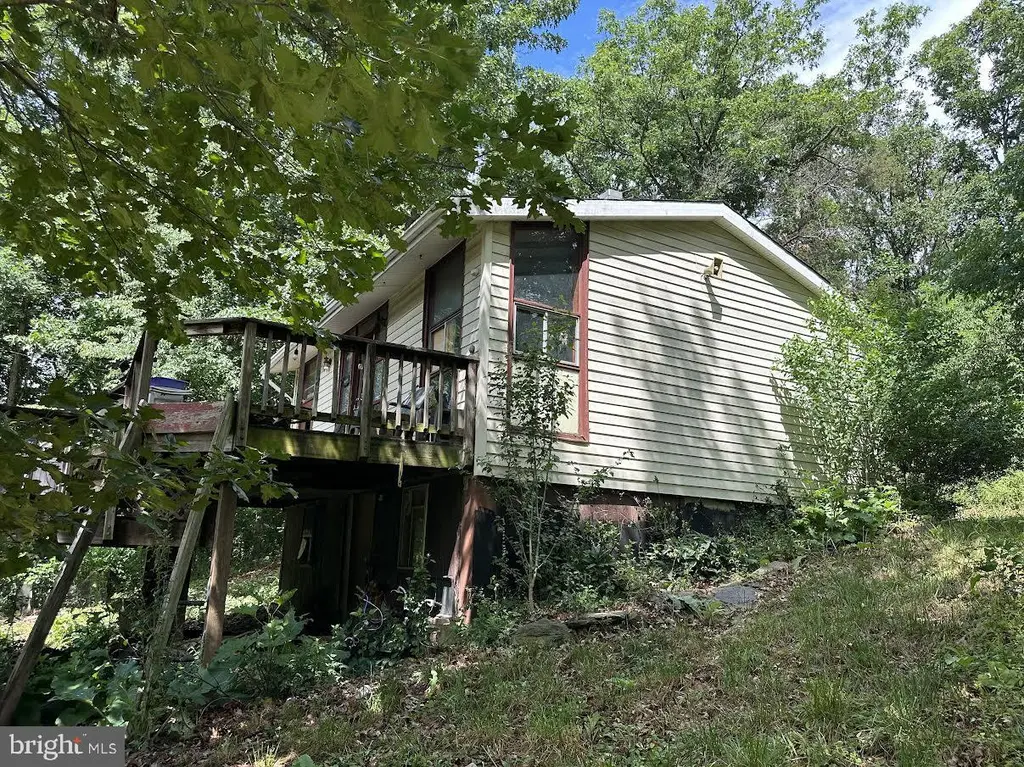
493 Goode Dr · Shenandoah Farms, VA
Flood risk 1/10 · Minimal
- FEMA flood zone
- X (unshaded)
- Chance of flooding over 30 yrs
- 0.0%
- Est. flood insurance / yr
- $473 – $860
Fire risk 4/10 · Minor
- Est. fire insurance / yr
- $666 – $1,236
Heat risk 5/10 · Moderate
- Hot days now (above 98°F)
- 7 days/yr
- Hot days in 30 yrs
- 17 days/yr
Wind risk 2/10 · Minimal
- Chance of severe wind over 30 yrs
- 2.0%
Air-quality risk 2/10 · Minimal
- Unhealthy air days now
- 0 days/yr
- Unhealthy air days in 30 yrs
- 1 days/yr
Risk factors via First Street. Map © Google.
Why this score? — see what drove the B grade
The composite is a weighted blend of 9 inputs, each scored 0–100. Each bar is that input's sub-score; the figure is the points it added to the 100-point composite (weight × sub-score).
- Cash flow +30.0/30.0
- DSCR +10.0/10.0
- 1% rule +8.5/10.0
- ARV discount +7.5/15.0
- Schools +4.9/10.0
- Rent growth +4.6/5.0
- Livability +3.0/5.0
- Condition / age +2.5/5.0
- Appreciation +0.0/10.0
$109,900
🖨 Deal sheet 📄 Offer letter ✓ Due diligence
Listing remarks MLS
Priced to sell! Will move quick at this price on a great little house in the woods! 2B, 1FB, kitchen & LR with wood fireplace, nice front yard, lots of decking. Great get-away or full time living! Sanitary district, lake priviledges. Close to Rt. 50 & I-66 for access. As-IS Where IS. Buyers to do inspections. No HD records. Well & Cistern info per request.
Key facts
- 0.34 acre lot
- 4 parking spots
- Built 1970
Property features AI
Finance
- Other: Ownership: Fee simple; Ground rent paid annually
Exterior
- Parking: Gravel driveway with four driveway parking spaces (total of 4 garage/parking spaces listed)
- Utilities: Water provided by cistern and holding tank; Septic system present; Electric service available (150 Amps); Hot water: electric
- Home design: Detached single-story structure; Building not winterized
- Construction: Vinyl siding; Asphalt roof; Foundation: block and pillar/post/pier (permanent); Wood-framed windows; Above-grade and below-grade other structures noted; Major rehab needed
- Exterior features: Sloping lot; Not in a federal flood zone; Gravel road access
Interior
- Kitchen: Built-in range; Refrigerator
- Bedrooms: Two main-level bedrooms
- Flooring: Engineered wood; Laminate plank; Rough-in flooring noted
- Bathrooms: Two full bathrooms (both on the main level)
- Heating & cooling: Space heater; Electric heating fuel; 150 Amp electrical service
- Interior features: Paneled walls and drywall; Wood ceilings; Unfinished wall areas noted
- Laundry & utility: Washer and dryer (laundry located in the basement)
Neighborhood map
What this means for you Summary
Snapshot
- This is a 2-bed/1.0-bath single-family listed at $110k.
Deal economics
- At list price, monthly cash flow is $476 ($6k/yr) — positive.
- The deal already cash-flows at list — no discount required.
- Meets the 1% rule at list price ($1k rent vs $110k).
- Cap rate 11.5% vs local median 2.8% in Shenandoah Farms — top-decile yield for the area; either an underpriced asset or a hidden risk that comps aren't pricing in. Stress-test before assuming the spread holds.
Location & tenants
- Location reads 60/100 on livability (#440 in VA) — a middle-class / working-renter tenant base. Strengths: crime A+, housing A+, employment A-; Watch: schools F, amenities F, commute F.
- Warren County Public School District (town): math 49% / reading 64% proficiency, ranked #70 of 131 in VA (top 53%) — acceptable for families but not a draw, mixed tenant base, ~2y average lease.
- Market conditions: Rents rising fast (+8.3%/yr); 280 active listings in the ZIP; solid renter incomes; 170 units permitted in Warren County in 2024 (0 in 5+ unit buildings).
Forward outlook
- Local home prices are declining (-3.0%/yr); year-one equity from $760 of loan paydown is wiped out by about $3k of value loss. Plan a longer hold.
- Warren County population projected at +8% by 2050 — modest demand growth; plan on rents tracking national, not racing it.
- At projected returns (-3.0% appreciation + 8.0% rent growth), your $31k cash investment doubles in ~6 years — after that, you're playing with house money.
Negotiation context
- Only 6 days on market — expect competitive offers; lowballing is unlikely to land.
- 8 sale attempts since 20y ago with the ask held roughly flat each time — persistent listings suggest the price (not the market) is what's stuck; bring a comps-based counter.
- Current owner paid $29k; list at $110k implies a 279% gain — meaningful room to come down on a strong offer.
Risks & watch-outs
- Climate carrying-cost: extreme-heat days projected 7→17/yr by 2055 (HVAC capex compounding) — expect insurance premiums to compound above CPI over the hold.
Questions for the listing agent
- Built in 1970 — when were the roof, HVAC, electrical panel, plumbing, and water heater last replaced?
- Is there a deadline driving the sale (1031 exchange, divorce, estate, relocation)? That informs how much negotiation room exists.
- Schools are F-rated, which usually means shorter tenancies and higher turnover. Who's the typical renter profile here, and what's been the actual vacancy rate?
- What's the average days-on-market for RENTAL listings here right now (not sales)? A rising rental-DOM trend means longer vacancies and softer asking-rent achievability than the comps imply.
- What's the recent tenant-quality profile in this submarket — average credit score on applications, eviction rate, late-payment / NSF rate, and stable-employment percentage? A property-management company in the area should have these aggregated.
- How much new for-sale + rental construction is in the pipeline within 1–3 miles? Heavy new supply typically softens prices + rents 12–24 months out; constrained supply supports both.
Investment metrics
- 1% rule
- 1.35% ✓
- Cap rate
- 11.49%
- Cash-on-cash
- 18.57%
- DSCR
- 1.83
- GRM
- 6.2
CMA / ARV
- ARV (on-the-fly)
- $252,252
- Comps found
- 2
Show comp detail 2 sales within ~0.75 mi
| Address | Dist | Beds/Ba | Sqft | Sold | Price | $/sf | Match |
|---|---|---|---|---|---|---|---|
| 89 Cindys Way | 0.50mi | 2/1.5 | 624 (+9%) | 12mo | $275,000 | $441 | 50 |
| 1493 Western Ln | 0.54mi | 2/1.0 | 650 (+14%) | 15mo | $260,000 | $400 | 40 |
Match score weights: distance 35% · size 25% · config 20% · recency 20%. Top-matched comps best support the ARV.
Projected returns pro-forma
-3.0% appreciation · 8.0% rent growth · sell at horizon
- IRR
- 15.6%
- Equity multiple
- 1.66×
- Total profit
- $20,342
- Equity at exit
- $16,386
- IRR
- 27.5%
- Equity multiple
- 4.00×
- Total profit
- $92,374
- Equity at exit
- $9,502
Cash invested: $30,772 (down + closing). Projections, not guarantees.
Landlord ↔ Tenant lean methodology
- Overall (STATE)
- 55 Moderately Landlord-Leaning
- State Virginia
- 55 Moderately Landlord-Leaning · D+2
- County
- — inherits STATE
- City
- — inherits STATE
ZIP-level market 22630
- Home prices YoY
- -27.1%
- Rents YoY
- 8.3%
- Active inventory
- 280
- Price-to-rent
- 6.2×
Monthly cashflow live
- Estimated rent
- $1,483 medium interval (Pro) →
- Mortgage (P&I)
- −$576
- Tax from tax record
- −$73 /mo · $881/yr
- Insurance
- −$46
- HOA
- −$0
- Vacancy / Maint / Mgmt
- −$311
- Net cashflow
- $476
Break-even live
UW: 25.0% down · 7.5% · 30yr · 1.5% tax · 5.0% vac · 8.0% maint · 8.0% mgmt
Financing live
Cash to close
- Down payment
- $27,475
- Closing costs
- $3,297
- Reserves months
- —
- Total cash needed
- —
Loan-product check · same deal, 3 products live
Conventional
25% down · 7.5% · 30yr
- Down + closing
- —
- Monthly P&I
- —
- Monthly cashflow
- —
- DSCR
- —
- Eligible?
- —
Personal DTI + credit; lowest rate.
DSCR
20% down · 8.5% · 30yr
- Down + closing
- —
- Monthly P&I
- —
- Monthly cashflow
- —
- DSCR
- —
- Eligible?
- —
No personal income docs; deal must DSCR.
Hard money
10% down · 12.0% · 12mo
- Down + closing
- —
- Monthly P&I
- —
- Monthly cashflow
- —
- DSCR
- —
- Eligible?
- —
Short-term bridge; refi at stabilization.
Listing history 6 events
-
2026-06-18days on market $109,900 Active 6 DOM
-
2026-06-17days on market $109,900 Active 5 DOM
-
2026-06-16days on market $109,900 Active 4 DOM
-
2026-06-15days on market $109,900 Active 3 DOM
-
2026-06-13remarks 208-char remark
-
2026-06-13$109,900 Active 1 DOM
ⓘ Source: listings_history table (triggers on properties + properties_extension) + one-shot
backfill from property_details.listing_events for pre-trigger history.
Tax reassessment forecast VA · Resets to sale price
- Current annual tax
- $881 · $73/mo
- Projected year-2 tax
- $901 · $75/mo
- Expected delta
- +$20/yr (+$2/mo · 2.3%)
ⓘ Screening estimate from a state-policy table — verify with the county assessor before closing.
Climate risk First Street
- Flood 1/10 Low FEMA zone X (unshaded) · 0% chance over 30 yrs
- Wildfire 4/10 Moderate
- Heat 5/10 Major 7 d/yr ≥98°F today · 17 d/yr by 30 yrs out
- Wind 2/10 Low 2% chance of damaging wind over 30 yrs
- Air quality 2/10 Low 0 unhealthy d/yr today · 1 by 30 yrs out
Nearby sold comps map
Loading sold comps map…
Walkable amenities ~0.75 mi
Loading nearby amenities…
Taxation est. · year 1
- Rental income
- $17,798
- − Mortgage interest
- −$6,156
- − Property taxes
- −$881
- − Insurance
- −$550
- − Repairs & maintenance
- −$1,424
- − Management
- −$1,424
- − Depreciation
- −$3,197
- Taxable income
- $4,167
- Est. tax owed @ 24.0%
- −$1,000
- After-tax cash flow
- $4,714/yr
For passive investors: Depreciation is non-cash, so a rental often shows a tax loss while cash-flowing — sheltering income. Rental losses are passive: they offset passive income freely, and up to $25,000/yr can offset ordinary (W-2) income if you actively participate and your MAGI is under $100k (phasing out to $0 by $150k); unused losses carry forward. On sale, claimed depreciation is recaptured at up to 25%, and gains may owe capital-gains tax (a 1031 exchange can defer both). Figures are a year-1 estimate at your 24.0% rate — not tax advice; consult a CPA.
Schools (NCES district)
- District
- Warren County Public School District
- NCES district ID
- 5103870
- Math proficiency
- 49% ▼ -29.00%
- Reading proficiency
- 64% ▼ -10.00%
- Median HH income
- $61,504
- Composite
- 49.22/100
- National rank
- #2039
- State rank
- #70 of 131 in VA
Livability — Shenandoah Farms
- Score
- 60/100
- State rank
- #440
- US rank
- #18845
Category grades
Schools grade is shown separately in the Schools card above.
Census & demographics
- Census place
- Shenandoah Farms, VA
- County
- Warren County · 35,615 people
- Metro
- Washington-Arlington-Alexandria, DC-VA-MD-WV
- Population (ZIP)
- 35,615
- Household income
- $84,631
- Rent vs Own
- Severe rent burden
- 460.0
Population outlook (Warren County) Hauer SSP2
- Today (2025)
- 42,045 people
- By 2030
- 43,257 · +2.9%
- By 2040
- 45,088 · +7.2%
- By 2050
- 45,567 · +8.4%
- By 2075
- 46,081 · +9.6%
- By 2100
- 42,093 · +0.1%
Race, ethnicity, and origin ACS 2023
- Neighborhood character
- Predominantly White (81%)
- Race & ethnicity
- White 81% Hispanic / Latino 7% Black 6% Two or more races 5% Asian 2%
- Hispanic origin (detail)
- Mexican 1%
- Common ancestry
- Slovak 3% Lithuanian 2% Romanian 2%
- Foreign-born
- 6% · Canada
- Languages at home
- 92% English-only · Spanish 5% Other Indo-European 1%
Political lean MEDSL · Warren
- 2024 margin
- Solid R (+37.6) · D 30.6% · R 68.3% · Other 1.1%
- 2008→2024 swing
- -26.0pp toward R · 2008: -11.7pp · 2024: -37.6pp
- All cycles
- 2024: R+37.6 2020: R+35.3 2016: R+37.1 2012: R+20.5 2008: R+11.7
Not yet ingested
- Civics
- —
Market trends
- HPI YoY
- ▼ -118.82%
- Current HPI
- 319.8136
- Rent YoY
- ▲ 8.30%
- Metro
- Washington-Arlington-Alexandria, DC-VA-MD-WV
- State GDP YoY
- ▲ 2.40%
- F500 in state
- 50
Industry mix (Fortune 500 HQ in VA)
| Industry | F500 HQs | Revenue |
|---|---|---|
| Aerospace / Defense | 4 | $236B |
|
||
| Technology / Defense | 3 | $32B |
|
||
| Financial Services | 2 | $176B |
|
||
| Utilities | 2 | $27B |
|
||
| Insurance | 2 | $25B |
|
||
| Technology | 2 | $15B |
|
||
Price history
-21.4% since first listed27 events — show timeline
- 2026-06-12 Listed $109,900 BRIGHT MLS
- 2012-08-31 Sold (MLS) $29,000 MRIS
- 2012-08-31 Sold (MLS) $29,000 BRIGHT MLS
- 2012-08-22 Pending — MRIS
- 2012-08-22 Listing Removed — BRIGHT MLS
- 2012-08-17 Relisted — MRIS
- 2012-08-17 Price Changed $29,900 MRIS
- 2012-07-07 Pending — MRIS
- 2012-06-18 Price Changed $34,900 MRIS
- 2012-06-07 Price Changed $39,900 MRIS
- 2012-05-23 Price Changed $44,900 MRIS
- 2012-05-10 Price Changed $54,900 MRIS
- 2012-04-25 Price Changed $59,900 MRIS
- 2012-04-10 Price Changed $64,900 MRIS
- 2012-03-24 Listed $69,900 MRIS
- 2012-03-23 Listed $29,900 BRIGHT MLS
- 2010-06-01 Delisted — MRIS
- 2010-06-01 Listing Removed — BRIGHT MLS
- 2009-12-15 Price Changed — MRIS
- 2009-12-09 Listed — MRIS
- 2009-12-09 Listed $45,000 BRIGHT MLS
- 2006-10-07 Delisted — MRIS
- 2006-06-07 Listed — MRIS
- 2006-05-19 Sold (Public Records) $134,000 Public Records
- 2006-05-17 Sold (MLS) $139,900 MRIS
- 2006-04-13 Delisted — MRIS
- 2006-02-21 Listed $139,900 MRIS
Property tax history
+3.8%/yrLatest (2026): $881 · +18.8% YoY. Source: county tax records.
Cash-flow waterfall
monthlySold comps — $/sqft
last 12 mo · ≤1 miLoading sold comps…