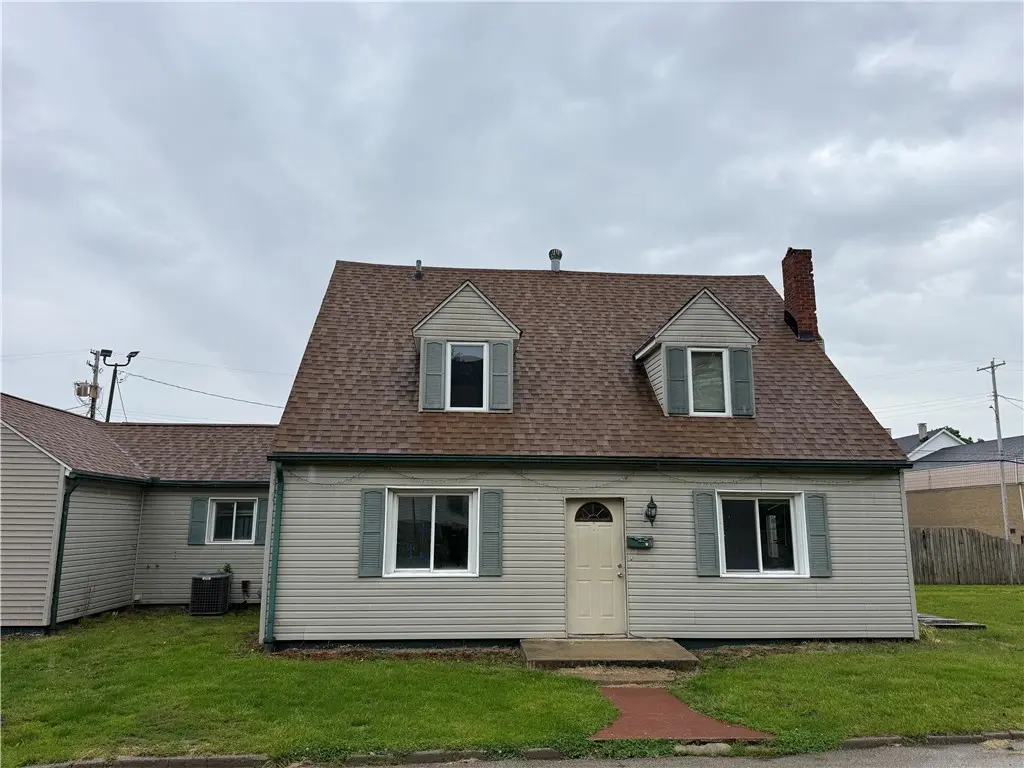
208 Ten Broeck St · Paris, IL
Flood risk 6/10 · Moderate
- FEMA flood zone
- X (unshaded)
- Chance of flooding over 30 yrs
- 0.67%
- Est. flood insurance / yr
- $473 – $860
Fire risk 1/10 · Minimal
- Est. fire insurance / yr
- $804 – $1,492
Heat risk 4/10 · Minor
- Hot days now (above 105°F)
- 7 days/yr
- Hot days in 30 yrs
- 20 days/yr
Wind risk 2/10 · Minimal
- Chance of severe wind over 30 yrs
- 1.0%
Air-quality risk 4/10 · Minor
- Unhealthy air days now
- 3 days/yr
- Unhealthy air days in 30 yrs
- 5 days/yr
Risk factors via First Street. Map © Google.
Why this score? — see what drove the B- grade
The composite is a weighted blend of 9 inputs, each scored 0–100. Each bar is that input's sub-score; the figure is the points it added to the 100-point composite (weight × sub-score).
- Cash flow +30.0/30.0
- 1% rule +10.0/10.0
- DSCR +10.0/10.0
- ARV discount +7.5/15.0
- Livability +3.6/5.0
- Schools +2.8/10.0
- Rent growth +2.5/5.0
- Condition / age +2.5/5.0
- Appreciation +0.0/10.0
$43,000
🖨 Deal sheet 📄 Offer letter ✓ Due diligence
Listing remarks
Spacious 4 bedroom, 2 full bathroom home offering tons of potential for the right buyer! This property is priced to sell and would make a great opportunity for an investor, flipper, or buyer looking to build equity with some updates and repairs. Features include a cozy gas fireplace in the living room, mostly replacement windows throughout, and a partial fenced backyard perfect for pets, kids, or entertaining. With solid space and great potential, this fixer-upper could truly shine again with some vision and work. Don’t miss your chance at an affordable home with plenty of upside in a great Paris location! Call Today for a Private Showing!!
Key facts
- Great location
- Gas fireplace
- Fenced backyard
Tags
Property features AI
Exterior
- Security: Closed-circuit camera system
- Utilities: Public water; Public sewer
- Home design: Single-family residence; One and one half levels; 1 total story; Vinyl siding
- Construction: Shingle roof
- Exterior features: Gravel road access
Interior
- Kitchen: Gas water heater; Other appliances
- Bathrooms: 2 full bathrooms
- Heating & cooling: Natural gas heating with forced air; Central air conditioning
- Interior features: Gas fireplace (1) with gas starter; Crawl space basement
- Laundry & utility: Laundry on main level
Neighborhood map
What this means for you Summary
Snapshot
- This is a 4-bed/2.0-bath single-family listed at $43k.
Deal economics
- At list price, monthly cash flow is $656 ($8k/yr) — positive.
- The deal already cash-flows at list — no discount required.
- Meets the 1% rule at list price ($1k rent vs $43k).
- Recommended offer: $42k (3.0% below list) — sets the bar for market timing.
- Cap rate 24.6% vs local median 8.3% in Paris — top-decile yield for the area; either an underpriced asset or a hidden risk that comps aren't pricing in. Stress-test before assuming the spread holds.
Location & tenants
- Location reads 71/100 on livability (#342 in IL) — a middle-class / working-renter tenant base. Strengths: cost of living A+, housing A+, health & safety A+; Watch: employment D, crime F, amenities F.
- Paris-Union SD 95 (town): math 25% / reading 42% proficiency, ranked #227 of 620 in IL (top 37%) — families likely to look elsewhere, expect single-tenant / working-renter base with shorter leases.
- Market conditions: 82 active listings in the ZIP; 6 units permitted in Edgar County in 2024 (0 in 5+ unit buildings).
Forward outlook
- Local home prices are declining (-3.0%/yr); year-one equity from $297 of loan paydown is wiped out by about $1k of value loss. Plan a longer hold.
- Edgar County population projected at -30% by 2050 — secular population decline; favor cash flow + early exit over multi-decade hold.
- At projected returns (-3.0% appreciation + 3.0% rent growth), your $12k cash investment doubles in ~2 years — after that, you're playing with house money.
Negotiation context
- It's been on market 38 days — a 3% lower offer ($42k) is reasonable based on typical stale-listing flexibility.
Risks & watch-outs
- Watch-outs: property tax is 3.6% of price; built in 1937 — expect roof / HVAC / electrical / plumbing capex.
- Climate carrying-cost: major flood risk — expect insurance premiums to compound above CPI over the hold.
Questions for the listing agent
- It's been on market 38 days. Have you received any prior offers? Is the seller open to a 3% concession, seller financing, or rate buy-down credit?
- Built in 1937 — when were the roof, HVAC, electrical panel, plumbing, and water heater last replaced?
- Property tax is high relative to price — has the assessment been appealed recently, and will the sale trigger a re-assessment?
- Is there a deadline driving the sale (1031 exchange, divorce, estate, relocation)? That informs how much negotiation room exists.
- Crime grade is F in this area — have there been break-ins, vandalism, or insurance claims at this property in the last 3 years? What carrier currently insures it and at what premium?
- What's the average days-on-market for RENTAL listings here right now (not sales)? A rising rental-DOM trend means longer vacancies and softer asking-rent achievability than the comps imply.
- What's the recent tenant-quality profile in this submarket — average credit score on applications, eviction rate, late-payment / NSF rate, and stable-employment percentage? A property-management company in the area should have these aggregated.
- How much new for-sale + rental construction is in the pipeline within 1–3 miles? Heavy new supply typically softens prices + rents 12–24 months out; constrained supply supports both.
Investment metrics
- 1% rule
- 3.03% ✓
- Cap rate
- 24.60%
- Cash-on-cash
- 65.38%
- DSCR
- 3.91
- GRM
- 2.7
CMA / ARV
- ARV (median comp)
- $91,141
- List price
- $43,000
- Delta
- -52.82%
- Verdict
- UNDERPRICED
- Comps
- 20 within 1.0 mi
Show comp detail 12 sales within ~0.75 mi
| Address | Dist | Beds/Ba | Sqft | Sold | Price | $/sf | Match |
|---|---|---|---|---|---|---|---|
| 410 Ten Broeck St | 0.15mi | 4/2.0 | 2,285 (+3%) | 4mo | $55,000 | $24 | 84 |
| 525 Prairie St | 0.58mi | 4/2.0 | 2,244 (+1%) | 0mo | $125,000 | $56 | 71 |
| 226 E Madison St | 0.36mi | 4/1.5 | 2,160 (-2%) | 12mo | $134,000 | $62 | 67 |
| 312 Sutherland Ave | 0.40mi | 3/2.0 (-1) | 2,170 (-2%) | 9mo | $45,000 | $21 | 66 |
| 221 W Elizabeth St | 0.16mi | 4/1.5 | 1,897 (-14%) | 12mo | $74,900 | $39 | 57 |
| 501 S Main St | 0.21mi | 4/2.0 | 2,529 (+14%) | 14mo | $49,000 | $19 | 55 |
| 420 E Crawford St | 0.51mi | 3/2.5 (-1) | 2,341 (+6%) | 7mo | $130,000 | $56 | 54 |
| 230 E Madison St | 0.38mi | 3/2.0 (-1) | 1,956 (-12%) | 11mo | $50,000 | $26 | 49 |
| 318 Chestnut St | 0.32mi | 3/1.5 (-1) | 1,947 (-12%) | 14mo | $42,000 | $22 | 46 |
| 512 E Court St | 0.61mi | 3/2.5 (-1) | 1,988 (-10%) | 3mo | $213,500 | $107 | 45 |
| 519 E Wood St | 0.68mi | 3/2.5 (-1) | 2,360 (+7%) | 10mo | $259,000 | $110 | 42 |
| 414 E Wood St | 0.52mi | 3/1.0 (-1) | 1,978 (-11%) | 14mo | $103,000 | $52 | 38 |
Match score weights: distance 35% · size 25% · config 20% · recency 20%. Top-matched comps best support the ARV.
Projected returns pro-forma
-3.0% appreciation · 3.0% rent growth · sell at horizon
- IRR
- 64.6%
- Equity multiple
- 3.90×
- Total profit
- $34,876
- Equity at exit
- $6,411
- IRR
- 69.0%
- Equity multiple
- 8.01×
- Total profit
- $84,436
- Equity at exit
- $3,718
Cash invested: $12,040 (down + closing). Projections, not guarantees.
Landlord ↔ Tenant lean methodology
- Overall (STATE)
- 43 Moderately Tenant-Leaning
- State Illinois
- 43 Moderately Tenant-Leaning · D+7
- County
- — inherits STATE
- City
- — inherits STATE
ZIP-level market 61944
- Active inventory
- 82
- Price-to-rent
- 2.7×
Monthly cashflow live
- Estimated rent
- $1,304 medium interval (Pro) →
- Mortgage (P&I)
- −$225
- Tax from tax record
- −$131 /mo · $1,567/yr
- Insurance
- −$18
- HOA
- −$0
- Vacancy / Maint / Mgmt
- −$274
- Net cashflow
- $656
Break-even live
UW: 25.0% down · 7.5% · 30yr · 1.5% tax · 5.0% vac · 8.0% maint · 8.0% mgmt
Financing live
Cash to close
- Down payment
- $10,750
- Closing costs
- $1,290
- Reserves months
- —
- Total cash needed
- —
Loan-product check · same deal, 3 products live
Conventional
25% down · 7.5% · 30yr
- Down + closing
- —
- Monthly P&I
- —
- Monthly cashflow
- —
- DSCR
- —
- Eligible?
- —
Personal DTI + credit; lowest rate.
DSCR
20% down · 8.5% · 30yr
- Down + closing
- —
- Monthly P&I
- —
- Monthly cashflow
- —
- DSCR
- —
- Eligible?
- —
No personal income docs; deal must DSCR.
Hard money
10% down · 12.0% · 12mo
- Down + closing
- —
- Monthly P&I
- —
- Monthly cashflow
- —
- DSCR
- —
- Eligible?
- —
Short-term bridge; refi at stabilization.
Listing history 18 events
-
2026-06-18days on market $43,000 Active 38 DOM
-
2026-06-17days on market $43,000 Active 37 DOM
-
2026-06-16days on market $43,000 Active 36 DOM
-
2026-06-15days on market $43,000 Active 35 DOM
-
2026-06-13days on market $43,000 Active 33 DOM
-
2026-06-12days on market $43,000 Active 32 DOM
-
2026-06-09days on market $43,000 Active 29 DOM
-
2026-06-08days on market $43,000 Active 28 DOM
-
2026-06-07days on market $43,000 Active 27 DOM
-
2026-06-07days on market $43,000 Active 26 DOM
-
2026-06-04days on market $43,000 Active 23 DOM
-
2026-06-02days on market $43,000 Active 22 DOM
-
2026-06-01days on market $43,000 Active 21 DOM
-
2026-05-31days on market $43,000 Active 20 DOM
-
2026-05-31days on market $43,000 Active 19 DOM
-
2026-05-09$43,000 Active 654-char remark
-
2012-08-07soldstatus $70,000
-
2006-03-07soldstatus $50,000
ⓘ Source: listings_history table (triggers on properties + properties_extension) + one-shot
backfill from property_details.listing_events for pre-trigger history.
Tax reassessment forecast IL · Partial reset (capped growth)
- Current annual tax
- $1,567 · $131/mo
- Projected year-2 tax
- $1,567 · $131/mo
- Expected delta
- $0/yr ($0/mo · 0.0%)
ⓘ Screening estimate from a state-policy table — verify with the county assessor before closing.
Climate risk First Street
- Flood 6/10 Major FEMA zone X (unshaded) · 67% chance over 30 yrs
- Wildfire 1/10 Low
- Heat 4/10 Moderate 7 d/yr ≥105°F today · 20 d/yr by 30 yrs out
- Wind 2/10 Low 100% chance of damaging wind over 30 yrs
- Air quality 4/10 Moderate 3 unhealthy d/yr today · 5 by 30 yrs out
Nearby sold comps map
Loading sold comps map…
Walkable amenities ~0.75 mi
Loading nearby amenities…
Taxation est. · year 1
- Rental income
- $15,645
- − Mortgage interest
- −$2,409
- − Property taxes
- −$1,567
- − Insurance
- −$215
- − Repairs & maintenance
- −$1,252
- − Management
- −$1,252
- − Depreciation
- −$1,251
- Taxable income
- $7,700
- Est. tax owed @ 24.0%
- −$1,848
- After-tax cash flow
- $6,023/yr
For passive investors: Depreciation is non-cash, so a rental often shows a tax loss while cash-flowing — sheltering income. Rental losses are passive: they offset passive income freely, and up to $25,000/yr can offset ordinary (W-2) income if you actively participate and your MAGI is under $100k (phasing out to $0 by $150k); unused losses carry forward. On sale, claimed depreciation is recaptured at up to 25%, and gains may owe capital-gains tax (a 1031 exchange can defer both). Figures are a year-1 estimate at your 24.0% rate — not tax advice; consult a CPA.
Schools (NCES district)
- District
- Paris-Union SD 95
- NCES district ID
- 1730750
- Math proficiency
- 25% ▼ -4.00%
- Reading proficiency
- 42% ▼ -7.00%
- Median HH income
- $36,294
- Composite
- 27.73/100
- National rank
- #6901
- State rank
- #227 of 620 in IL
Livability — Paris
- Score
- 71/100
- State rank
- #342
- US rank
- #6933
Category grades
Schools grade is shown separately in the Schools card above.
Census & demographics
- Census place
- Paris, IL
- City population
- 11,426
- Population (ZIP)
- 11,426
Population outlook (Edgar County) Hauer SSP2
- Today (2025)
- 15,960 people
- By 2030
- 14,978 · -6.2%
- By 2040
- 12,990 · -18.6%
- By 2050
- 11,087 · -30.5%
- By 2075
- 7,338 · -54.0%
- By 2100
- 4,526 · -71.6%
Race, ethnicity, and origin ACS 2023
- Neighborhood character
- Predominantly White (96%)
- Race & ethnicity
- White 96% Two or more races 3% Hispanic / Latino 1%
- Common ancestry
- Slovak 2% Serbian 2% Italian 1%
- Foreign-born
- 1%
- Languages at home
- 98% English-only · Spanish 1% Other Indo-European 1%
Political lean MEDSL · Edgar
- 2024 margin
- Solid R (+52.4) · D 23.0% · R 75.3% · Other 1.7%
- 2008→2024 swing
- -44.4pp toward R · 2008: -7.9pp · 2024: -52.4pp
- All cycles
- 2024: R+52.4 2020: R+52.5 2016: R+49.5 2012: R+32.8 2008: R+7.9
Not yet ingested
- Civics
- —
Market trends
- HPI YoY
- ▼ -66.48%
- Current HPI
- 108.1718
- Rent YoY
- —
- Metro
- —
- State GDP YoY
- ▲ 1.59%
- F500 in state
- 60
Industry mix (Fortune 500 HQ in IL)
| Industry | F500 HQs | Revenue |
|---|---|---|
| Insurance | 4 | $201B |
|
||
| Consumer Goods | 4 | $87B |
|
||
| Industrial Machinery | 3 | $64B |
|
||
| Healthcare | 2 | $55B |
|
||
| Retail / Pharmacy | 1 | $148B |
|
||
| Agriculture / Food | 1 | $86B |
|
||
Price history
-14.0% since first listed3 events — show timeline
- 2026-05-09 Listed $43,000 CIBR
- 2012-08-07 Sold (Public Records) $70,000 Public Records
- 2006-03-07 Sold (Public Records) $50,000 Public Records
Property tax history
+1.0%/yrLatest (2024): $1,567 · +6.4% YoY. Source: county tax records.
Cash-flow waterfall
monthlySold comps — $/sqft
last 12 mo · ≤1 miLoading sold comps…