529 Old Western Pass · Sonterra, TX
Flood risk No data
- FEMA flood zone
- —
- Chance of flooding over 30 yrs
- —
- Est. flood insurance / yr
- —
Fire risk No data
- Est. fire insurance / yr
- —
Heat risk No data
- Hot days now (above threshold)
- —
- Hot days in 30 yrs
- —
Wind risk No data
- Chance of severe wind over 30 yrs
- —
Air-quality risk No data
- Unhealthy air days now
- —
- Unhealthy air days in 30 yrs
- —
Risk factors via First Street. Map © Google.
Why this score? — see what drove the D+ grade
The composite is a weighted blend of 9 inputs, each scored 0–100. Each bar is that input's sub-score; the figure is the points it added to the 100-point composite (weight × sub-score).
- ARV discount +15.0/15.0
- Cash flow +14.3/30.0
- DSCR +4.3/10.0
- 1% rule +4.0/10.0
- Livability +2.5/5.0
- Condition / age +2.5/5.0
- Rent growth +2.1/5.0
- Schools +2.1/10.0
- Appreciation +0.0/10.0
$220,542
🖨 Deal sheet (PDF) 📄 Offer letter ✓ Due diligence
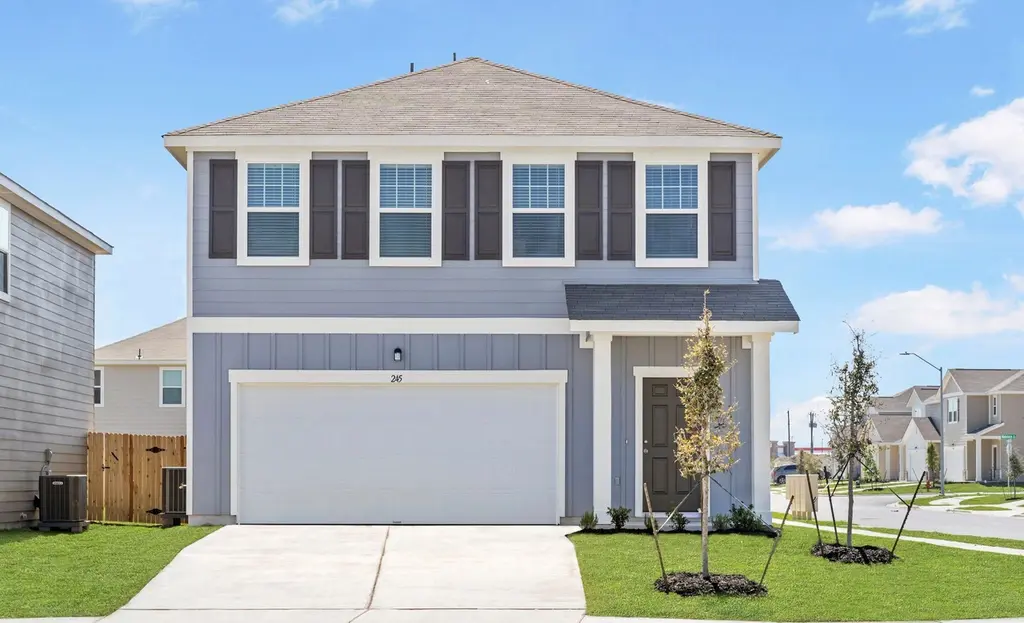
Listing remarks
Create memories when you step inside your new home that includes modern finishes from top to bottom. Cook family meals in your open kitchen complete with stainless steel appliances, granite countertops and a large island. This two-story home also provides plenty of space with extra loft space and a patio that's perfect for entertaining guests.
Key facts
- Extra loft space
- Large island
- Granite countertops
Tags
Property features AI
Finance
- Financial info: List price $250,190
Exterior
- Parking: 2 garage spaces; 2 total parking spaces
- Utilities: Electric heating and heat pump; Central air
- Home design: Spec new construction — Voyager plan; Single-family residence (address: 529 Old Western Pass, Jarrell TX)
- Construction: Living area approximately 1826; Built in 2026
Interior
- Bedrooms: 3 bedrooms
- Bathrooms: 2 full bathrooms; 1 half bathroom
- Heating & cooling: Electric heat and heat pump; Central air conditioning
- Interior features: Dishwasher; Disposal; Microwave
Neighborhood map
What this means for you Summary
Snapshot
- This is a 3-bed/2.5-bath single-family listed at $221k.
Deal economics
- At list price, monthly cash flow is $39 ($464/yr) — positive.
- The deal already cash-flows at list — no discount required.
- To meet the 1% rule (rent ≥ 1% of price), the offer needs to be $198k (10.3% below list).
- Recommended offer: $198k (10.3% below list) — sets the bar for 1% rule.
- Cap rate 6.5% vs local median 4.5% in Sonterra — top-decile yield for the area; either an underpriced asset or a hidden risk that comps aren't pricing in. Stress-test before assuming the spread holds.
Location & tenants
- Location reads: area grade D — affects rentability + tenant quality, not the cash-flow math above.
- Jarrell ISD (rural): math 19% / reading 28% proficiency, ranked #713 of 826 in TX (top 86%) — low school quality limits family demand, transient renter base, plan for 1-2y turnover.
- Zoned schools: Jarrell El (math 19% / reading 27%, grade F, #3,277 of 4,322 statewide, top 77%, 785 students, 62% FRL); Jarrell Middle (math 21% / reading 29%, grade F, #1,258 of 1,662 statewide, top 77%, 741 students, 64% FRL); Jarrell H S (math 22% / reading 37%, grade F, #1,112 of 1,632 statewide, top 70%, 868 students, 58% FRL).
- Market conditions: Rents soft (-1.7%/yr); 773 active listings in the ZIP; 22 comparable units currently listed for rent nearby; rentals leasing fast (median 6d on market — plan ~1-2 weeks tenant-placement turnaround); solid renter incomes; 7,543 units permitted in Williamson County in 2024 (1,425 in 5+ unit buildings).
Forward outlook
- Local home prices are declining (-3.0%/yr); year-one equity from $2k of loan paydown is wiped out by about $7k of value loss. Plan a longer hold.
- Williamson County population projected at +69% by 2050 — long-run rental-demand tailwind backs the buy-and-hold thesis.
Negotiation context
- It's been on market 15 days — a 2% lower offer ($217k) is reasonable based on typical stale-listing flexibility.
Questions for the listing agent
- Is there a deadline driving the sale (1031 exchange, divorce, estate, relocation)? That informs how much negotiation room exists.
- The area grade is low — what's the realistic commute time and amenity access for the typical tenant pool here? Any planned neighborhood developments (good or bad) we should know about?
- What's the average days-on-market for RENTAL listings here right now (not sales)? A rising rental-DOM trend means longer vacancies and softer asking-rent achievability than the comps imply.
- What's the recent tenant-quality profile in this submarket — average credit score on applications, eviction rate, late-payment / NSF rate, and stable-employment percentage? A property-management company in the area should have these aggregated.
- How much new for-sale + rental construction is in the pipeline within 1–3 miles? Heavy new supply typically softens prices + rents 12–24 months out; constrained supply supports both.
Investment metrics
- 1% rule
- 0.90% ✗
- Cap rate
- 6.50%
- Cash-on-cash
- 0.75%
- DSCR
- 1.03
- GRM
- 9.3
CMA / ARV
- ARV (on-the-fly)
- $272,074
- Comps found
- 12
Show comp detail 12 sales within ~0.75 mi
| Address | Dist | Beds/Ba | Sqft | Sold | Price | $/sf | Match |
|---|---|---|---|---|---|---|---|
| 133 Starpacker Ln | 0.11mi | 4/2.5 (+1) | 1,925 (+5%) | 2mo | $255,990 | $133 | 80 |
| 345 Brannigan Dr | 0.07mi | 4/2.5 (+1) | 1,979 (+8%) | 3mo | $249,990 | $126 | 76 |
| 349 Brannigan Dr | 0.07mi | 4/2.0 (+1) | 1,607 (-12%) | 3mo | $232,990 | $145 | 67 |
| 344 Brannigan Dr | 0.09mi | 4/2.0 (+1) | 1,607 (-12%) | 2mo | $229,990 | $143 | 67 |
| 121 Starpacker Ln | 0.11mi | 4/2.0 (+1) | 1,607 (-12%) | 2mo | $232,999 | $145 | 67 |
| 356 Brannigan Dr | 0.11mi | 4/2.0 (+1) | 1,607 (-12%) | 2mo | $239,990 | $149 | 66 |
| 116 Starpacker Ln | 0.14mi | 4/2.0 (+1) | 1,607 (-12%) | 1mo | $246,999 | $154 | 66 |
| 105 Starpacker Ln | 0.11mi | 4/2.0 (+1) | 1,607 (-12%) | 3mo | $254,990 | $159 | 65 |
| 129 Morrison Dr | 0.37mi | 3/2.0 | 1,580 (-14%) | 2mo | $252,900 | $160 | 57 |
| 910 Yellow Ribbon Cv | 0.66mi | 4/3.0 (+1) | 1,888 (+3%) | 2mo | $279,276 | $148 | 54 |
| 145 Hatari Trl | 0.66mi | 4/2.5 (+1) | 1,945 (+6%) | 1mo | $307,990 | $158 | 52 |
| 109 Green Berets Bnd | 0.73mi | 3/2.5 | 1,625 (-11%) | 2mo | $271,990 | $167 | 46 |
Match score weights: distance 35% · size 25% · config 20% · recency 20%. Top-matched comps best support the ARV.
Projected returns pro-forma
-3.0% appreciation · 0.0% rent growth · sell at horizon
- IRR
- -18.5%
- Equity multiple
- 0.37×
- Total profit
- $-39,040
- Equity at exit
- $32,884
- IRR
- -18.4%
- Equity multiple
- 0.14×
- Total profit
- $-53,106
- Equity at exit
- $19,068
Cash invested: $61,752 (down + closing). Projections, not guarantees.
Landlord ↔ Tenant lean methodology
- Overall (STATE)
- 87 Strongly Landlord-Friendly
- State Texas
- 87 Strongly Landlord-Friendly · R+5
- County
- — inherits STATE
- City
- — inherits STATE
ZIP-level market 76537
- Home prices YoY
- -14.4%
- Rents YoY
- -1.7%
- Active inventory
- 773
- Price-to-rent
- 9.3×
Monthly cashflow live
- Estimated rent
- $1,978 high interval (Pro) →
- Mortgage (P&I)
- −$1,157
- Tax est. 1.5%
- −$276 /mo · $3,308/yr
- Insurance
- −$92
- HOA
- −$0
- Vacancy / Maint / Mgmt
- −$415
- Net cashflow
- $39
Break-even live
Sensitivity live
| Price | -10% $191 | -5% $115 | +0% $39 | +5% $-38 | +10% $-114 |
|---|---|---|---|---|---|
| Rent | -10% $-118 | -5% $-39 | +0% $39 | +5% $117 | +10% $195 |
| Rate | -1.0pp $150 | -0.5pp $95 | base $39 | +0.5pp $-18 | +1.0pp $-77 |
UW: 25.0% down · 7.5% · 30yr · 1.5% tax · 5.0% vac · 8.0% maint · 8.0% mgmt
Financing live
Cash to close
- Down payment
- $55,136
- Closing costs
- $6,616
- Reserves months
- —
- Total cash needed
- —
Loan-product check · same deal, 3 products live
Conventional
25% down · 7.5% · 30yr
- Down + closing
- —
- Monthly P&I
- —
- Monthly cashflow
- —
- DSCR
- —
- Eligible?
- —
Personal DTI + credit; lowest rate.
DSCR
20% down · 8.5% · 30yr
- Down + closing
- —
- Monthly P&I
- —
- Monthly cashflow
- —
- DSCR
- —
- Eligible?
- —
No personal income docs; deal must DSCR.
Hard money
10% down · 12.0% · 12mo
- Down + closing
- —
- Monthly P&I
- —
- Monthly cashflow
- —
- DSCR
- —
- Eligible?
- —
Short-term bridge; refi at stabilization.
Rent comps 22 comps
| Address | Beds | Baths | Sqft | Rent | $/sqft | DOM | Units | Dist |
|---|---|---|---|---|---|---|---|---|
| 360 Brannigan Dr Jarrell, TX | 3.0 | 2.0 | 1409 | $1,700 | $1.21 | 0d | 1 | 0.14mi |
| 201 Fighting Seabees Run Jarrell, TX | 4.0 | 2.0 | 1667 | $1,900 | $1.14 | 9d | 1 | 0.31mi |
| 316 McLintock Rd Jarrell, TX | 4.0 | 3.0 | 2560 | $2,095 | $0.82 | 45d | 1 | 0.33mi |
| 313 McLintock Rd Jarrell, TX | 4.0 | 2.0 | 1855 | $2,000 | $1.08 | 4d | 1 | 0.35mi |
| 221 Barbary Coast Ln Jarrell, TX | 3.0 | 2.0 | 1450 | $1,750 | $1.21 | 0d | 1 | 0.36mi |
| 120 Morrison Dr Jarrell, TX | 3.0 | 2.0 | 1580 | $2,210 | $1.40 | 18d | 1 | 0.36mi |
| 229 Barbary Coast Ln Jarrell, TX | 3.0 | 2.5 | 1935 | $1,800 | $0.93 | 0d | 1 | 0.37mi |
| 105 McLintock Rd Jarrell, TX | 3.0–5.0 | 2.0–3.5 | 1773 | $2,055 | $1.16 | 0d | 1 | 0.41mi |
| 121 Old Stagecoach Rd Jarrell, TX | 4.0 | 2.0 | 1531 | $1,800 | $1.18 | 45d | 1 | 0.43mi |
| 524 Barbary Coast Cv Jarrell, TX | 3.0 | 3.0 | 2552 | $2,295 | $0.90 | 0d | 1 | 0.47mi |
| 131 Wild Wind Cv Jarrell, TX | 4.0 | 3.0 | 2468 | $2,095 | $0.85 | 0d | 1 | 0.93mi |
| 131 Wild Wind Cv Jarrell, TX | 4.0 | 3.0 | 2399 | $2,095 | $0.87 | 6d | 1 | 0.93mi |
| 252 Wild Wind Trl Jarrell, TX | 3.0 | 2.0 | 1243 | $1,650 | $1.33 | 19d | 1 | 0.96mi |
| 154 Hammond Jarrell, TX | 3.0 | 2.0 | 1500 | $1,900 | $1.27 | 5d | 1 | 1.06mi |
| 112 Ragnar Jarrell, TX | 3.0 | 2.0 | 1251 | $1,495 | $1.20 | 21d | 1 | 1.09mi |
| 112 Ragnar Jarrell, TX | 3.0 | 2.0 | 1251 | $1,495 | $1.20 | 18d | 1 | 1.09mi |
| 504 Rusty DR Lot Rusty Jarrell, TX | 3.0 | 2.5 | 1900 | $1,870 | $0.98 | 0d | 1 | 1.15mi |
| 104 Hellfighters Way Jarrell, TX | 3.0 | 2.5 | 1619 | $2,000 | $1.24 | 45d | 1 | 1.23mi |
| 201 Katie Elder Dr Jarrell, TX | 3.0 | 2.5 | 2418 | $1,795 | $0.74 | 0d | 1 | 1.27mi |
| 449 Stone Water Ln Jarrell, TX | 3.0 | 2.5 | 1674 | $1,900 | $1.14 | 45d | 1 | 1.28mi |
| 241 Alcatraz Loop Jarrell, TX | 3.0 | 2.0 | 1288 | $1,895 | $1.47 | 19d | 1 | 1.48mi |
| 621 Xanadu Dr Jarrell, TX | 3.0 | 2.0 | 1586 | $1,750 | $1.10 | 6d | 1 | 1.50mi |
Listing history 10 events
-
2026-06-21days on market $220,542 Active 15 DOM
-
2026-06-18days on market $220,542 Active 12 DOM
-
2026-06-17days on market $220,542 Active 11 DOM
-
2026-06-16days on market $220,542 Active 10 DOM
-
2026-06-15days on market $220,542 Active 9 DOM
-
2026-06-13pricedays on market $220,542 Active 7 DOM
-
2026-06-09days on market $250,190 Active 3 DOM
-
2026-06-08days on market $250,190 Active 2 DOM
-
2026-06-07remarks 345-char remark
-
2026-06-07$250,190 Active 1 DOM
ⓘ Source: listings_history table (triggers on properties + properties_extension) + one-shot
backfill from property_details.listing_events for pre-trigger history.
Nearby sold comps map
Loading sold comps map…
Walkable amenities ~0.75 mi
Loading nearby amenities…
Taxation est. · year 1
- Rental income
- $23,739
- − Mortgage interest
- −$12,354
- − Property taxes
- −$3,308
- − Insurance
- −$1,103
- − Repairs & maintenance
- −$1,899
- − Management
- −$1,899
- − Depreciation
- −$6,416
- Taxable loss
- −$3,240
- Est. tax savings @ 24.0%
- +$778
- After-tax cash flow
- $1,242/yr
For passive investors: Depreciation is non-cash, so a rental often shows a tax loss while cash-flowing — sheltering income. Rental losses are passive: they offset passive income freely, and up to $25,000/yr can offset ordinary (W-2) income if you actively participate and your MAGI is under $100k (phasing out to $0 by $150k); unused losses carry forward. On sale, claimed depreciation is recaptured at up to 25%, and gains may owe capital-gains tax (a 1031 exchange can defer both). Figures are a year-1 estimate at your 24.0% rate — not tax advice; consult a CPA.
Schools (NCES district)
- District
- Jarrell ISD
- NCES district ID
- 4824600
- Math proficiency
- 19% ▼ -18.00%
- Reading proficiency
- 28% ▼ -5.00%
- Median HH income
- $57,132
- Composite
- 21.47/100
- National rank
- #8335
- State rank
- #713 of 826 in TX
Livability — Sonterra
No livability data for this city. (Only ~50 U.S. cities are tracked.)
Census & demographics
- County
- Williamson County · 680,029 people
- City population
- 12,526
- Metro
- Austin-Round Rock-Georgetown, TX
- Population (ZIP)
- 16,272
- Household income
- $98,199
- Rent vs Own
- Severe rent burden
- 225.0
Population outlook (Williamson County) Hauer SSP2
- Today (2025)
- 699,027 people
- By 2030
- 795,537 · +13.8%
- By 2040
- 990,683 · +41.7%
- By 2050
- 1,184,292 · +69.4%
- By 2075
- 1,623,825 · +132.3%
- By 2100
- 1,924,153 · +175.3%
Race, ethnicity, and origin ACS 2023
- Neighborhood character
- Diverse neighborhood (Simpson 0.63)
- Race & ethnicity
- White 48% Hispanic / Latino 36% Two or more races 14% Black 7% Asian 4%
- Hispanic origin (detail)
- Mexican 30% Puerto Rican 5%
- Common ancestry
- Romanian 3% Italian 2% Slovak 1%
- Foreign-born
- 13% · Canada, Vietnam
- Languages at home
- 69% English-only · Spanish 26% Chinese 2% French/Haitian/Cajun 1%
Political lean MEDSL · Williamson
- 2024 margin
- Toss-up / Even · D 48.0% · R 50.4% · Other 1.6%
- 2008→2024 swing
- +10.6pp toward D · 2008: -13.0pp · 2024: -2.5pp
- All cycles
- 2024: R+2.5 2020: D+1.4 2016: R+9.9 2012: R+21.5 2008: R+13.0
Not yet ingested
- Civics
- —
Market trends
- HPI YoY
- ▼ -31.03%
- Current HPI
- 184.8935
- Rent YoY
- ▼ -1.73%
- Metro
- Austin-Round Rock-Georgetown, TX
- State GDP YoY
- ▲ 3.95%
- F500 in state
- 110
Industry mix (Fortune 500 HQ in TX)
| Industry | F500 HQs | Revenue |
|---|---|---|
| Energy | 16 | $1,198B |
|
||
| Technology | 5 | $198B |
|
||
| Engineering / Construction | 4 | $72B |
|
||
| Energy Services | 3 | $60B |
|
||
| Utilities | 3 | $41B |
|
||
| Healthcare | 2 | $330B |
|
||
Cash-flow waterfall
monthlySold comps — $/sqft
last 12 mo · ≤1 miLoading sold comps…