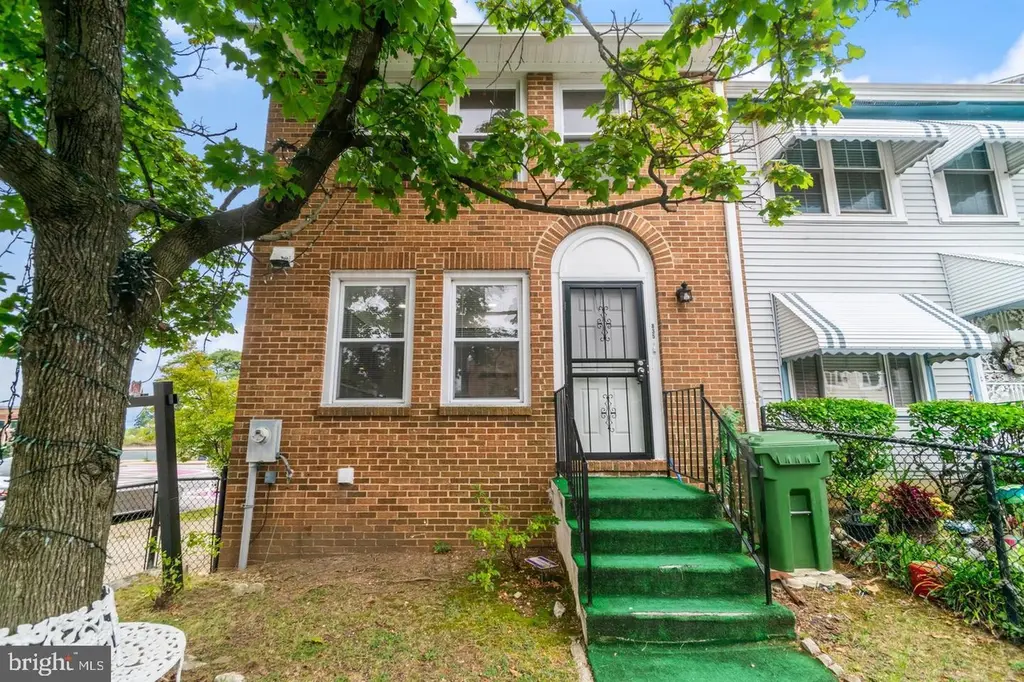
835 Showell Ct · Baltimore, MD
Flood risk 1/10 · Minimal
- FEMA flood zone
- X (unshaded)
- Chance of flooding over 30 yrs
- 0.0%
- Est. flood insurance / yr
- $473 – $860
Fire risk 1/10 · Minimal
- Est. fire insurance / yr
- $755 – $1,403
Heat risk 7/10 · Major
- Hot days now (above 103°F)
- 7 days/yr
- Hot days in 30 yrs
- 15 days/yr
Wind risk 6/10 · Moderate
- Chance of severe wind over 30 yrs
- 27.0%
Air-quality risk 4/10 · Minor
- Unhealthy air days now
- 6 days/yr
- Unhealthy air days in 30 yrs
- 7 days/yr
Risk factors via First Street. Map © Google.
Why this score? — see what drove the D+ grade
The composite is a weighted blend of 9 inputs, each scored 0–100. Each bar is that input's sub-score; the figure is the points it added to the 100-point composite (weight × sub-score).
- Cash flow +20.6/30.0
- ARV discount +7.5/15.0
- DSCR +6.6/10.0
- 1% rule +4.6/10.0
- Livability +3.8/5.0
- Rent growth +2.6/5.0
- Condition / age +2.5/5.0
- Schools +1.0/10.0
- Appreciation +0.0/10.0
$199,900
🖨 Deal sheet 📄 Offer letter ✓ Due diligence
Listing remarks
Located in the heart of Johnston Square's ongoing revitalization, this well-maintained 3-bedroom, 1.5-bath end-of-group townhome offers a rare opportunity to purchase in one of Baltimore's emerging neighborhoods. Features include an updated kitchen, renovated bathrooms, and a fenced rear yard. Conveniently situated near downtown Baltimore, major commuter routes, shopping, dining, and local attractions. With continued redevelopment and investment occurring throughout the area, this property presents strong potential for both homeowners and investors. Sold AS IS. Seller prefers Stewart Title for settlement.
Key facts
- Built 1984
- Listed 30 days
Property features AI
Finance
- Financial info: Lease not considered
Exterior
- Parking: On-street parking
- Utilities: Public water; Public sewer (also lists public septic)
- Home design: End of row townhouse; Fee simple ownership
- Construction: Concrete perimeter foundation; Above-grade structure noted
- Exterior features: Brick front
Interior
- Bedrooms: Three bedrooms on the first upper level
- Bathrooms: One full bathroom; One half bathroom
- Heating & cooling: Heat pump(s) heating; Central air conditioning; Electric heating and cooling fuel; Electric hot water
- Interior features: Estimated living area; Fully finished basement
Neighborhood map
What this means for you Summary
Snapshot
- This is a 3-bed/1.0-bath townhouse listed at $200k.
Deal economics
- At list price, monthly cash flow is $268 ($3k/yr) — positive.
- The deal already cash-flows at list — no discount required.
- To meet the 1% rule (rent ≥ 1% of price), the offer needs to be $191k (4.3% below list).
- Recommended offer: $191k (4.3% below list) — sets the bar for 1% rule.
- Cap rate 7.9% vs local median 6.0% in Baltimore — top-decile yield for the area; either an underpriced asset or a hidden risk that comps aren't pricing in. Stress-test before assuming the spread holds.
Location & tenants
- Location reads 76/100 on livability (#90 in MD, #3,396 nationally) — a middle-class / working-renter tenant base. Strengths: amenities A+, commute A+, housing A+; Watch: schools D, crime F.
- Baltimore City Public Schools (urban): math 7% / reading 16% proficiency, ranked #24 of 24 in MD (top 100%) — low school quality limits family demand, transient renter base, plan for 1-2y turnover; 79% free/reduced lunch — lower-income household profile, screen leases tightly.
- Market conditions: Rents flat; 134 active listings in the ZIP; 40 comparable units currently listed for rent nearby; rentals at typical pace (median 22d on market — plan ~3-4 weeks tenant-placement turnaround); 1,273 units permitted in Baltimore city in 2024 (1,104 in 5+ unit buildings).
- This rent runs 39% of the median local income ($59k/yr) — at the standard rent-burdened threshold; future hikes will face affordability resistance.
Forward outlook
- Local home prices are declining (-3.0%/yr); year-one equity from $1k of loan paydown is wiped out by about $6k of value loss. Plan a longer hold.
- Baltimore County population projected to shrink 4% by 2050 — rents likely to lag national; underwrite the cash flow, not the appreciation.
Negotiation context
- It's been on market 30 days — a 2% lower offer ($197k) is reasonable based on typical stale-listing flexibility.
- 3 sale attempts since 29y ago; this cycle's ask has dropped $55k (22%) from the opening price — seller is motivated, your offer sets the floor, not the list.
- Current owner paid $56k; list at $200k implies a 260% gain — meaningful room to come down on a strong offer.
Risks & watch-outs
- Climate carrying-cost: major wind risk, 27% chance of damaging wind over 30y; extreme-heat days projected 7→15/yr by 2055 (HVAC capex compounding) — expect insurance premiums to compound above CPI over the hold.
Questions for the listing agent
- Is there a deadline driving the sale (1031 exchange, divorce, estate, relocation)? That informs how much negotiation room exists.
- Schools are D-rated, which usually means shorter tenancies and higher turnover. Who's the typical renter profile here, and what's been the actual vacancy rate?
- Crime grade is F in this area — have there been break-ins, vandalism, or insurance claims at this property in the last 3 years? What carrier currently insures it and at what premium?
- The area grade is low — what's the realistic commute time and amenity access for the typical tenant pool here? Any planned neighborhood developments (good or bad) we should know about?
- What's the average days-on-market for RENTAL listings here right now (not sales)? A rising rental-DOM trend means longer vacancies and softer asking-rent achievability than the comps imply.
- What's the recent tenant-quality profile in this submarket — average credit score on applications, eviction rate, late-payment / NSF rate, and stable-employment percentage? A property-management company in the area should have these aggregated.
- How much new for-sale + rental construction is in the pipeline within 1–3 miles? Heavy new supply typically softens prices + rents 12–24 months out; constrained supply supports both.
Investment metrics
- 1% rule
- 0.96% ✗
- Cap rate
- 7.90%
- Cash-on-cash
- 5.74%
- DSCR
- 1.26
- GRM
- 8.7
CMA / ARV
- ARV (on-the-fly)
- $110,592
- Comps found
- 12
Show comp detail 12 sales within ~0.75 mi
| Address | Dist | Beds/Ba | Sqft | Sold | Price | $/sf | Match |
|---|---|---|---|---|---|---|---|
| 1104 Harford Ave | 0.14mi | 3/1.5 | 1,152 (0%) | 1mo | $100,000 | $87 | 90 |
| 1543 Holbrook St | 0.30mi | 3/2.0 | 1,200 (+4%) | 2mo | $110,000 | $92 | 73 |
| 1110 N Central Ave | 0.25mi | 3/2.0 | 1,260 (+9%) | 2mo | $135,000 | $107 | 67 |
| 1234 E Lafayette Ave E | 0.49mi | 3/2.5 | 1,225 (+6%) | 2mo | $219,000 | $179 | 59 |
| 1722 E Lanvale St | 0.73mi | 3/1.0 | 1,200 (+4%) | 0mo | $125,000 | $104 | 59 |
| 1205 Ashland Ave | 0.34mi | 3/1.0 | 992 (-14%) | 3mo | $95,000 | $96 | 58 |
| 1822 Aiken St | 0.54mi | 3/1.0 | 1,050 (-9%) | 3mo | $49,000 | $47 | 58 |
| 819 Aisquith St | 0.35mi | 3/1.0 | 991 (-14%) | 3mo | $93,500 | $94 | 58 |
| 1 E Chase St #303 | 0.57mi | 2/2.0 (-1) | 1,211 (+5%) | 2mo | $200,000 | $165 | 55 |
| 1619 E Federal St E | 0.58mi | 3/2.5 | 1,216 (+6%) | 4mo | $75,000 | $62 | 55 |
| 1753 E Preston St | 0.66mi | 2/2.0 (-1) | 1,200 (+4%) | 3mo | $225,000 | $188 | 51 |
| 1423 E Lanvale St | 0.48mi | 4/2.0 (+1) | 1,000 (-13%) | 3mo | $77,750 | $78 | 44 |
Match score weights: distance 35% · size 25% · config 20% · recency 20%. Top-matched comps best support the ARV.
Projected returns pro-forma
-3.0% appreciation · 0.59% rent growth · sell at horizon
- IRR
- -10.0%
- Equity multiple
- 0.64×
- Total profit
- $-19,913
- Equity at exit
- $29,806
- IRR
- -4.0%
- Equity multiple
- 0.76×
- Total profit
- $-13,310
- Equity at exit
- $17,284
Cash invested: $55,972 (down + closing). Projections, not guarantees.
Landlord ↔ Tenant lean methodology
- Overall (CITY)
- 12 Strongly Tenant-Friendly
- State Maryland
- 27 Tenant-Leaning · D+14
- County
- — inherits STATE
- City Baltimore
- 12 Strongly Tenant-Friendly · D+58
ZIP-level market 21202
- Home prices YoY
- -8.0%
- Rents YoY
- 0.6%
- Active inventory
- 134
- Price-to-rent
- 8.7×
Monthly cashflow live
- Estimated rent
- $1,914 high interval (Pro) →
- Mortgage (P&I)
- −$1,048
- Tax from tax record
- −$112 /mo · $1,349/yr
- Insurance
- −$83
- HOA
- −$0
- Vacancy / Maint / Mgmt
- −$402
- Net cashflow
- $268
Break-even live
UW: 25.0% down · 7.5% · 30yr · 1.5% tax · 5.0% vac · 8.0% maint · 8.0% mgmt
Financing live
Cash to close
- Down payment
- $49,975
- Closing costs
- $5,997
- Reserves months
- —
- Total cash needed
- —
Loan-product check · same deal, 3 products live
Conventional
25% down · 7.5% · 30yr
- Down + closing
- —
- Monthly P&I
- —
- Monthly cashflow
- —
- DSCR
- —
- Eligible?
- —
Personal DTI + credit; lowest rate.
DSCR
20% down · 8.5% · 30yr
- Down + closing
- —
- Monthly P&I
- —
- Monthly cashflow
- —
- DSCR
- —
- Eligible?
- —
No personal income docs; deal must DSCR.
Hard money
10% down · 12.0% · 12mo
- Down + closing
- —
- Monthly P&I
- —
- Monthly cashflow
- —
- DSCR
- —
- Eligible?
- —
Short-term bridge; refi at stabilization.
Rent comps 40 comps
| Address | Beds | Baths | Sqft | Rent | $/sqft | DOM | Units | Dist |
|---|---|---|---|---|---|---|---|---|
| 814 Showell Ct Baltimore, MD | 3.0 | 1.0 | 1152 | $2,000 | $1.74 | 22d | 1 | 0.04mi |
| 1009 Hillman St Baltimore, MD | 3.0 | 1.0 | 1200 | $1,650 | $1.38 | 20d | 1 | 0.14mi |
| 1100 Greenmount Ave Baltimore, MD | 1.0–3.0 | 1.0–2.0 | 839 | $2,584 | $3.08 | 2d | 1 | 0.18mi |
| 1010 N Central Ave Baltimore, MD | 2.0 | 1.0 | 1023 | $1,650 | $1.61 | 24d | 1 | 0.27mi |
| 1027 N Central Ave Baltimore, MD | 3.0 | 1.0 | 1200 | $1,600 | $1.33 | 22d | 1 | 0.28mi |
| 931 N Central Ave Baltimore, MD | 3.0 | 1.0 | 1085 | $1,400 | $1.29 | 24d | 1 | 0.33mi |
| 1205 Ashland Ave Baltimore, MD | 3.0 | 1.0 | 992 | $1,550 | $1.56 | 24d | 1 | 0.33mi |
| 1317 E Eager St Baltimore, MD | 4.0 | 1.5 | 1400 | $1,900 | $1.36 | 22d | 1 | 0.33mi |
| 1232 Ashland Ave Baltimore, MD | 3.0 | 1.0 | 1200 | $1,600 | $1.33 | 22d | 1 | 0.35mi |
| 458 E Federal St Baltimore, MD | 2.0 | 2.5 | 1300 | $1,850 | $1.42 | 4d | 1 | 0.37mi |
| 456 E Federal St Baltimore, MD | 2.0 | 2.0 | 1450 | $1,850 | $1.28 | 43d | 1 | 0.37mi |
| 218 E Preston St Baltimore, MD | 2.0 | 1.0 | 1250 | $1,724 | $1.38 | 43d | 1 | 0.39mi |
| 448 Pitman Pl Baltimore, MD | 2.0 | 1.5 | 940 | $2,145 | $2.28 | 24d | 1 | 0.40mi |
| 1226 E Madison St Baltimore, MD | 3.0 | 1.0 | 1100 | $2,179 | $1.98 | 4d | 1 | 0.40mi |
| 412 E Federal St Baltimore, MD | 2.0 | 2.5 | 1100 | $1,700 | $1.55 | 24d | 1 | 0.40mi |
| 1312 Guilford Ave Baltimore, MD | 1.0–2.0 | 1.0–2.0 | 1040 | $1,850 | $1.78 | 43d | 6 | 0.41mi |
| 226 E Eager St Baltimore, MD | 3.0 | 2.0 | 1484 | $650 | $0.44 | 43d | 1 | 0.41mi |
| 1243 E Lanvale St Baltimore, MD | 3.0 | 1.5 | 1281 | $1,750 | $1.37 | 16d | 1 | 0.42mi |
| 1243 E Lanvale St Baltimore, MD | 3.0 | 1.5 | 1281 | $1,750 | $1.37 | 2d | 1 | 0.42mi |
| 1101 N Calvert St Baltimore, MD | 2.0 | 1.0–2.0 | 910 | $2,274 | $2.50 | 2d | 19 | 0.44mi |
| 1121 N Calvert St Baltimore, MD | 2.0 | 1.0 | 1300 | $1,550 | $1.19 | 43d | 1 | 0.44mi |
| 1307 E Madison St Baltimore, MD | 2.0 | 1.0 | 1200 | $1,650 | $1.38 | 43d | 1 | 0.44mi |
| 1122 N Calvert St Apt 001 Baltimore, MD | 2.0 | 2.0 | 902 | $1,800 | $2.00 | 43d | 1 | 0.45mi |
| 103 E Mt Royal Ave Baltimore, MD | 1.0–3.0 | 1.0–2.0 | 850 | $2,624 | $3.09 | 1d | 17 | 0.47mi |
| 1607 Hakesley Pl Baltimore, MD | 3.0 | 1.0 | 720 | $1,400 | $1.94 | 43d | 1 | 0.49mi |
| 1125 Saint Paul St Unit 4 Baltimore, MD | 2.0 | 1.0 | 930 | $1,650 | $1.77 | 4d | 1 | 0.49mi |
| 1125 Saint Paul St Unit 4 Baltimore, MD | 2.0 | 1.0 | 930 | $1,650 | $1.77 | 18d | 1 | 0.49mi |
| 1101 Saint Paul St Baltimore, MD | 1.0–2.0 | 1.0–2.0 | 1108 | $2,200 | $1.99 | 18d | 3 | 0.50mi |
| 210 Federal St Baltimore, MD | 3.0 | 1.0 | 900 | $1,350 | $1.50 | 20d | 1 | 0.50mi |
| 1301 Saint Paul St Baltimore, MD | 3.0 | 1.0–3.0 | 1050 | $2,399 | $2.28 | 43d | 1 | 0.50mi |
| 1711 Latrobe St Baltimore, MD | 2.0 | 1.5 | 1000 | $1,700 | $1.70 | 24d | 1 | 0.51mi |
| 1418 E Monument St Baltimore, MD | 2.0–4.0 | 1.0–2.0 | 1265 | $1,602 | $1.27 | 14d | 5 | 0.52mi |
| 1708 Latrobe St Baltimore, MD | 2.0 | 1.0 | 750 | $2,250 | $3.00 | 24d | 1 | 0.52mi |
| 22 E Preston St Unit 22-1 Baltimore, MD | 2.0 | 2.0 | 1000 | $1,699 | $1.70 | 4d | 1 | 0.55mi |
| 9 E Mount Royal Ave Baltimore, MD | 1.0–2.0 | 1.0–2.0 | 724 | $2,495 | $3.44 | 2d | 15 | 0.57mi |
| 1209 N Charles St Baltimore, MD | 1.0–2.0 | 1.0–2.0 | 1462 | $2,750 | $1.88 | 2d | 2 | 0.58mi |
| 1214 N Charles St Baltimore, MD | 2.0 | 1.0–2.0 | 1103 | $2,333 | $2.11 | 1d | 14 | 0.61mi |
| 1512 E Lafayette Ave Baltimore, MD | 3.0 | 2.5 | 1476 | $1,950 | $1.32 | 43d | 1 | 0.61mi |
| 1514 E Lafayette Ave Baltimore, MD | 3.0 | 1.5 | 1215 | $2,000 | $1.65 | 24d | 1 | 0.62mi |
| 1803 N Dallas St Baltimore, MD | 2.0 | 2.5 | 1250 | $2,100 | $1.68 | 24d | 1 | 0.62mi |
Listing history 27 events
-
2026-06-18days on market $199,900 Active 30 DOM
-
2026-06-17days on market $199,900 Active 29 DOM
-
2026-06-16days on market $199,900 Active 28 DOM
-
2026-06-15days on market $199,900 Active 27 DOM
-
2026-06-13days on market $199,900 Active 25 DOM
-
2026-06-09days on market $199,900 Active 21 DOM
-
2026-06-08days on market $199,900 Active 20 DOM
-
2026-06-07days on market $199,900 Active 19 DOM
-
2026-06-04remarks 612-char remark
-
2026-06-04days on market $199,900 Active 16 DOM
-
2026-06-03days on market $199,900 Active 15 DOM
-
2026-06-02days on market $199,900 Active 14 DOM
-
2026-06-01days on market $199,900 Active 13 DOM
-
2026-05-31days on market $199,900 Active 12 DOM
-
2026-05-19status Active
-
2026-05-03historical
-
2025-12-27historical
-
2025-12-16price $209,900
-
2025-12-02price $219,900
-
2025-10-20price $229,900
-
2025-10-16price $239,900
-
2025-10-08price $249,900
-
2025-09-11$254,900 Active
-
2025-09-09historical
-
1998-07-29historical
-
1997-12-30
-
1984-10-25soldstatus $55,500
ⓘ Source: listings_history table (triggers on properties + properties_extension) + one-shot
backfill from property_details.listing_events for pre-trigger history.
Tax reassessment forecast MD · Partial reset (capped growth)
- Current annual tax
- $1,349 · $112/mo
- Projected year-2 tax
- $1,764 · $147/mo
- Expected delta
- +$415/yr (+$35/mo · 30.8%)
ⓘ Screening estimate from a state-policy table — verify with the county assessor before closing.
Climate risk First Street
- Flood 1/10 Low FEMA zone X (unshaded) · 0% chance over 30 yrs
- Wildfire 1/10 Low
- Heat 7/10 Severe 7 d/yr ≥103°F today · 15 d/yr by 30 yrs out
- Wind 6/10 Major 27% chance of damaging wind over 30 yrs
- Air quality 4/10 Moderate 6 unhealthy d/yr today · 7 by 30 yrs out
Nearby sold comps map
Loading sold comps map…
Walkable amenities ~0.75 mi
Loading nearby amenities…
Taxation est. · year 1
- Rental income
- $22,967
- − Mortgage interest
- −$11,198
- − Property taxes
- −$1,349
- − Insurance
- −$1,000
- − Repairs & maintenance
- −$1,837
- − Management
- −$1,837
- − Depreciation
- −$5,815
- Taxable loss
- −$69
- Est. tax savings @ 24.0%
- +$17
- After-tax cash flow
- $3,232/yr
For passive investors: Depreciation is non-cash, so a rental often shows a tax loss while cash-flowing — sheltering income. Rental losses are passive: they offset passive income freely, and up to $25,000/yr can offset ordinary (W-2) income if you actively participate and your MAGI is under $100k (phasing out to $0 by $150k); unused losses carry forward. On sale, claimed depreciation is recaptured at up to 25%, and gains may owe capital-gains tax (a 1031 exchange can defer both). Figures are a year-1 estimate at your 24.0% rate — not tax advice; consult a CPA.
Schools (NCES district)
- District
- Baltimore City Public Schools
- NCES district ID
- 2400090
- Math proficiency
- 7% ▼ -9.00%
- Reading proficiency
- 16% ▼ -5.00%
- Median HH income
- $42,108
- Composite
- 10.08/100
- National rank
- #9805
- State rank
- #24 of 24 in MD
Livability — Baltimore
- Score
- 76/100
- State rank
- #90
- US rank
- #3396
Category grades
Schools grade is shown separately in the Schools card above.
Census & demographics
- Census place
- Baltimore, MD
- County
- Baltimore City · 558,601 people
- City population
- 588,727
- Metro
- Baltimore-Columbia-Towson, MD
- Population (ZIP)
- 20,683
- Household income
- $59,377
- Rent vs Own
- Severe rent burden
- 1863.0
Population outlook (Baltimore County) Hauer SSP2
- Today (2025)
- 624,249 people
- By 2030
- 621,541 · -0.4%
- By 2040
- 609,756 · -2.3%
- By 2050
- 597,249 · -4.3%
- By 2075
- 552,236 · -11.5%
- By 2100
- 513,934 · -17.7%
Race, ethnicity, and origin ACS 2023
- Neighborhood character
- Diverse neighborhood (Simpson 0.63)
- Race & ethnicity
- Black 52% White 31% Hispanic / Latino 7% Two or more races 6% Asian 5%
- Hispanic origin (detail)
- Mexican 2%
- Common ancestry
- Lithuanian 2% Romanian 2% Slovak 1%
- Foreign-born
- 12% · Canada, South Korea, China
- Languages at home
- 87% English-only · Spanish 4% Other Indo-European 2% Arabic 1%
Political lean MEDSL · Baltimore
- 2024 margin
- Solid D (+73.0) · D 85.2% · R 12.2% · Other 2.6%
- 2008→2024 swing
- -2.5pp toward R · 2008: 75.5pp · 2024: 73.0pp
- All cycles
- 2024: D+73.0 2020: D+76.6 2016: D+74.6 2012: D+76.4 2008: D+75.5
Not yet ingested
- Civics
- —
Market trends
- HPI YoY
- ▼ -25.44%
- Current HPI
- 291.3702
- Rent YoY
- ▲ 0.59%
- Metro
- Baltimore-Columbia-Towson, MD
- State GDP YoY
- ▲ 2.97%
- F500 in state
- 12
Industry mix (Fortune 500 HQ in MD)
| Industry | F500 HQs | Revenue |
|---|---|---|
| Aerospace / Defense | 1 | $71B |
|
||
| Utilities | 1 | $25B |
|
||
| Hotels | 1 | $24B |
|
||
| Consumer Goods | 1 | $7B |
|
||
| Real Estate | 1 | $6B |
|
||
| Chemicals | 1 | $2B |
|
||
Price history
+278.2% since first listed13 events — show timeline
- 2026-05-19 Relisted — BRIGHT MLS
- 2026-05-03 Listing Removed — BRIGHT MLS
- 2025-12-27 Listing Removed — BRIGHT MLS
- 2025-12-16 Price Changed $209,900 BRIGHT MLS
- 2025-12-02 Price Changed $219,900 BRIGHT MLS
- 2025-10-20 Price Changed $229,900 BRIGHT MLS
- 2025-10-16 Price Changed $239,900 BRIGHT MLS
- 2025-10-08 Price Changed $249,900 BRIGHT MLS
- 2025-09-11 Listed $254,900 BRIGHT MLS
- 2025-09-09 Coming Soon — BRIGHT MLS
- 1998-07-29 Delisted — MRIS
- 1997-12-30 Listed — MRIS
- 1984-10-25 Sold (Public Records) $55,500 Public Records
Property tax history
-2.4%/yrLatest (2025): $1,349 · +12.7% YoY. Source: county tax records.
Cash-flow waterfall
monthlySold comps — $/sqft
last 12 mo · ≤1 miLoading sold comps…