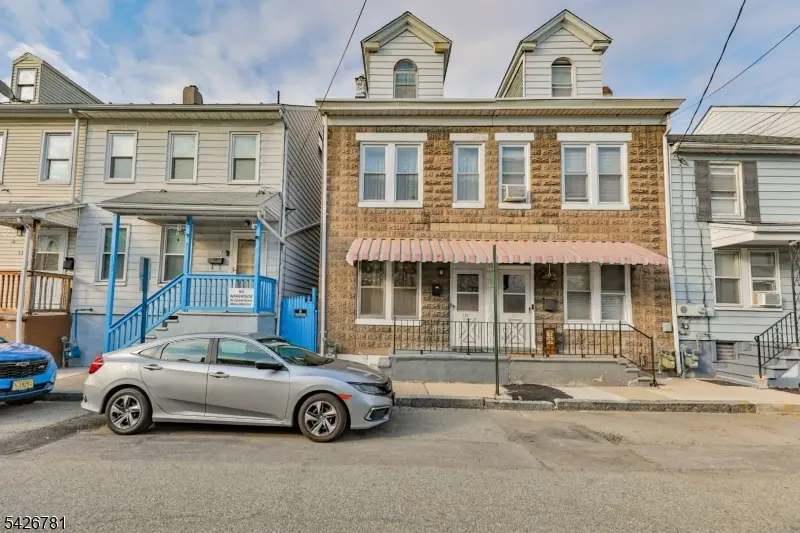
135 Mercer St · Phillipsburg, NJ
Flood risk 1/10 · Minimal
- FEMA flood zone
- X (unshaded)
- Chance of flooding over 30 yrs
- 0.0%
- Est. flood insurance / yr
- $507 – $1,088
Fire risk 1/10 · Minimal
- Est. fire insurance / yr
- $526 – $976
Heat risk 5/10 · Moderate
- Hot days now (above 100°F)
- 7 days/yr
- Hot days in 30 yrs
- 16 days/yr
Wind risk 4/10 · Minor
- Chance of severe wind over 30 yrs
- 16.0%
Air-quality risk 3/10 · Minor
- Unhealthy air days now
- 3 days/yr
- Unhealthy air days in 30 yrs
- 5 days/yr
Risk factors via First Street. Map © Google.
Why this score? — see what drove the C grade
The composite is a weighted blend of 9 inputs, each scored 0–100. Each bar is that input's sub-score; the figure is the points it added to the 100-point composite (weight × sub-score).
- Cash flow +18.2/30.0
- ARV discount +12.5/15.0
- DSCR +5.7/10.0
- Appreciation +5.0/10.0
- 1% rule +4.3/10.0
- Livability +3.8/5.0
- Rent growth +2.5/5.0
- Condition / age +2.5/5.0
- Schools +2.3/10.0
$214,900
🖨 Deal sheet 📄 Offer letter ✓ Due diligence
Listing remarks
New Roof, New Appliances, New energy saving solar panels! Welcome to this move in ready well-maintained home in the heart of Phillipsburg, New Jersey. Step into the main level where you will find a first-floor bedroom, spacious living room, eat in kitchen and first floor laundry area. The second floor offers two spacious bedrooms, full bathroom and walk in closet. The finish third level can be used as a home office, recreational or craft room. Enjoy a backyard perfect for summer entertainment. Close to recreation parks, shopping malls, restaurants & schools. Easy access to route 22 & 78, a commuter's dream! The home is just minutes from the historical downtown Easton.
Key facts
- Eat in kitchen
- New appliances
- New roof
Tags
Property features AI
Finance
- HOA & community: Pets allowed
Exterior
- Parking: On-street parking
- Utilities: Natural gas service; Public water; Public sewer
- Home design: 1/2 duplex; Approximate year built
- Construction: Cinder block siding; Asphalt shingle roof
- Exterior features: Level lot; Curbs; Open porch(es); Privacy fence; Wood fence; Sidewalk; Storm door(s)
Interior
- Kitchen: Eat-in kitchen — 9 x 14; Range/oven (electric); Refrigerator
- Bedrooms: Bedroom 1 (First level) — 9 x 13; Bedroom 2 (Second level) — 9 x 14; Bedroom 3 (Second level) — 14 x 16; Bedroom 4 (Second level)
- Flooring: Carpeting; Laminate
- Bathrooms: 1 full bathroom
- Heating & cooling: Forced hot air heating (natural gas); Ceiling fan; Wall A/C unit(s)
- Interior features: Carbon monoxide detector; Full basement
Neighborhood map
What this means for you Summary
Snapshot
- This is a 3-bed/1.0-bath single-family listed at $215k.
Deal economics
- At list price, monthly cash flow is $192 ($2k/yr) — positive.
- The deal already cash-flows at list — no discount required.
- To meet the 1% rule (rent ≥ 1% of price), the offer needs to be $200k (7.2% below list).
- Recommended offer: $200k (7.2% below list) — sets the bar for 1% rule.
- Cap rate 7.4% vs local median 4.9% in Phillipsburg — top-decile yield for the area; either an underpriced asset or a hidden risk that comps aren't pricing in. Stress-test before assuming the spread holds.
Location & tenants
- Location reads 76/100 on livability (#135 in NJ, #3,552 nationally) — a middle-class / working-renter tenant base. Strengths: housing A+, health & safety A+, cost of living A; Watch: schools C-, commute F.
- Phillipsburg School District (suburban): math 17% / reading 37% proficiency, ranked #381 of 472 in NJ (top 81%) — low school quality limits family demand, transient renter base, plan for 1-2y turnover.
- Market conditions: 1 active listings in the ZIP; 36 comparable units currently listed for rent nearby; rentals at typical pace (median 24d on market — plan ~3-4 weeks tenant-placement turnaround); 630 units permitted in Warren County in 2024 (315 in 5+ unit buildings).
Forward outlook
- In year one you build about $8k of equity ($1k loan paydown + $6k appreciation (3.0% local appreciation)).
- Warren County population projected at -10% by 2050 — secular population decline; favor cash flow + early exit over multi-decade hold.
- At projected returns (3.0% appreciation + 3.0% rent growth), your $60k cash investment doubles in ~6 years — after that, you're playing with house money.
- By year 5, paydown + projected appreciation supports a ~$34k cash-out refi (75% LTV) — recoverable capital for the next deal without selling this one.
Negotiation context
- It's been on market 20 days — a 2% lower offer ($212k) is reasonable based on typical stale-listing flexibility.
- 2 sale attempts since 5y ago with the ask held roughly flat each time — persistent listings suggest the price (not the market) is what's stuck; bring a comps-based counter.
- Current owner paid $121k; list at $215k implies a 77% gain — meaningful room to come down on a strong offer.
Risks & watch-outs
- Watch-outs: built in 1900 — expect roof / HVAC / electrical / plumbing capex.
- Climate carrying-cost: extreme-heat days projected 7→16/yr by 2055 (HVAC capex compounding) — expect insurance premiums to compound above CPI over the hold.
Questions for the listing agent
- Built in 1900 — when were the roof, HVAC, electrical panel, plumbing, and water heater last replaced?
- Is there a deadline driving the sale (1031 exchange, divorce, estate, relocation)? That informs how much negotiation room exists.
- What's the average days-on-market for RENTAL listings here right now (not sales)? A rising rental-DOM trend means longer vacancies and softer asking-rent achievability than the comps imply.
- What's the recent tenant-quality profile in this submarket — average credit score on applications, eviction rate, late-payment / NSF rate, and stable-employment percentage? A property-management company in the area should have these aggregated.
- How much new for-sale + rental construction is in the pipeline within 1–3 miles? Heavy new supply typically softens prices + rents 12–24 months out; constrained supply supports both.
Investment metrics
- 1% rule
- 0.93% ✗
- Cap rate
- 7.37%
- Cash-on-cash
- 3.83%
- DSCR
- 1.17
- GRM
- 9.0
CMA / ARV
- ARV (median comp)
- $241,565
- List price
- $214,900
- Delta
- -0.69%
- Verdict
- FAIR
- Comps
- 10 within 1.0 mi
Show comp detail 5 sales within ~0.75 mi
| Address | Dist | Beds/Ba | Sqft | Sold | Price | $/sf | Match |
|---|---|---|---|---|---|---|---|
| 1241 Cedarville Rd | 0.68mi | 3/1.5 | 1,488 (+8%) | 5mo | $390,000 | $262 | 48 |
| 127 High Point Ln | 0.59mi | 3/2.0 | 1,292 (-6%) | 14mo | $285,000 | $221 | 47 |
| 76 Glen Ave | 0.54mi | 4/1.0 (+1) | 1,262 (-8%) | 12mo | $259,900 | $206 | 46 |
| 315 Mercer St | 0.38mi | 4/1.5 (+1) | 1,518 (+10%) | 16mo | $300,000 | $198 | 45 |
| 201 E Nesquehoning St | 0.72mi | 2/1.5 (-1) | 1,204 (-13%) | 12mo | $250,000 | $208 | 28 |
Match score weights: distance 35% · size 25% · config 20% · recency 20%. Top-matched comps best support the ARV.
Projected returns pro-forma
3.0% appreciation · 3.0% rent growth · sell at horizon
- IRR
- 11.1%
- Equity multiple
- 1.63×
- Total profit
- $38,096
- Equity at exit
- $96,628
- IRR
- 13.3%
- Equity multiple
- 2.97×
- Total profit
- $118,453
- Equity at exit
- $148,916
Cash invested: $60,172 (down + closing). Projections, not guarantees.
Landlord ↔ Tenant lean methodology
- Overall (STATE)
- 21 Tenant-Leaning
- State New Jersey
- 21 Tenant-Leaning · D+6
- County
- — inherits STATE
- City
- — inherits STATE
ZIP-level market 08865-3041
- Active inventory
- 1
- Price-to-rent
- 9.0×
Monthly cashflow live
- Estimated rent
- $1,995 high interval (Pro) →
- Mortgage (P&I)
- −$1,127
- Tax from tax record
- −$168 /mo · $2,010/yr
- Insurance
- −$90
- HOA
- −$0
- Vacancy / Maint / Mgmt
- −$419
- Net cashflow
- $192
Break-even live
UW: 25.0% down · 7.5% · 30yr · 1.5% tax · 5.0% vac · 8.0% maint · 8.0% mgmt
Financing live
Cash to close
- Down payment
- $53,725
- Closing costs
- $6,447
- Reserves months
- —
- Total cash needed
- —
Loan-product check · same deal, 3 products live
Conventional
25% down · 7.5% · 30yr
- Down + closing
- —
- Monthly P&I
- —
- Monthly cashflow
- —
- DSCR
- —
- Eligible?
- —
Personal DTI + credit; lowest rate.
DSCR
20% down · 8.5% · 30yr
- Down + closing
- —
- Monthly P&I
- —
- Monthly cashflow
- —
- DSCR
- —
- Eligible?
- —
No personal income docs; deal must DSCR.
Hard money
10% down · 12.0% · 12mo
- Down + closing
- —
- Monthly P&I
- —
- Monthly cashflow
- —
- DSCR
- —
- Eligible?
- —
Short-term bridge; refi at stabilization.
Rent comps 36 comps
| Address | Beds | Baths | Sqft | Rent | $/sqft | DOM | Units | Dist |
|---|---|---|---|---|---|---|---|---|
| 1 Sitgreaves St Unit 3B Phillipsburg, NJ | 2.0 | 1.0 | 900 | $1,650 | $1.83 | 23d | 1 | 0.16mi |
| 1 Sitgreaves St Unit 3B Phillipsburg, NJ | 2.0 | 1.0 | 900 | $1,600 | $1.78 | 2d | 1 | 0.16mi |
| 210 Washington St Phillipsburg, NJ | 4.0 | 1.5 | 1000 | $2,300 | $2.30 | 2d | 1 | 0.37mi |
| 152 S Main St Phillipsburg, NJ | 2.0 | 1.0 | 900 | $1,650 | $1.83 | 23d | 1 | 0.44mi |
| 226 Vista Dr Easton, PA | 3.0 | 1.5 | 1358 | $2,195 | $1.62 | 2d | 1 | 0.55mi |
| 75 S Main St Phillipsburg, NJ | 1.0–2.0 | 1.0–2.0 | 847 | $2,239 | $2.64 | 2d | 4 | 0.58mi |
| 43-45 S Main St Unit 3 Phillipsburg, NJ | 3.0 | 2.0 | 1200 | $2,200 | $1.83 | 23d | 1 | 0.62mi |
| 689 Sayre Ave Phillipsburg, NJ | 4.0 | 1.5 | 1376 | $2,200 | $1.60 | 2d | 1 | 0.77mi |
| 100 Northampton St Easton, PA | 1.0–2.0 | 1.0–2.0 | 995 | $3,650 | $3.67 | 2d | 6 | 0.78mi |
| 355 Thomas St Phillipsburg, NJ | 3.0 | 1.5 | 1400 | $2,250 | $1.61 | 11d | 1 | 0.83mi |
| 270 Bates St Phillipsburg, NJ | 2.0 | 1.0 | 1368 | $2,100 | $1.54 | 23d | 1 | 0.89mi |
| 199 Cedar Park Blvd Easton, PA | 1.0–3.0 | 1.0–4.0 | 1410 | $3,035 | $2.15 | 2d | 10 | 0.91mi |
| 322 Saint John St Easton, PA | 3.0 | 1.5 | 1583 | $1,895 | $1.20 | 44d | 1 | 0.94mi |
| 214 Spring Garden St Unit 2B Easton, PA | 2.0 | 1.0 | 1250 | $2,995 | $2.40 | 21d | 1 | 0.96mi |
| 140 S 4th St Easton, PA | 2.0 | 1.0–2.0 | 841 | $2,460 | $2.93 | 2d | 106 | 0.96mi |
| 330 Northampton St Easton, PA | 2.0 | 2.0 | 1088 | $1,750 | $1.61 | 44d | 1 | 1.01mi |
| 330 Northampton St Unit 205 Easton, PA | 2.0 | 2.0 | 1088 | $1,750 | $1.61 | 23d | 1 | 1.01mi |
| 49 N Delaware Dr Unit 3rd Floor Easton, PA | 2.0 | 1.0 | 1500 | $2,495 | $1.66 | 19d | 1 | 1.01mi |
| 276 W Saint Joseph St Easton, PA | 3.0 | 1.5 | 1315 | $1,700 | $1.29 | 44d | 1 | 1.05mi |
| 303 W Lincoln St Easton, PA | 3.0 | 1.0 | 1796 | $2,175 | $1.21 | 44d | 1 | 1.12mi |
| 40 S 6th St Easton, PA | 1.0–2.0 | 1.0–2.0 | 1156 | $3,000 | $2.59 | 14d | 11 | 1.15mi |
| 142 S Union St Easton, PA | 3.0 | 2.0 | 1300 | $1,895 | $1.46 | 44d | 1 | 1.17mi |
| 215 Cattell St Unit 2nd Floor Easton, PA | 2.0 | 1.0 | 1000 | $1,600 | $1.60 | 23d | 1 | 1.23mi |
| 623 Walnut St Unit C2 Easton, PA | 2.0 | 2.5 | 1500 | $2,300 | $1.53 | 44d | 1 | 1.24mi |
| 623 Walnut St Unit A2 Easton, PA | 2.0 | 2.0 | 1500 | $2,250 | $1.50 | 23d | 1 | 1.24mi |
| 457 W Lincoln St Easton, PA | 1.0–2.0 | 1.0–2.0 | 837 | $1,932 | $2.31 | 2d | 6 | 1.35mi |
| 29 S 7th St Easton, PA | 2.0 | 2.0 | 1100 | $1,350 | $1.23 | 14d | 1 | 1.38mi |
| 35 N 7th St Easton, PA | 3.0 | 1.0 | 1088 | $1,750 | $1.61 | 14d | 1 | 1.40mi |
| 513 Cattell St Easton, PA | 3.0 | 1.5 | 1536 | $2,300 | $1.50 | 44d | 1 | 1.43mi |
| 812 Ferry St Easton, PA | 2.0 | 1.0 | 1000 | $1,640 | $1.64 | 23d | 1 | 1.44mi |
| 137 N 7th St Apt 1 Easton, PA | 2.0 | 1.0 | 1000 | $1,395 | $1.40 | 2d | 1 | 1.45mi |
| 810 Pine St Easton, PA | 3.0 | 1.0 | 1120 | $1,800 | $1.61 | 23d | 1 | 1.46mi |
| 810 Pine St Easton, PA | 3.0 | 1.0 | 1120 | $1,800 | $1.61 | 44d | 1 | 1.46mi |
| 600 Canal St Easton, PA | 2.0 | 1.0 | 900 | $1,599 | $1.78 | 2d | 2 | 1.48mi |
| 600 Canal St Easton, PA | 2.0 | 1.0 | 900 | $1,599 | $1.78 | 23d | 2 | 1.48mi |
| 214 N 7th St Unit NA Easton, PA | 2.0 | 1.0 | 1000 | $1,550 | $1.55 | 2d | 1 | 1.50mi |
Listing history 23 events
-
2026-06-18days on market $214,900 Active 20 DOM
-
2026-06-17days on market $214,900 Active 19 DOM
-
2026-06-16days on market $214,900 Active 18 DOM
-
2026-06-15days on market $214,900 Active 17 DOM
-
2026-06-14days on market $214,900 Active 15 DOM
-
2026-06-13days on market $214,900 Active 14 DOM
-
2026-06-10days on market $214,900 Active 12 DOM
-
2026-06-09days on market $214,900 Active 11 DOM
-
2026-06-08days on market $214,900 Active 10 DOM
-
2026-06-07days on market $214,900 Active 9 DOM
-
2026-06-05days on market $214,900 Active 6 DOM
-
2026-06-03days on market $214,900 Active 5 DOM
-
2026-06-02days on market $214,900 Active 4 DOM
-
2026-06-01days on market $214,900 Active 3 DOM
-
2026-05-31days on market $214,900 Active 2 DOM
-
2026-05-31pricedays on market $214,900 Active 1 DOM
-
2026-04-25$239,900 Active 692-char remark
-
2026-04-24historical $239,900 692-char remark
-
2021-12-16soldstatus $121,300
-
2021-12-06historical
-
2021-12-02soldstatus $121,300 Sold
-
2021-08-27$115,000 Active
-
1990-08-29soldstatus $62,000
ⓘ Source: listings_history table (triggers on properties + properties_extension) + one-shot
backfill from property_details.listing_events for pre-trigger history.
Tax reassessment forecast NJ · Partial reset (capped growth)
- Current annual tax
- $2,010 · $168/mo
- Projected year-2 tax
- $3,681 · $307/mo
- Expected delta
- +$1,670/yr (+$139/mo · 83.1%)
ⓘ Screening estimate from a state-policy table — verify with the county assessor before closing.
Climate risk First Street
- Flood 1/10 Low FEMA zone X (unshaded) · 0% chance over 30 yrs
- Wildfire 1/10 Low
- Heat 5/10 Major 7 d/yr ≥100°F today · 16 d/yr by 30 yrs out
- Wind 4/10 Moderate 16% chance of damaging wind over 30 yrs
- Air quality 3/10 Moderate 3 unhealthy d/yr today · 5 by 30 yrs out
Nearby sold comps map
Loading sold comps map…
Walkable amenities ~0.75 mi
Loading nearby amenities…
Taxation est. · year 1
- Rental income
- $23,942
- − Mortgage interest
- −$12,038
- − Property taxes
- −$2,010
- − Insurance
- −$1,074
- − Repairs & maintenance
- −$1,915
- − Management
- −$1,915
- − Depreciation
- −$6,252
- Taxable loss
- −$1,263
- Est. tax savings @ 24.0%
- +$303
- After-tax cash flow
- $2,609/yr
For passive investors: Depreciation is non-cash, so a rental often shows a tax loss while cash-flowing — sheltering income. Rental losses are passive: they offset passive income freely, and up to $25,000/yr can offset ordinary (W-2) income if you actively participate and your MAGI is under $100k (phasing out to $0 by $150k); unused losses carry forward. On sale, claimed depreciation is recaptured at up to 25%, and gains may owe capital-gains tax (a 1031 exchange can defer both). Figures are a year-1 estimate at your 24.0% rate — not tax advice; consult a CPA.
Schools (NCES district)
- District
- Phillipsburg School District
- NCES district ID
- 3412960
- Math proficiency
- 17% ▼ -15.00%
- Reading proficiency
- 37% ▼ -9.00%
- Median HH income
- $45,364
- Composite
- 23.2/100
- National rank
- #7943
- State rank
- #381 of 472 in NJ
Livability — Phillipsburg
- Score
- 76/100
- State rank
- #135
- US rank
- #3552
Category grades
Schools grade is shown separately in the Schools card above.
Census & demographics
- Census place
- Phillipsburg, NJ
Population outlook (Warren County) Hauer SSP2
- Today (2025)
- 105,498 people
- By 2030
- 103,974 · -1.4%
- By 2040
- 99,748 · -5.5%
- By 2050
- 94,535 · -10.4%
- By 2075
- 87,220 · -17.3%
- By 2100
- 80,421 · -23.8%
Not yet ingested
- Political lean
- —
- Race & ethnicity
- —
- Common origin
- —
- Civics
- —
Market trends
- HPI YoY
- —
- Current HPI
- —
- Rent YoY
- —
- Metro
- —
- State GDP YoY
- ▲ 2.05%
- F500 in state
- 34
Industry mix (Fortune 500 HQ in NJ)
| Industry | F500 HQs | Revenue |
|---|---|---|
| Consumer Goods | 3 | $31B |
|
||
| Pharmaceuticals | 2 | $153B |
|
||
| Technology | 2 | $21B |
|
||
| Insurance | 2 | $20B |
|
||
| Healthcare | 2 | $19B |
|
||
| Financial Services | 1 | $70B |
|
||
Price history
+246.6% since first listed6 events — show timeline
- 2026-05-29 Listed $214,900 GSMLS
- 2021-12-16 Sold (Public Records) $121,300 Public Records
- 2021-12-06 Delisted — GSMLS
- 2021-12-02 Sold (MLS) $121,300 GSMLS
- 2021-08-27 Listed $115,000 GSMLS
- 1990-08-29 Sold (Public Records) $62,000 Public Records
Property tax history
+0.1%/yrLatest (2025): $2,010 · +2.9% YoY. Source: county tax records.
Cash-flow waterfall
monthlySold comps — $/sqft
last 12 mo · ≤1 miLoading sold comps…