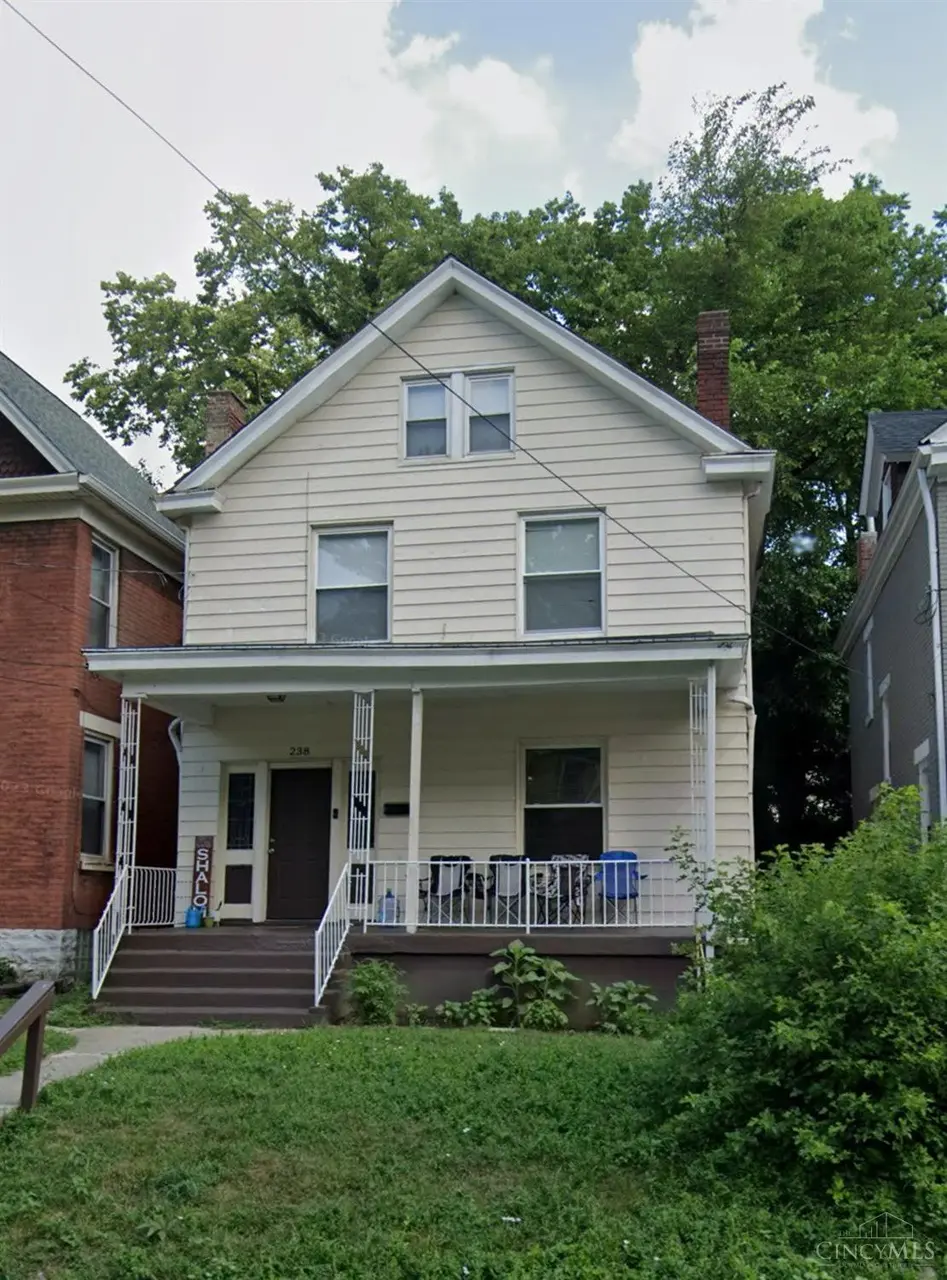
238 Helen St · Cincinnati, OH
Flood risk 1/10 · Minimal
- FEMA flood zone
- X (unshaded)
- Chance of flooding over 30 yrs
- 0.0%
- Est. flood insurance / yr
- $473 – $860
Fire risk 1/10 · Minimal
- Est. fire insurance / yr
- $713 – $1,323
Heat risk 4/10 · Minor
- Hot days now (above 103°F)
- 7 days/yr
- Hot days in 30 yrs
- 17 days/yr
Wind risk 2/10 · Minimal
- Chance of severe wind over 30 yrs
- 1.0%
Air-quality risk 3/10 · Minor
- Unhealthy air days now
- 2 days/yr
- Unhealthy air days in 30 yrs
- 3 days/yr
Risk factors via First Street. Map © Google.
Why this score? — see what drove the C+ grade
The composite is a weighted blend of 9 inputs, each scored 0–100. Each bar is that input's sub-score; the figure is the points it added to the 100-point composite (weight × sub-score).
- Cash flow +23.3/30.0
- ARV discount +14.8/15.0
- DSCR +7.5/10.0
- 1% rule +5.4/10.0
- Livability +4.0/5.0
- Rent growth +3.0/5.0
- Schools +2.5/10.0
- Condition / age +2.5/5.0
- Appreciation +0.0/10.0
$279,000
🖨 Deal sheet 📄 Offer letter ✓ Due diligence
Listing remarks MLS
Opportunity in red hot Mt. Auburn. 5 bedroom 1 bath home with plenty of room. Located in an area with tremendous ARV and rent potential. Kitchen walks out to deck and flat yard. Large rooms. Great location, just minutes from OTR and downtown Cincinnati.
Key facts
- Flexible layout
- Usable backyard
- Walks out to a deck
Tags
Property features AI
Finance
- HOA & community: No homeowners association
Exterior
- Utilities: Public water; Public sewer; Natural gas
- Home design: Traditional single-family home; Three or more levels
- Construction: Block foundation
- Exterior features: Shingle roof; Double-hung vinyl windows; Aluminum and vinyl siding; Approximately 0.04 acre lot
Interior
- Kitchen: Kitchen approximately 8 x 11
- Bedrooms: 5 bedrooms; Primary bedroom approximately 12 x 15 (on level 2); Bedroom 2 approximately 10 x 10 (on level 2); Bedroom 3 approximately 13 x 14 (on level 2); Bedroom 4 approximately 15 x 25 (on level 3); Bedroom 5 approximately 9 x 10 (on level 3)
- Bathrooms: 2 full bathrooms; Primary bathroom with shower
- Heating & cooling: Forced air heating (gas); Central air conditioning; Gas water heater
- Interior features: 11 total rooms; Full basement
- Laundry & utility: Basement utility space
Neighborhood map
What this means for you Summary
Snapshot
- This is a 3-bed/1.0-bath single-family listed at $279k.
Deal economics
- At list price, monthly cash flow is $510 ($6k/yr) — positive.
- The deal already cash-flows at list — no discount required.
- Meets the 1% rule at list price ($3k rent vs $279k).
- Recommended offer: $262k (6.0% below list) — sets the bar for market timing.
- Cap rate 8.5% vs local median 3.9% in Cincinnati — top-decile yield for the area; either an underpriced asset or a hidden risk that comps aren't pricing in. Stress-test before assuming the spread holds.
Location & tenants
- Location reads 80/100 on livability (#130 in OH, #1,856 nationally) — a professional / high-income tenant draw. Strengths: amenities A+, commute A+, cost of living A+; Watch: employment D, crime F.
- Cincinnati Public Schools (urban): math 25% / reading 36% proficiency, ranked #581 of 656 in OH (top 89%) — families likely to look elsewhere, expect single-tenant / working-renter base with shorter leases; 70% free/reduced lunch — lower-income household profile, screen leases tightly.
- Market conditions: Rents rising (+2.1%/yr); 71 active listings in the ZIP; 40 comparable units currently listed for rent nearby; rentals at typical pace (median 17d on market — plan ~3-4 weeks tenant-placement turnaround); lower-income renter base — watch delinquency; 801 units permitted in Hamilton County in 2024 (190 in 5+ unit buildings).
- At $2,899/mo this rent would consume 98% of the median local household income ($36k/yr) (locally 2461% of renters already pay >50% of income on rent) — very limited rent-growth headroom before tenants either downsize or default.
Forward outlook
- Local home prices are declining (-3.0%/yr); year-one equity from $2k of loan paydown is wiped out by about $8k of value loss. Plan a longer hold.
Negotiation context
- It's been on market 86 days — a 6% lower offer ($262k) is reasonable based on typical stale-listing flexibility.
- 8 sale attempts since 22y ago; this cycle's ask has dropped $36k (11%) from the opening price — seller is motivated, your offer sets the floor, not the list.
- Current owner paid $171k; list at $279k implies a 63% gain — meaningful room to come down on a strong offer.
Risks & watch-outs
- Watch-outs: built in 1905 — expect roof / HVAC / electrical / plumbing capex.
Questions for the listing agent
- It's been on market 86 days. Have you received any prior offers? Is the seller open to a 6% concession, seller financing, or rate buy-down credit?
- Built in 1905 — when were the roof, HVAC, electrical panel, plumbing, and water heater last replaced?
- Why hasn't it sold? Are there any deal-killer items the seller is aware of (foundation, flood, title, zoning, code violations)?
- Is there a deadline driving the sale (1031 exchange, divorce, estate, relocation)? That informs how much negotiation room exists.
- Schools are B-rated — typically a magnet for longer-tenancy family renters. What's the average tenant stay here, and is there a school-zone premium baked into asking?
- Crime grade is F in this area — have there been break-ins, vandalism, or insurance claims at this property in the last 3 years? What carrier currently insures it and at what premium?
- What's the average days-on-market for RENTAL listings here right now (not sales)? A rising rental-DOM trend means longer vacancies and softer asking-rent achievability than the comps imply.
- What's the recent tenant-quality profile in this submarket — average credit score on applications, eviction rate, late-payment / NSF rate, and stable-employment percentage? A property-management company in the area should have these aggregated.
- How much new for-sale + rental construction is in the pipeline within 1–3 miles? Heavy new supply typically softens prices + rents 12–24 months out; constrained supply supports both.
Investment metrics
- 1% rule
- 1.04% ✓
- Cap rate
- 8.49%
- Cash-on-cash
- 7.84%
- DSCR
- 1.35
- GRM
- 8.0
CMA / ARV
- ARV (on-the-fly)
- $332,878
- Comps found
- 12
Show comp detail 12 sales within ~0.75 mi
| Address | Dist | Beds/Ba | Sqft | Sold | Price | $/sf | Match |
|---|---|---|---|---|---|---|---|
| 268 Mccormick Pl | 0.08mi | 4/2.0 (+1) | 1,917 (+5%) | 2mo | $246,000 | $128 | 77 |
| 2344 Highland Ave | 0.18mi | 3/1.0 | 1,637 (-10%) | 1mo | $207,000 | $126 | 73 |
| 1723 Highland Ave | 0.70mi | 3/1.5 | 1,892 (+3%) | 4mo | $435,000 | $230 | 56 |
| 295 Dorchester Ave | 0.47mi | 2/1.5 (-1) | 1,646 (-10%) | 3mo | $300,000 | $182 | 52 |
| 750 Morgan St | 0.74mi | 4/2.0 (+1) | 1,872 (+2%) | 5mo | $132,000 | $71 | 48 |
| 2101 Ohio Ave | 0.67mi | 3/2.0 | 1,724 (-6%) | 8mo | $150,000 | $87 | 48 |
| 36 E Clifton Ave | 0.69mi | 4/2.0 (+1) | 1,960 (+7%) | 2mo | $84,500 | $43 | 45 |
| 2130 Loth St | 0.58mi | 3/2.5 | 2,010 (+10%) | 9mo | $420,000 | $209 | 43 |
| 2410 Kenton St | 0.67mi | 3/2.0 | 2,056 (+12%) | 3mo | $220,000 | $107 | 42 |
| 2314 Sauer Ave | 0.66mi | 4/2.0 (+1) | 1,741 (-5%) | 15mo | $350,000 | $201 | 40 |
| 2528 Hemlock St | 0.73mi | 4/2.5 (+1) | 1,984 (+8%) | 2mo | $364,900 | $184 | 39 |
| 548 Slack St | 0.68mi | 3/3.5 | 2,056 (+12%) | 3mo | $595,000 | $289 | 36 |
Match score weights: distance 35% · size 25% · config 20% · recency 20%. Top-matched comps best support the ARV.
Projected returns pro-forma
-3.0% appreciation · 2.07% rent growth · sell at horizon
- IRR
- -5.4%
- Equity multiple
- 0.80×
- Total profit
- $-15,445
- Equity at exit
- $41,600
- IRR
- 3.2%
- Equity multiple
- 1.22×
- Total profit
- $17,383
- Equity at exit
- $24,123
Cash invested: $78,120 (down + closing). Projections, not guarantees.
Landlord ↔ Tenant lean methodology
- Overall (STATE)
- 73 Landlord-Friendly
- State Ohio
- 73 Landlord-Friendly · R+6
- County
- — inherits STATE
- City
- — inherits STATE
ZIP-level market 45219
- Home prices YoY
- -28.3%
- Rents YoY
- 2.1%
- Active inventory
- 71
- Price-to-rent
- 8.0×
Monthly cashflow live
- Estimated rent
- $2,899 high interval (Pro) →
- Mortgage (P&I)
- −$1,463
- Tax from tax record
- −$200 /mo · $2,402/yr
- Insurance
- −$116
- HOA
- −$0
- Vacancy / Maint / Mgmt
- −$609
- Net cashflow
- $510
Break-even live
UW: 25.0% down · 7.5% · 30yr · 1.5% tax · 5.0% vac · 8.0% maint · 8.0% mgmt
Financing live
Cash to close
- Down payment
- $69,750
- Closing costs
- $8,370
- Reserves months
- —
- Total cash needed
- —
Loan-product check · same deal, 3 products live
Conventional
25% down · 7.5% · 30yr
- Down + closing
- —
- Monthly P&I
- —
- Monthly cashflow
- —
- DSCR
- —
- Eligible?
- —
Personal DTI + credit; lowest rate.
DSCR
20% down · 8.5% · 30yr
- Down + closing
- —
- Monthly P&I
- —
- Monthly cashflow
- —
- DSCR
- —
- Eligible?
- —
No personal income docs; deal must DSCR.
Hard money
10% down · 12.0% · 12mo
- Down + closing
- —
- Monthly P&I
- —
- Monthly cashflow
- —
- DSCR
- —
- Eligible?
- —
Short-term bridge; refi at stabilization.
Rent comps 40 comps
| Address | Beds | Baths | Sqft | Rent | $/sqft | DOM | Units | Dist |
|---|---|---|---|---|---|---|---|---|
| 236 Gilman Ave Cincinnati, OH | 3.0 | 2.5 | 1699 | $2,200 | $1.29 | 12d | 1 | 0.14mi |
| 216 Gilman Ave Unit 1363975P Cincinnati, OH | 3.0 | 1.0 | 1776 | $3,474 | $1.96 | 2d | 1 | 0.14mi |
| 205 William Howard Taft Rd Cincinnati, OH | 3.0 | 2.0 | 1300 | $1,300 | $1.00 | 23d | 1 | 0.27mi |
| 2025 Burnet Ave Unit 2 Cincinnati, OH | 3.0 | 2.0 | 1513 | $1,795 | $1.19 | 3d | 1 | 0.43mi |
| 2271 Vine St Cincinnati, OH | 4.0 | 2.0 | 2268 | $1,525 | $0.67 | 4d | 1 | 0.43mi |
| 2813 Gerard St Unit 1540075P Cincinnati, OH | 4.0 | 3.0 | 2152 | $6,281 | $2.92 | 20d | 1 | 0.54mi |
| 2800 Jefferson Ave Cincinnati, OH | 4.0 | 2.0 | 2500 | $625 | $0.25 | 19d | 1 | 0.58mi |
| 55 Mulberry St Cincinnati, OH | 3.0 | 3.0 | 2500 | $3,500 | $1.40 | 23d | 1 | 0.63mi |
| 651 William Howard Taft Rd Cincinnati, OH | 2.0 | 2.5 | 1637 | $3,070 | $1.88 | 23d | 1 | 0.64mi |
| 2517 May St Cincinnati, OH | 3.0 | 3.5 | 2014 | $3,420 | $1.70 | 21d | 1 | 0.65mi |
| 704 Wayne St Unit 1056107P Cincinnati, OH | 3.0 | 2.0 | 1291 | $3,898 | $3.02 | 14d | 1 | 0.66mi |
| 2601 May St Cincinnati, OH | 2.0–3.0 | 2.5–3.5 | 1737 | $3,325 | $1.91 | 1d | 12 | 0.67mi |
| 55 E Clifton Ave Unit B Cincinnati, OH | 2.0 | 2.0 | 1395 | $2,500 | $1.79 | 23d | 1 | 0.68mi |
| 2611 May St Cincinnati, OH | 2.0 | 2.5 | 1637 | $3,070 | $1.88 | 13d | 1 | 0.70mi |
| 107 E Clifton Ave Unit 1234537P Cincinnati, OH | 2.0–3.0 | 1.0–2.0 | 2260 | $6,619 | $2.93 | 14d | 2 | 0.71mi |
| 3010 Eden Ave Cincinnati, OH | 1.0–2.0 | 1.0–2.0 | 1114 | $3,060 | $2.75 | 1d | 28 | 0.71mi |
| 2132 Gilbert Ave Unit A Cincinnati, OH | 2.0 | 2.5 | 1450 | $2,250 | $1.55 | 4d | 1 | 0.72mi |
| 3031 Eden Ave Cincinnati, OH | 1.0–2.0 | 1.0–2.0 | 1113 | $3,150 | $2.83 | 21d | 9 | 0.73mi |
| 2386 Wheeler St Cincinnati, OH | 4.0 | 1.0 | 1740 | $2,700 | $1.55 | 23d | 1 | 0.75mi |
| 2388 Wheeler St Cincinnati, OH | 4.0 | 2.0 | 1740 | $2,700 | $1.55 | 23d | 1 | 0.75mi |
| 1826 Republic St Unit 1056093P Cincinnati, OH | 2.0 | 1.0 | 1614 | $2,812 | $1.74 | 14d | 1 | 0.76mi |
| 749 Morgan St Cincinnati, OH | 3.0 | 2.0 | 1488 | $1,745 | $1.17 | 14d | 1 | 0.76mi |
| 242 Stetson St Unit NA Cincinnati, OH | 3.0 | 2.5 | 2300 | $3,500 | $1.52 | 21d | 1 | 0.76mi |
| 217 Emming St Unit 1 Cincinnati, OH | 4.0 | 2.0 | 1510 | $1,800 | $1.19 | 23d | 1 | 0.77mi |
| 424 Liberty Hl Unit 1056033P Cincinnati, OH | 3.0 | 2.0 | 1453 | $5,780 | $3.98 | 1d | 1 | 0.78mi |
| 1610 Sycamore St Cincinnati, OH | 2.0 | 2.0 | 1600 | $1,900 | $1.19 | 10d | 1 | 0.78mi |
| 1602 Mansfield St Unit 1056028P Cincinnati, OH | 2.0 | 2.0 | 1453 | $4,145 | $2.85 | 1d | 1 | 0.80mi |
| 1354 Broadway Unit 1056136P Cincinnati, OH | 4.0 | 3.0 | 2529 | $7,307 | $2.89 | 2d | 1 | 0.81mi |
| 2332 Chickasaw St Unit 1 Cincinnati, OH | 3.0 | 1.0 | 2000 | $1,800 | $0.90 | 23d | 1 | 0.82mi |
| 1410 Mansfield St Apt 4 Cincinnati, OH | 3.0 | 2.0 | 1412 | $2,387 | $1.69 | 10d | 1 | 0.83mi |
| 1410 Mansfield St Apt 3 Cincinnati, OH | 3.0 | 2.0 | 1412 | $2,401 | $1.70 | 10d | 1 | 0.83mi |
| 918 Windsor St Cincinnati, OH | 3.0 | 1.0 | 2583 | $1,675 | $0.65 | 23d | 1 | 0.85mi |
| 111 W Elder St Unit 1056044P Cincinnati, OH | 1.0–4.0 | 1.0–4.0 | 1835 | $5,561 | $3.03 | 10d | 2 | 0.88mi |
| 1326 Broadway Unit 1324946P Cincinnati, OH | 1.0–3.0 | 1.0–3.0 | 1162 | $10,683 | $9.19 | 23d | 2 | 0.88mi |
| 923 Rogers Pl Cincinnati, OH | 3.0 | 1.0 | 2061 | $1,600 | $0.78 | 23d | 1 | 0.90mi |
| 2235 Victor St Cincinnati, OH | 4.0 | 2.0 | 2043 | $2,250 | $1.10 | 23d | 1 | 0.92mi |
| 1304 Broadway Unit 1056130P Cincinnati, OH | 1.0–5.0 | 1.0–4.0 | 2072 | $5,808 | $2.80 | 10d | 2 | 0.93mi |
| 1537 Republic St Unit 1058850P Cincinnati, OH | 4.0 | 3.0 | 2421 | $10,677 | $4.41 | 21d | 1 | 0.95mi |
| 1287 Ida St Cincinnati, OH | 3.0 | 2.5 | 2494 | $4,700 | $1.88 | 16d | 1 | 0.95mi |
| 516 E 12th St Unit 1314562P Cincinnati, OH | 4.0 | 2.0 | 2023 | $10,170 | $5.03 | 23d | 1 | 0.96mi |
Listing history 36 events
-
2026-06-18days on market $279,000 Active 86 DOM
-
2026-06-17days on market $279,000 Active 85 DOM
-
2026-06-16days on market $279,000 Active 84 DOM
-
2026-06-15days on market $279,000 Active 83 DOM
-
2026-06-13days on market $279,000 Active 81 DOM
-
2026-06-13days on market $279,000 Active 80 DOM
-
2026-06-09days on market $279,000 Active 77 DOM
-
2026-06-08days on market $279,000 Active 76 DOM
-
2026-06-07days on market $279,000 Active 75 DOM
-
2026-06-03days on market $279,000 Active 71 DOM
-
2026-06-02days on market $279,000 Active 70 DOM
-
2026-06-01days on market $279,000 Active 69 DOM
-
2026-05-31days on market $279,000 Active 68 DOM
-
2026-05-22price $279,000
-
2026-05-20price $289,000
-
2026-04-28price $299,900
-
2026-04-06price $305,000
-
2026-03-24$315,000 Active
-
2024-03-14soldstatus $171,000
-
2024-02-23soldstatus $171,000 Sold 253-char remark
Show marketing remark (253 chars)
Opportunity in red hot Mt. Auburn. 5 bedroom 1 bath home with plenty of room. Located in an area with tremendous ARV and rent potential. Kitchen walks out to deck and flat yard. Large rooms. Great location, just minutes from OTR and downtown Cincinnati.
-
2024-02-23soldstatus $171,000 Closed 253-char remark
Show marketing remark (253 chars)
Opportunity in red hot Mt. Auburn. 5 bedroom 1 bath home with plenty of room. Located in an area with tremendous ARV and rent potential. Kitchen walks out to deck and flat yard. Large rooms. Great location, just minutes from OTR and downtown Cincinnati.
-
2024-02-23soldstatus $171,000 Sold 253-char remark
Show marketing remark (253 chars)
Opportunity in red hot Mt. Auburn. 5 bedroom 1 bath home with plenty of room. Located in an area with tremendous ARV and rent potential. Kitchen walks out to deck and flat yard. Large rooms. Great location, just minutes from OTR and downtown Cincinnati.
-
2024-01-26status Pending 253-char remark
Show marketing remark (253 chars)
Opportunity in red hot Mt. Auburn. 5 bedroom 1 bath home with plenty of room. Located in an area with tremendous ARV and rent potential. Kitchen walks out to deck and flat yard. Large rooms. Great location, just minutes from OTR and downtown Cincinnati.
-
2024-01-26historical Active/Pending 253-char remark
Show marketing remark (253 chars)
Opportunity in red hot Mt. Auburn. 5 bedroom 1 bath home with plenty of room. Located in an area with tremendous ARV and rent potential. Kitchen walks out to deck and flat yard. Large rooms. Great location, just minutes from OTR and downtown Cincinnati.
-
2024-01-17$169,900 Active 253-char remark
Show marketing remark (253 chars)
Opportunity in red hot Mt. Auburn. 5 bedroom 1 bath home with plenty of room. Located in an area with tremendous ARV and rent potential. Kitchen walks out to deck and flat yard. Large rooms. Great location, just minutes from OTR and downtown Cincinnati.
-
2014-10-31soldstatus $43,000
-
2014-09-20$45,500
-
2010-01-27historical
-
2009-12-15$39,900
-
2005-03-30soldstatus $35,000
-
2005-01-05$39,900
-
2005-01-01historical
-
2004-11-29$39,900
-
2004-11-29historical
-
2004-08-27$50,500
ⓘ Source: listings_history table (triggers on properties + properties_extension) + one-shot
backfill from property_details.listing_events for pre-trigger history.
Tax reassessment forecast OH · Partial reset (capped growth)
- Current annual tax
- $2,402 · $200/mo
- Projected year-2 tax
- $3,377 · $281/mo
- Expected delta
- +$975/yr (+$81/mo · 40.6%)
ⓘ Screening estimate from a state-policy table — verify with the county assessor before closing.
Climate risk First Street
- Flood 1/10 Low FEMA zone X (unshaded) · 0% chance over 30 yrs
- Wildfire 1/10 Low
- Heat 4/10 Moderate 7 d/yr ≥103°F today · 17 d/yr by 30 yrs out
- Wind 2/10 Low 100% chance of damaging wind over 30 yrs
- Air quality 3/10 Moderate 2 unhealthy d/yr today · 3 by 30 yrs out
Nearby sold comps map
Loading sold comps map…
Walkable amenities ~0.75 mi
Loading nearby amenities…
Taxation est. · year 1
- Rental income
- $34,782
- − Mortgage interest
- −$15,628
- − Property taxes
- −$2,402
- − Insurance
- −$1,395
- − Repairs & maintenance
- −$2,783
- − Management
- −$2,783
- − Depreciation
- −$8,116
- Taxable income
- $1,675
- Est. tax owed @ 24.0%
- −$402
- After-tax cash flow
- $5,721/yr
For passive investors: Depreciation is non-cash, so a rental often shows a tax loss while cash-flowing — sheltering income. Rental losses are passive: they offset passive income freely, and up to $25,000/yr can offset ordinary (W-2) income if you actively participate and your MAGI is under $100k (phasing out to $0 by $150k); unused losses carry forward. On sale, claimed depreciation is recaptured at up to 25%, and gains may owe capital-gains tax (a 1031 exchange can defer both). Figures are a year-1 estimate at your 24.0% rate — not tax advice; consult a CPA.
Schools (NCES district)
- District
- Cincinnati Public Schools
- NCES district ID
- 3904375
- Math proficiency
- 25% ▼ -19.00%
- Reading proficiency
- 36% ▼ -14.00%
- Median HH income
- $35,743
- Composite
- 25.21/100
- National rank
- #7508
- State rank
- #581 of 656 in OH
Livability — Cincinnati
- Score
- 80/100
- State rank
- #130
- US rank
- #1856
Category grades
Schools grade is shown separately in the Schools card above.
Census & demographics
- Census place
- Cincinnati, OH
- County
- Hamilton County · 701,295 people
- City population
- 505,555
- Metro
- Cincinnati, OH-KY-IN
- Population (ZIP)
- 20,012
- Household income
- $35,657
- Rent vs Own
- Severe rent burden
- 2461.0
Population outlook (Hamilton County) Hauer SSP2
- Today (2025)
- 826,054 people
- By 2030
- 830,947 · +0.6%
- By 2040
- 832,319 · +0.8%
- By 2050
- 822,428 · -0.4%
- By 2075
- 788,688 · -4.5%
- By 2100
- 710,674 · -14.0%
Race, ethnicity, and origin ACS 2023
- Neighborhood character
- Predominantly White (67%)
- Race & ethnicity
- White 67% Black 16% Asian 7% Two or more races 6% Hispanic / Latino 4%
- Common ancestry
- Romanian 3% Italian 2% Slovak 1%
- Foreign-born
- 10% · China, Canada
- Languages at home
- 88% English-only · Chinese 3% Spanish 2% Other Indo-European 2%
Political lean MEDSL · Hamilton
- 2024 margin
- D (+14.9) · D 57.0% · R 42.1%
- 2008→2024 swing
- +7.9pp toward D · 2008: 7.0pp · 2024: 14.9pp
- All cycles
- 2024: D+14.9 2020: D+15.9 2016: D+9.5 2012: D+4.9 2008: D+7.0
Not yet ingested
- Civics
- —
Market trends
- HPI YoY
- ▼ -134.46%
- Current HPI
- 340.1262
- Rent YoY
- ▲ 2.07%
- Metro
- Cincinnati, OH-KY-IN
- State GDP YoY
- ▲ 1.98%
- F500 in state
- 48
Industry mix (Fortune 500 HQ in OH)
| Industry | F500 HQs | Revenue |
|---|---|---|
| Insurance | 3 | $145B |
|
||
| Industrial Machinery | 3 | $49B |
|
||
| Financial Services | 3 | $24B |
|
||
| Consumer Goods | 2 | $93B |
|
||
| Aerospace / Defense | 2 | $47B |
|
||
| Utilities | 2 | $33B |
|
||
Price history
+452.5% since first listed23 events — show timeline
- 2026-05-22 Price Changed $279,000 Cincy MLS
- 2026-05-20 Price Changed $289,000 Cincy MLS
- 2026-04-28 Price Changed $299,900 Cincy MLS
- 2026-04-06 Price Changed $305,000 Cincy MLS
- 2026-03-24 Listed $315,000 Cincy MLS
- 2024-03-14 Sold (Public Records) $171,000 Public Records
- 2024-02-23 Sold (MLS) $171,000 Cincy MLS
- 2024-02-23 Sold (MLS) $171,000 Dayton MLS
- 2024-02-23 Sold (MLS) $171,000 Dayton MLS
- 2024-01-26 Pending — Cincy MLS
- 2024-01-26 Contingent — Dayton MLS
- 2024-01-17 Listed $169,900 Cincy MLS
- 2024-01-17 Listed $169,900 Dayton MLS
- 2014-10-31 Sold (MLS) $43,000 Cincy MLS
- 2014-09-20 Listed $45,500 Cincy MLS
- 2010-01-27 Listing Removed — Cincy MLS
- 2009-12-15 Listed $39,900 Cincy MLS
- 2005-03-30 Sold (MLS) $35,000 Cincy MLS
- 2005-01-05 Listed $39,900 Cincy MLS
- 2005-01-01 Listing Removed — Cincy MLS
- 2004-11-29 Listing Removed — Cincy MLS
- 2004-11-29 Listed $39,900 Cincy MLS
- 2004-08-27 Listed $50,500 Cincy MLS
Property tax history
+9.2%/yrLatest (2025): $2,402 · +0.1% YoY. Source: county tax records.
Cash-flow waterfall
monthlySold comps — $/sqft
last 12 mo · ≤1 miLoading sold comps…