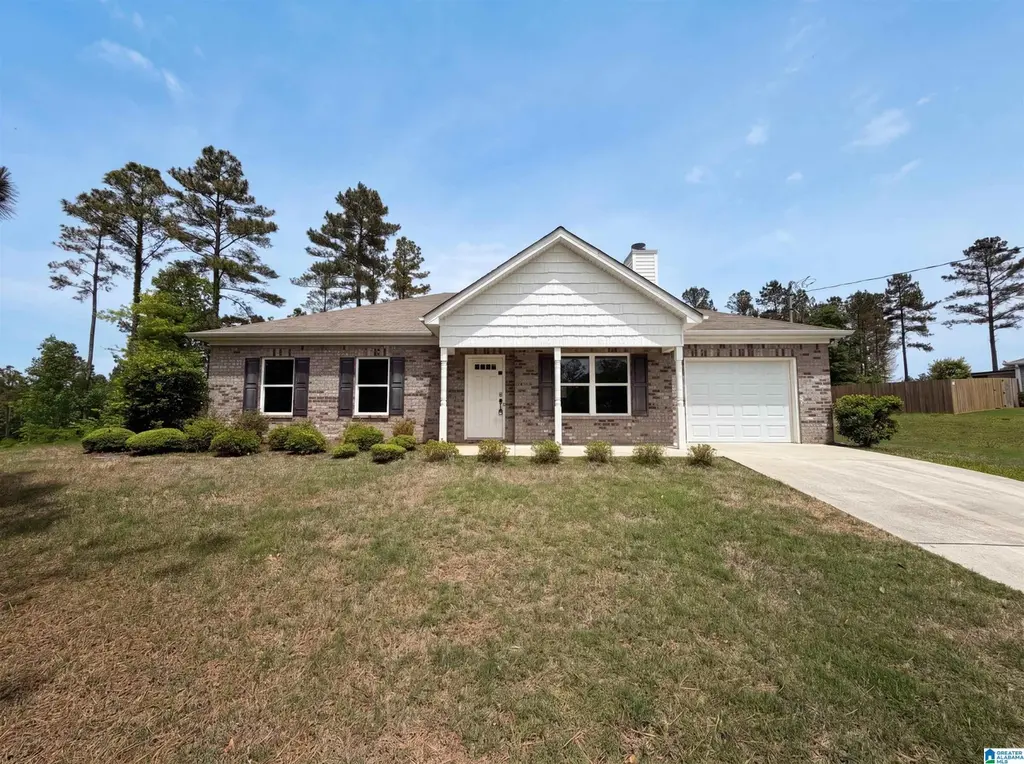
700 Magnolia Crest Ct · Margaret, AL
Flood risk 1/10 · Minimal
- FEMA flood zone
- X (unshaded)
- Chance of flooding over 30 yrs
- 0.0%
- Est. flood insurance / yr
- $507 – $1,088
Fire risk 5/10 · Moderate
- Est. fire insurance / yr
- $916 – $1,700
Heat risk 6/10 · Moderate
- Hot days now (above 105°F)
- 7 days/yr
- Hot days in 30 yrs
- 19 days/yr
Wind risk 6/10 · Moderate
- Chance of severe wind over 30 yrs
- 27.0%
Air-quality risk 4/10 · Minor
- Unhealthy air days now
- 3 days/yr
- Unhealthy air days in 30 yrs
- 7 days/yr
Risk factors via First Street. Map © Google.
Why this score? — see what drove the D grade
The composite is a weighted blend of 9 inputs, each scored 0–100. Each bar is that input's sub-score; the figure is the points it added to the 100-point composite (weight × sub-score).
- Cash flow +14.8/30.0
- ARV discount +8.7/15.0
- DSCR +4.5/10.0
- Schools +3.2/10.0
- Livability +3.2/5.0
- 1% rule +2.9/10.0
- Rent growth +2.6/5.0
- Condition / age +2.5/5.0
- Appreciation +0.0/10.0
$219,000
🖨 Deal sheet (PDF) 📄 Offer letter ✓ Due diligence
Listing remarks MLS
Great one level home on 1+/-ac lot. 3 bedroom and 2 baths with 1 car main level garage. Low maintenance brick & vinyl.
Key facts
- Double sinks
- Covered patio
- Welcoming fireplace
Tags
Property features AI
Finance
- Other: Lot size approximately 0.96 acres; Subdivision: MAGNOLIA LAKE
- HOA & community: Annual association fee of $275 (fees include other); Association fee paid yearly
Exterior
- Parking: Attached front-entry garage with 1 garage space
- Utilities: Public water; Septic sewer; Electric water heater; Internet availability unknown
- Home design: Existing construction; Brick-over-foundation and other siding; Slab foundation
- Construction: Brick over foundation; Other siding
- Exterior features: No pool, patio, decks, or garden/patio; Not waterfront; Flood zone: No
Interior
- Kitchen: Solid surface countertops; Dishwasher (built-in); Microwave (built-in); Electric stove
- Bedrooms: Multiple bedrooms on main level
- Flooring: Hardwood laminate floors
- Bathrooms: Two full bathrooms; Separate shower
- Heating & cooling: Gas heating; Central electric cooling
- Interior features: Smooth ceilings; Tile fireplace in the den; One gas fireplace
- Laundry & utility: Laundry on main level; Washer hookup; Electric dryer hookup; Pull-down attic
Neighborhood map
What this means for you Summary
Snapshot
- This is a 3-bed/1.0-bath single-family listed at $219k.
Deal economics
- At list price, monthly cash flow is $59 ($714/yr) — positive.
- The deal already cash-flows at list — no discount required.
- To meet the 1% rule (rent ≥ 1% of price), the offer needs to be $172k (21.3% below list).
- Recommended offer: $172k (21.3% below list) — sets the bar for 1% rule.
- Cap rate 6.6% vs local median 4.6% in Margaret — top-decile yield for the area; either an underpriced asset or a hidden risk that comps aren't pricing in. Stress-test before assuming the spread holds.
Location & tenants
- Location reads 64/100 on livability (#166 in AL) — a middle-class / working-renter tenant base. Strengths: crime A+, cost of living A+, housing A+; Watch: amenities F, commute F, health & safety F.
- St Clair County (rural): math 21% / reading 52% proficiency, ranked #33 of 129 in AL (top 26%) — families likely to look elsewhere, expect single-tenant / working-renter base with shorter leases.
- Zoned schools: Odenville Elementary School (436 students, 67% FRL); Moody Middle School (math 20% / reading 61%, grade F, #56 of 257 statewide, top 22%, 524 students, 61% FRL); Saint Clair County High School (math 17% / reading 22%, grade F, #169 of 305 statewide, top 59%, 622 students, 58% FRL) — zoned schools average 62% FRL vs 41% district-wide (21 pts higher); higher-poverty schools than district average — tighter screening recommended.
- Market conditions: Rents flat; 299 active listings in the ZIP; 7 comparable units currently listed for rent nearby; rentals at typical pace (median 21d on market — plan ~3-4 weeks tenant-placement turnaround); 557 units permitted in St. Clair County in 2024 (0 in 5+ unit buildings).
Forward outlook
- Local home prices are declining (-3.0%/yr); year-one equity from $2k of loan paydown is wiped out by about $7k of value loss. Plan a longer hold.
- St. Clair County population projected at +11% by 2050 — modest demand growth; plan on rents tracking national, not racing it.
Negotiation context
- It's been on market 42 days — a 3% lower offer ($212k) is reasonable based on typical stale-listing flexibility.
- 2 sale attempts since 8y ago; this cycle's ask has dropped $16k (7%) from the opening price — seller is motivated, your offer sets the floor, not the list.
Risks & watch-outs
- Climate carrying-cost: major wind risk, 27% chance of damaging wind over 30y; moderate wildfire risk; extreme-heat days projected 7→19/yr by 2055 (HVAC capex compounding) — expect insurance premiums to compound above CPI over the hold.
Questions for the listing agent
- It's been on market 42 days. Have you received any prior offers? Is the seller open to a 21% concession, seller financing, or rate buy-down credit?
- What does the HOA fee cover, when was the last increase, and are there any pending special assessments or reserve-fund shortfalls?
- Is there a deadline driving the sale (1031 exchange, divorce, estate, relocation)? That informs how much negotiation room exists.
- The area grade is low — what's the realistic commute time and amenity access for the typical tenant pool here? Any planned neighborhood developments (good or bad) we should know about?
- What's the average days-on-market for RENTAL listings here right now (not sales)? A rising rental-DOM trend means longer vacancies and softer asking-rent achievability than the comps imply.
- What's the recent tenant-quality profile in this submarket — average credit score on applications, eviction rate, late-payment / NSF rate, and stable-employment percentage? A property-management company in the area should have these aggregated.
- How much new for-sale + rental construction is in the pipeline within 1–3 miles? Heavy new supply typically softens prices + rents 12–24 months out; constrained supply supports both.
Investment metrics
- 1% rule
- 0.79% ✗
- Cap rate
- 6.62%
- Cash-on-cash
- 1.16%
- DSCR
- 1.05
- GRM
- 10.6
CMA / ARV
- ARV (on-the-fly)
- $224,917
- Comps found
- 12
Show comp detail 12 sales within ~0.75 mi
| Address | Dist | Beds/Ba | Sqft | Sold | Price | $/sf | Match |
|---|---|---|---|---|---|---|---|
| 475 Americana Dr | 0.31mi | 3/2.0 | 1,392 (-0%) | 2mo | $219,000 | $157 | 80 |
| 565 Magnolia Crest Ct | 0.11mi | 3/2.0 | 1,336 (-4%) | 9mo | $225,000 | $168 | 76 |
| 503 Kincaid Cove Ln | 0.41mi | 3/2.0 | 1,468 (+5%) | 2mo | $200,000 | $136 | 67 |
| 125 Rockwell Cir | 0.28mi | 3/2.0 | 1,512 (+8%) | 5mo | $235,000 | $155 | 65 |
| 835 Magnolia Crest Ln | 0.27mi | 3/3.0 | 1,475 (+6%) | 8mo | $245,000 | $166 | 63 |
| 3020 Middlebrooke Xing | 0.68mi | 3/2.0 | 1,355 (-3%) | 1mo | $217,484 | $161 | 59 |
| 834 Kent Dr | 0.33mi | 4/2.0 (+1) | 1,262 (-10%) | 1mo | $220,000 | $174 | 58 |
| 3030 Middlebrooke Xing | 0.67mi | 3/2.0 | 1,446 (+4%) | 1mo | $237,850 | $164 | 58 |
| 532 Kincaid Cove Ln | 0.41mi | 2/2.0 (-1) | 1,287 (-8%) | 3mo | $210,000 | $163 | 56 |
| 3040 Middlebrooke Xing | 0.66mi | 3/2.0 | 1,472 (+5%) | 1mo | $235,000 | $160 | 56 |
| 555 Kincaid Cove Ln | 0.37mi | 4/2.0 (+1) | 1,496 (+7%) | 8mo | $194,500 | $130 | 55 |
| 340 Hathaway Ln | 0.41mi | 2/2.0 (-1) | 1,287 (-8%) | 6mo | $185,000 | $144 | 54 |
Match score weights: distance 35% · size 25% · config 20% · recency 20%. Top-matched comps best support the ARV.
Projected returns pro-forma
-3.0% appreciation · 0.49% rent growth · sell at horizon
- IRR
- -17.0%
- Equity multiple
- 0.41×
- Total profit
- $-36,047
- Equity at exit
- $32,654
- IRR
- -13.5%
- Equity multiple
- 0.29×
- Total profit
- $-43,497
- Equity at exit
- $18,935
Cash invested: $61,320 (down + closing). Projections, not guarantees.
Landlord ↔ Tenant lean methodology
- Overall (STATE)
- 90 Strongly Landlord-Friendly
- State Alabama
- 90 Strongly Landlord-Friendly · R+15
- County
- — inherits STATE
- City
- — inherits STATE
ZIP-level market 35120
- Home prices YoY
- -17.9%
- Rents YoY
- 0.5%
- Active inventory
- 299
- Price-to-rent
- 10.6×
Monthly cashflow live
- Estimated rent
- $1,723 high interval (Pro) →
- Mortgage (P&I)
- −$1,148
- Tax from tax record
- −$39 /mo · $465/yr
- Insurance
- −$91
- HOA
- −$23
- Vacancy / Maint / Mgmt
- −$362
- Net cashflow
- $59
Break-even live
Sensitivity live
| Price | -10% $183 | -5% $121 | +0% $59 | +5% $-2 | +10% $-327 |
|---|---|---|---|---|---|
| Rent | -10% $-77 | -5% $-9 | +0% $59 | +5% $128 | +10% $196 |
| Rate | -1.0pp $170 | -0.5pp $115 | base $59 | +0.5pp $3 | +1.0pp $-55 |
UW: 25.0% down · 7.5% · 30yr · 1.5% tax · 5.0% vac · 8.0% maint · 8.0% mgmt
Financing live
Cash to close
- Down payment
- $54,750
- Closing costs
- $6,570
- Reserves months
- —
- Total cash needed
- —
Loan-product check · same deal, 3 products live
Conventional
25% down · 7.5% · 30yr
- Down + closing
- —
- Monthly P&I
- —
- Monthly cashflow
- —
- DSCR
- —
- Eligible?
- —
Personal DTI + credit; lowest rate.
DSCR
20% down · 8.5% · 30yr
- Down + closing
- —
- Monthly P&I
- —
- Monthly cashflow
- —
- DSCR
- —
- Eligible?
- —
No personal income docs; deal must DSCR.
Hard money
10% down · 12.0% · 12mo
- Down + closing
- —
- Monthly P&I
- —
- Monthly cashflow
- —
- DSCR
- —
- Eligible?
- —
Short-term bridge; refi at stabilization.
Rent comps 7 comps
| Address | Beds | Baths | Sqft | Rent | $/sqft | DOM | Units | Dist |
|---|---|---|---|---|---|---|---|---|
| 819 Kent Dr Odenville, AL | 3.0 | 2.0 | 1106 | $1,475 | $1.33 | 25d | 1 | 0.27mi |
| 814 Kent Dr Odenville, AL | 3.0 | 2.0 | 1450 | $1,599 | $1.10 | 5d | 1 | 0.29mi |
| 830 Kent Dr Odenville, AL | 3.0 | 2.0 | 1106 | $1,480 | $1.34 | 25d | 1 | 0.31mi |
| 245 Hathaway Ln Odenville, AL | 3.0 | 2.0 | 1497 | $1,661 | $1.11 | 21d | 1 | 0.33mi |
| 860 Kent Dr Odenville, AL | 3.0 | 2.0 | 1081 | $1,475 | $1.36 | 23d | 1 | 0.34mi |
| 2120 W Middlebrooke Xing Unit 1 Odenville, AL | 3.0 | 2.0 | 1472 | $1,500 | $1.02 | 5d | 1 | 0.80mi |
| 1115 Brookhaven Dr Odenville, AL | 3.0 | 2.0 | 1209 | $1,623 | $1.34 | 3d | 1 | 0.99mi |
HOA detail
- Monthly dues
- $23 · $276/yr
Listing history 15 events
-
2026-06-15status $219,000 Pending 42 DOM
-
2026-06-15days on market $219,000 Active 42 DOM
-
2026-06-13pricedays on market $219,000 Active 40 DOM
-
2026-06-10days on market $230,000 Active 37 DOM
-
2026-06-09days on market $230,000 Active 36 DOM
-
2026-06-08days on market $230,000 Active 35 DOM
-
2026-06-07days on market $230,000 Active 34 DOM
-
2026-06-03days on market $230,000 Active 30 DOM
-
2026-06-02days on market $230,000 Active 29 DOM
-
2026-06-01days on market $230,000 Active 28 DOM
-
2026-05-31days on market $230,000 Active 27 DOM
-
2026-05-04$235,000 Active
-
2026-04-23soldstatus $235,000
-
2018-03-16soldstatus $167,522 124-char remark
Show marketing remark (124 chars)
Great one level home on 1+/-ac lot. 3 bedroom and 2 baths with 1 car main level garage. Low maintenance brick & vinyl.
-
2018-01-15$166,521 124-char remark
Show marketing remark (124 chars)
Great one level home on 1+/-ac lot. 3 bedroom and 2 baths with 1 car main level garage. Low maintenance brick & vinyl.
ⓘ Source: listings_history table (triggers on properties + properties_extension) + one-shot
backfill from property_details.listing_events for pre-trigger history.
Tax reassessment forecast AL · Resets to sale price
- Current annual tax
- $465 · $39/mo
- Projected year-2 tax
- $898 · $75/mo
- Expected delta
- +$433/yr (+$36/mo · 93.0%)
ⓘ Screening estimate from a state-policy table — verify with the county assessor before closing.
Climate risk First Street
- Flood 1/10 Low FEMA zone X (unshaded) · 0% chance over 30 yrs
- Wildfire 5/10 Major
- Heat 6/10 Major 7 d/yr ≥105°F today · 19 d/yr by 30 yrs out
- Wind 6/10 Major 27% chance of damaging wind over 30 yrs
- Air quality 4/10 Moderate 3 unhealthy d/yr today · 7 by 30 yrs out
Nearby sold comps map
Loading sold comps map…
Walkable amenities ~0.75 mi
Loading nearby amenities…
Taxation est. · year 1
- Rental income
- $20,673
- − Mortgage interest
- −$12,267
- − Property taxes
- −$465
- − Insurance
- −$1,095
- − Repairs & maintenance
- −$1,654
- − Management
- −$1,654
- − HOA
- −$276
- − Depreciation
- −$6,371
- Taxable loss
- −$3,109
- Est. tax savings @ 24.0%
- +$746
- After-tax cash flow
- $1,460/yr
For passive investors: Depreciation is non-cash, so a rental often shows a tax loss while cash-flowing — sheltering income. Rental losses are passive: they offset passive income freely, and up to $25,000/yr can offset ordinary (W-2) income if you actively participate and your MAGI is under $100k (phasing out to $0 by $150k); unused losses carry forward. On sale, claimed depreciation is recaptured at up to 25%, and gains may owe capital-gains tax (a 1031 exchange can defer both). Figures are a year-1 estimate at your 24.0% rate — not tax advice; consult a CPA.
Schools (NCES district)
- District
- St Clair County
- NCES district ID
- 0103062
- Math proficiency
- 21% ▼ -34.00%
- Reading proficiency
- 52% ▬ 0.00%
- Median HH income
- $53,324
- Composite
- 31.79/100
- National rank
- #5887
- State rank
- #33 of 129 in AL
Livability — Margaret
- Score
- 64/100
- State rank
- #166
- US rank
- #14543
Category grades
Schools grade is shown separately in the Schools card above.
Census & demographics
- County
- Saint Clair County · 54,404 people
- City population
- 71
- Metro
- Birmingham-Hoover, AL
- Population (ZIP)
- 17,730
- Household income
- $74,352
- Rent vs Own
- Severe rent burden
- 109.0
Population outlook (St. Clair County) Hauer SSP2
- Today (2025)
- 94,158 people
- By 2030
- 97,008 · +3.0%
- By 2040
- 101,615 · +7.9%
- By 2050
- 104,537 · +11.0%
- By 2075
- 109,350 · +16.1%
- By 2100
- 106,785 · +13.4%
Race, ethnicity, and origin ACS 2023
- Neighborhood character
- Predominantly White (87%)
- Race & ethnicity
- White 87% Black 8% Two or more races 4% Hispanic / Latino 2%
- Common ancestry
- Serbian 2% Slovak 2% Lithuanian 2%
- Foreign-born
- 0%
- Languages at home
- 99% English-only · Spanish 1%
Political lean MEDSL · St. Clair
- 2024 margin
- Solid R (+64.1) · D 17.6% · R 81.7%
- 2008→2024 swing
- -0.9pp no change · 2008: -63.2pp · 2024: -64.1pp
- All cycles
- 2024: R+64.1 2020: R+64.0 2016: R+68.6 2012: R+66.1 2008: R+63.2
Not yet ingested
- Civics
- —
Market trends
- HPI YoY
- ▼ -38.39%
- Current HPI
- 175.5104
- Rent YoY
- ▲ 0.49%
- Metro
- Birmingham-Hoover, AL
- State GDP YoY
- ▲ 2.94%
- F500 in state
- 4
Industry mix (Fortune 500 HQ in AL)
| Industry | F500 HQs | Revenue |
|---|---|---|
| Financial Services | 1 | $8B |
|
||
| Healthcare | 1 | $5B |
|
||
Price history
+41.1% since first listed4 events — show timeline
- 2026-05-04 Listed $235,000 Greater Alabama MLS
- 2026-04-23 Sold (Public Records) $235,000 Public Records
- 2018-03-16 Sold (MLS) $167,522 Greater Alabama MLS
- 2018-01-15 Listed $166,521 Greater Alabama MLS
Cash-flow waterfall
monthlySold comps — $/sqft
last 12 mo · ≤1 miLoading sold comps…