 Duplex
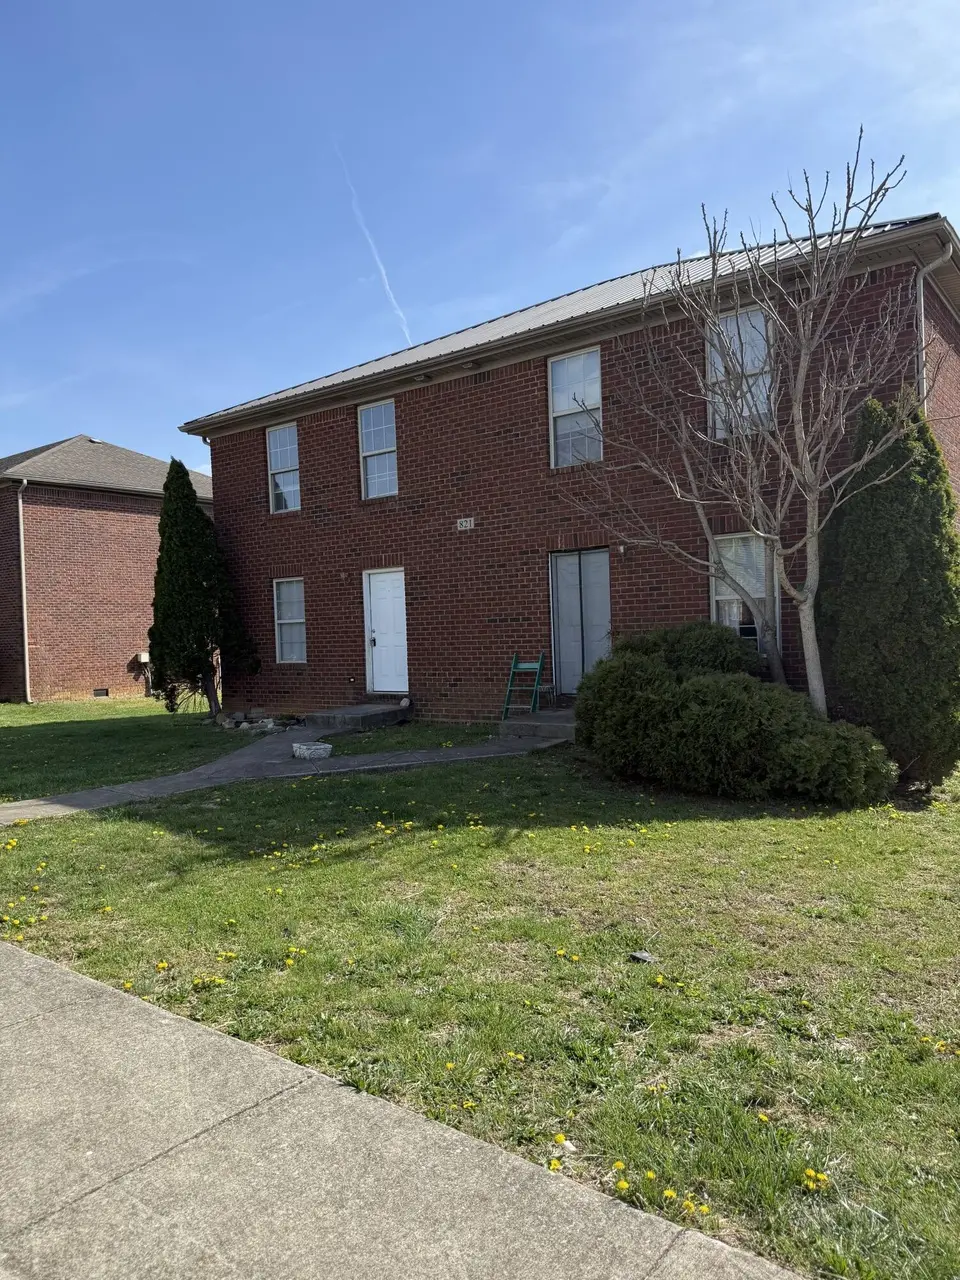
821 Ridgewood Dr Unit 1-2 · Berea, KY
Flood risk 1/10 · Minimal
- FEMA flood zone
- X (unshaded)
- Chance of flooding over 30 yrs
- 0.0%
- Est. flood insurance / yr
- $507 – $1,088
Fire risk 5/10 · Moderate
- Est. fire insurance / yr
- $839 – $1,559
Heat risk 4/10 · Minor
- Hot days now (above 102°F)
- 7 days/yr
- Hot days in 30 yrs
- 20 days/yr
Wind risk 2/10 · Minimal
- Chance of severe wind over 30 yrs
- 4.0%
Air-quality risk 1/10 · Minimal
- Unhealthy air days now
- 0 days/yr
- Unhealthy air days in 30 yrs
- 0 days/yr
Risk factors via First Street. Map © Google.
Why this score? — see what drove the D grade
The composite is a weighted blend of 9 inputs, each scored 0–100. Each bar is that input's sub-score; the figure is the points it added to the 100-point composite (weight × sub-score).
- Cash flow +14.2/30.0
- ARV discount +7.5/15.0
- DSCR +4.3/10.0
- 1% rule +4.0/10.0
- Livability +3.8/5.0
- Condition / age +3.8/5.0
- Schools +3.3/10.0
- Rent growth +2.5/5.0
- Appreciation +0.0/10.0
$299,999
🖨 Deal sheet (PDF) 📄 Offer letter ✓ Due diligence
Multi-family units
County records classify this as Multi-Family (2-4 Unit). Listing-text estimate: 2 units. confirmed
Listing remarks
Located just off of I-75, One of the few three bedroom investment properties in Beaumont Subdivision. Property improvements done over the past few years. New metal roof in 2023, new carpeting and flooring 2023 in one unit and 2026 other unit. Great location and units have always been easy to rent.
Key facts
- Metal roof
- New carpeting
- New flooring
Tags
Neighborhood map
What this means for you Summary
Snapshot
- This is a 2 × 3-bed/2.5-bath units multifamily listed at $300k. Condition is rated good.
Deal economics
- At list price, monthly cash flow is $51 ($613/yr) — positive. Per door: $26/mo.
- The deal already cash-flows at list — no discount required.
- To meet the 1% rule (rent ≥ 1% of price), the offer needs to be $269k (10.4% below list).
- Recommended offer: $269k (10.4% below list) — sets the bar for 1% rule.
- Cap rate 6.5% vs local median 3.1% in Berea — top-decile yield for the area; either an underpriced asset or a hidden risk that comps aren't pricing in. Stress-test before assuming the spread holds.
Location & tenants
- Location reads 75/100 on livability (#104 in KY, #4,354 nationally) — a middle-class / working-renter tenant base. Strengths: crime A+, cost of living A+, health & safety A+; Watch: employment D, amenities F, commute F.
- Madison County (town): math 31% / reading 47% proficiency, ranked #35 of 165 in KY (top 21%) — families likely to look elsewhere, expect single-tenant / working-renter base with shorter leases.
- Zoned schools: Shannon Johnson Elementary School (math 44% / reading 55%, grade D, #100 of 676 statewide, top 16%, 466 students, 50% FRL); Foley Middle School (math 23% / reading 51%, grade F, #80 of 217 statewide, top 41%, 445 students, 59% FRL); Madison Southern High School (math 32% / reading 42%, grade F, #58 of 254 statewide, top 27%, 1,210 students, 50% FRL).
- Market conditions: 206 active listings in the ZIP; 453 units permitted in Madison County in 2024 (64 in 5+ unit buildings).
- At $2,689/mo this rent would consume 52% of the median local household income ($62k/yr) (locally 685% of renters already pay >50% of income on rent) — very limited rent-growth headroom before tenants either downsize or default.
Forward outlook
- Local home prices are declining (-3.0%/yr); year-one equity from $2k of loan paydown is wiped out by about $9k of value loss. Plan a longer hold.
- Madison County population projected at +28% by 2050 — long-run rental-demand tailwind backs the buy-and-hold thesis.
Negotiation context
- It's been on market 45 days — a 3% lower offer ($291k) is reasonable based on typical stale-listing flexibility.
- 2 sale attempts with the ask held roughly flat each time — persistent listings suggest the price (not the market) is what's stuck; bring a comps-based counter.
Risks & watch-outs
- Climate carrying-cost: moderate wildfire risk — expect insurance premiums to compound above CPI over the hold.
Questions for the listing agent
- It's been on market 45 days. Have you received any prior offers? Is the seller open to a 10% concession, seller financing, or rate buy-down credit?
- Can we see the unit-by-unit rent roll, current vacancy, and any below-market leases? What's the average tenancy length?
- What capital expenditures (roof, boiler, parking lot, exteriors) have been made in the last 5 years, and what's planned in the next 2?
- Is there a deadline driving the sale (1031 exchange, divorce, estate, relocation)? That informs how much negotiation room exists.
- The area grade is low — what's the realistic commute time and amenity access for the typical tenant pool here? Any planned neighborhood developments (good or bad) we should know about?
- What's the average days-on-market for RENTAL listings here right now (not sales)? A rising rental-DOM trend means longer vacancies and softer asking-rent achievability than the comps imply.
- What's the recent tenant-quality profile in this submarket — average credit score on applications, eviction rate, late-payment / NSF rate, and stable-employment percentage? A property-management company in the area should have these aggregated.
- How much new apartment / multifamily construction is in the pipeline within 1–3 miles? Heavy new supply (>2% of stock underway) typically softens rents 12–24 months out; light construction supports rent growth.
Investment metrics
- 1% rule
- 0.90% ✗
- Cap rate
- 6.50%
- Cash-on-cash
- 0.73%
- DSCR
- 1.03
- GRM
- 9.3
CMA / ARV
No comps found within radius.
Projected returns pro-forma
-3.0% appreciation · 3.0% rent growth · sell at horizon
- IRR
- -15.1%
- Equity multiple
- 0.46×
- Total profit
- $-45,319
- Equity at exit
- $44,731
- IRR
- -6.5%
- Equity multiple
- 0.58×
- Total profit
- $-35,108
- Equity at exit
- $25,938
Cash invested: $84,000 (down + closing). Projections, not guarantees.
Landlord ↔ Tenant lean methodology
- Overall (STATE)
- 83 Strongly Landlord-Friendly
- State Kentucky
- 83 Strongly Landlord-Friendly · R+16
- County
- — inherits STATE
- City
- — inherits STATE
ZIP-level market 40403
- Home prices YoY
- -15.7%
- Active inventory
- 206
- Price-to-rent
- 18.6×
Monthly cashflow live
- Estimated rent
- $2,689 high interval (Pro) →
- Mortgage (P&I)
- −$1,573
- Tax est. 1.5%
- −$375 /mo · $4,500/yr
- Insurance
- −$125
- HOA
- −$0
- Vacancy / Maint / Mgmt
- −$565
- Net cashflow
- $51
Break-even live
Sensitivity live
| Price | -10% $258 | -5% $155 | +0% $51 | +5% $-53 | +10% $-156 |
|---|---|---|---|---|---|
| Rent | -10% $-161 | -5% $-55 | +0% $51 | +5% $157 | +10% $264 |
| Rate | -1.0pp $202 | -0.5pp $127 | base $51 | +0.5pp $-27 | +1.0pp $-106 |
2-unit breakdown (identical units grouped — click to expand)
| Units | Beds | Baths | Est. rent |
|---|---|---|---|
| 2× units | 3 | 2.5 | $2,688 |
| #1 | 3 | 2.5 | $1,344 |
| #2 | 3 | 2.5 | $1,344 |
| Total (2 units) | $2,689 | ||
UW: 25.0% down · 7.5% · 30yr · 1.5% tax · 5.0% vac · 8.0% maint · 8.0% mgmt
Financing live
Cash to close
- Down payment
- $75,000
- Closing costs
- $9,000
- Reserves months
- —
- Total cash needed
- —
Loan-product check · same deal, 3 products live
Conventional
25% down · 7.5% · 30yr
- Down + closing
- —
- Monthly P&I
- —
- Monthly cashflow
- —
- DSCR
- —
- Eligible?
- —
Personal DTI + credit; lowest rate.
DSCR
20% down · 8.5% · 30yr
- Down + closing
- —
- Monthly P&I
- —
- Monthly cashflow
- —
- DSCR
- —
- Eligible?
- —
No personal income docs; deal must DSCR.
Hard money
10% down · 12.0% · 12mo
- Down + closing
- —
- Monthly P&I
- —
- Monthly cashflow
- —
- DSCR
- —
- Eligible?
- —
Short-term bridge; refi at stabilization.
Listing history 22 events
-
2026-06-21days on market $299,999 Active 45 DOM
-
2026-06-18days on market $299,999 Active 42 DOM
-
2026-06-17days on market $299,999 Active 41 DOM
-
2026-06-16days on market $299,999 Active 40 DOM
-
2026-06-15days on market $299,999 Active 39 DOM
-
2026-06-14days on market $299,999 Active 37 DOM
-
2026-06-10days on market $299,999 Active 34 DOM
-
2026-06-09days on market $299,999 Active 33 DOM
-
2026-06-08days on market $299,999 Active 32 DOM
-
2026-06-07days on market $299,999 Active 31 DOM
-
2026-06-05days on market $299,999 Active 28 DOM
-
2026-06-03days on market $299,999 Active 27 DOM
-
2026-06-02days on market $299,999 Active 26 DOM
-
2026-06-01days on market $299,999 Active 25 DOM
-
2026-05-31days on market $299,999 Active 24 DOM
-
2026-05-31statusdays on market $299,999 Active 23 DOM
-
2026-04-22status Pending
-
2026-04-11price $299,999
-
2026-03-30$315,000 Active
-
2025-12-02historical
-
2025-10-06price $309,900
-
2025-08-27$319,900 Active
ⓘ Source: listings_history table (triggers on properties + properties_extension) + one-shot
backfill from property_details.listing_events for pre-trigger history.
Climate risk First Street
- Flood 1/10 Low FEMA zone X (unshaded) · 0% chance over 30 yrs
- Wildfire 5/10 Major
- Heat 4/10 Moderate 7 d/yr ≥102°F today · 20 d/yr by 30 yrs out
- Wind 2/10 Low 4% chance of damaging wind over 30 yrs
- Air quality 1/10 Low 0 unhealthy d/yr today · 0 by 30 yrs out
Nearby sold comps map
Loading sold comps map…
Walkable amenities ~0.75 mi
Loading nearby amenities…
Taxation est. · year 1
- Rental income
- $32,268
- − Mortgage interest
- −$16,805
- − Property taxes
- −$4,500
- − Insurance
- −$1,500
- − Repairs & maintenance
- −$2,581
- − Management
- −$2,581
- − Depreciation
- −$8,727
- Taxable loss
- −$4,427
- Est. tax savings @ 24.0%
- +$1,062
- After-tax cash flow
- $1,675/yr
For passive investors: Depreciation is non-cash, so a rental often shows a tax loss while cash-flowing — sheltering income. Rental losses are passive: they offset passive income freely, and up to $25,000/yr can offset ordinary (W-2) income if you actively participate and your MAGI is under $100k (phasing out to $0 by $150k); unused losses carry forward. On sale, claimed depreciation is recaptured at up to 25%, and gains may owe capital-gains tax (a 1031 exchange can defer both). Figures are a year-1 estimate at your 24.0% rate — not tax advice; consult a CPA.
Condition & rehab AI · 13 photos
This multi-family property is in good condition with recent updates, including a new metal roof and flooring. It is ready for immediate rental or resale with minor maintenance items.
Value-add opportunities
- Both Paint exterior trim — Enhances curb appeal and value
- Both Clean gutters — Improves drainage and property value
Renovation cost estimate screening
Value-add ROI direction
- Both Paint exterior trim — Enhances curb appeal and value ↑
- Both Clean gutters — Improves drainage and property value ↑
ⓘ Cost ranges are severity-bucket heuristics (US national rule-of-thumb). Get contractor quotes + a written scope before underwriting a rehab budget.
Schools (NCES district)
- District
- Madison County
- NCES district ID
- 2103720
- Math proficiency
- 31% ▼ -16.00%
- Reading proficiency
- 47% ▼ -14.00%
- Median HH income
- $43,590
- Composite
- 32.99/100
- National rank
- #5580
- State rank
- #35 of 165 in KY
Livability — Berea
- Score
- 75/100
- State rank
- #104
- US rank
- #4354
Category grades
Schools grade is shown separately in the Schools card above.
Census & demographics
- Census place
- Berea, KY
- County
- Madison County · 93,568 people
- City population
- 27,607
- Metro
- Richmond-Berea, KY
- Population (ZIP)
- 27,607
- Household income
- $61,771
- Rent vs Own
- Severe rent burden
- 685.0
Population outlook (Madison County) Hauer SSP2
- Today (2025)
- 99,241 people
- By 2030
- 104,927 · +5.7%
- By 2040
- 116,079 · +17.0%
- By 2050
- 127,293 · +28.3%
- By 2075
- 155,644 · +56.8%
- By 2100
- 176,488 · +77.8%
Race, ethnicity, and origin ACS 2023
- Neighborhood character
- Predominantly White (91%)
- Race & ethnicity
- White 91% Two or more races 5% Hispanic / Latino 4% Black 2%
- Common ancestry
- Italian 2% Slovak 2% Serbian 1%
- Foreign-born
- 2% · Canada
- Languages at home
- 97% English-only · Spanish 2%
Political lean MEDSL · Madison
- 2024 margin
- Solid R (+30.9) · D 33.6% · R 64.5% · Other 1.9%
- 2008→2024 swing
- -8.4pp toward R · 2008: -22.4pp · 2024: -30.9pp
- All cycles
- 2024: R+30.9 2020: R+26.8 2016: R+31.2 2012: R+28.9 2008: R+22.4
Not yet ingested
- Civics
- —
Market trends
- HPI YoY
- ▼ -53.22%
- Current HPI
- 286.6948
- Rent YoY
- —
- Metro
- Richmond-Berea, KY
- State GDP YoY
- ▲ 1.81%
- F500 in state
- 4
Industry mix (Fortune 500 HQ in KY)
| Industry | F500 HQs | Revenue |
|---|---|---|
| Healthcare | 1 | $118B |
|
||
| Food / Beverage | 1 | $7B |
|
||
Price history
-6.2% since first listed6 events — show timeline
- 2026-04-22 Pending — ImagineMLS
- 2026-04-11 Price Changed $299,999 ImagineMLS
- 2026-03-30 Listed $315,000 ImagineMLS
- 2025-12-02 Listing Removed — ImagineMLS
- 2025-10-06 Price Changed $309,900 ImagineMLS
- 2025-08-27 Listed $319,900 ImagineMLS
Cash-flow waterfall
monthlySold comps — $/sqft
last 12 mo · ≤1 miLoading sold comps…