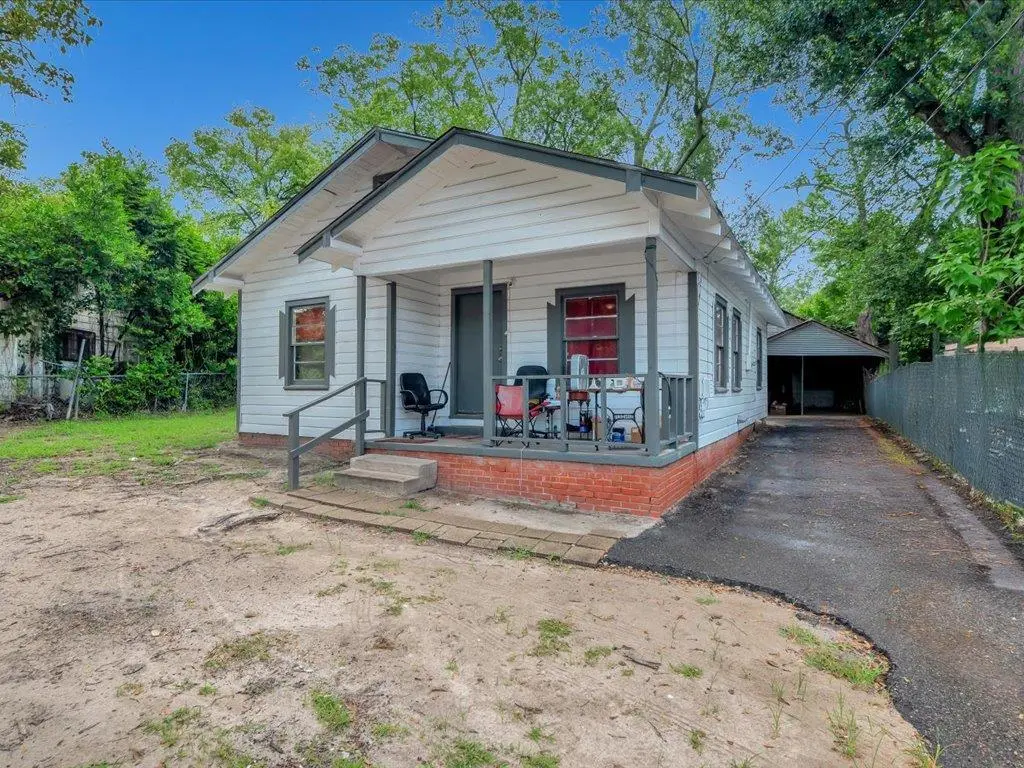
1009 W Main St · Nacogdoches, TX
Flood risk No data
- FEMA flood zone
- —
- Chance of flooding over 30 yrs
- —
- Est. flood insurance / yr
- —
Fire risk No data
- Est. fire insurance / yr
- —
Heat risk No data
- Hot days now (above threshold)
- —
- Hot days in 30 yrs
- —
Wind risk No data
- Chance of severe wind over 30 yrs
- —
Air-quality risk No data
- Unhealthy air days now
- —
- Unhealthy air days in 30 yrs
- —
Risk factors via First Street. Map © Google.
Why this score? — see what drove the B+ grade
The composite is a weighted blend of 9 inputs, each scored 0–100. Each bar is that input's sub-score; the figure is the points it added to the 100-point composite (weight × sub-score).
- Cash flow +30.0/30.0
- ARV discount +15.0/15.0
- DSCR +10.0/10.0
- 1% rule +9.8/10.0
- Livability +3.6/5.0
- Rent growth +2.5/5.0
- Condition / age +2.5/5.0
- Schools +2.3/10.0
- Appreciation +0.0/10.0
$74,000
🖨 Deal sheet (PDF) 📄 Offer letter ✓ Due diligence
Listing remarks
Only minutes from the heart of Nacogdoches, this 2-bedroom, 1-bath home offers timeless charm with modern essentials. Original hardwood floors, large windows, and a bright, open living space create an inviting atmosphere throughout. Enjoy updated electrical wiring, central A/C and heat, and a detached carport. All the comforts you need in a convenient location!
Key facts
- Large windows
- Central a/c and heat
- Detached carport
Tags
Neighborhood map
What this means for you Summary
Snapshot
- This is a 2-bed/1.0-bath single-family listed at $74k.
Deal economics
- At list price, monthly cash flow is $343 ($4k/yr) — positive.
- The deal already cash-flows at list — no discount required.
- Meets the 1% rule at list price ($1k rent vs $74k).
- Recommended offer: $67k (9.0% below list) — sets the bar for market timing.
- Cap rate 11.9% vs local median 2.3% in Nacogdoches — top-decile yield for the area; either an underpriced asset or a hidden risk that comps aren't pricing in. Stress-test before assuming the spread holds.
Location & tenants
- Location reads 72/100 on livability (#252 in TX) — a middle-class / working-renter tenant base. Strengths: cost of living A+, health & safety A+, housing A-; Watch: amenities C-, schools D, commute F.
- Nacogdoches ISD (town): math 26% / reading 30% proficiency, ranked #688 of 826 in TX (top 83%) — low school quality limits family demand, transient renter base, plan for 1-2y turnover; 72% free/reduced lunch — lower-income household profile, screen leases tightly.
- Market conditions: 118 active listings in the ZIP; 10 comparable units currently listed for rent nearby; rentals lingering (median 45d on market — plan ~5-8 weeks vacancy on turnover, expect pricing pressure); 100% of comp listings sitting > 30 days — soft ceiling on asking rent; 35 units permitted in Nacogdoches County in 2024 (0 in 5+ unit buildings).
Forward outlook
- Local home prices are declining (-3.0%/yr); year-one equity from $512 of loan paydown is wiped out by about $2k of value loss. Plan a longer hold.
- At projected returns (-3.0% appreciation + 3.0% rent growth), your $21k cash investment doubles in ~7 years — after that, you're playing with house money.
Negotiation context
- It's been on market 117 days — a 9% lower offer ($67k) is reasonable based on typical stale-listing flexibility.
- 3 sale attempts; this cycle's ask has dropped $5k (6%) from the opening price — seller is motivated, your offer sets the floor, not the list.
Risks & watch-outs
- Watch-outs: built in 1950 — expect roof / HVAC / electrical / plumbing capex.
Questions for the listing agent
- It's been on market 117 days. Have you received any prior offers? Is the seller open to a 9% concession, seller financing, or rate buy-down credit?
- Built in 1950 — when were the roof, HVAC, electrical panel, plumbing, and water heater last replaced?
- Why hasn't it sold? Are there any deal-killer items the seller is aware of (foundation, flood, title, zoning, code violations)?
- Is there a deadline driving the sale (1031 exchange, divorce, estate, relocation)? That informs how much negotiation room exists.
- Schools are D-rated, which usually means shorter tenancies and higher turnover. Who's the typical renter profile here, and what's been the actual vacancy rate?
- What's the average days-on-market for RENTAL listings here right now (not sales)? A rising rental-DOM trend means longer vacancies and softer asking-rent achievability than the comps imply.
- What's the recent tenant-quality profile in this submarket — average credit score on applications, eviction rate, late-payment / NSF rate, and stable-employment percentage? A property-management company in the area should have these aggregated.
- How much new for-sale + rental construction is in the pipeline within 1–3 miles? Heavy new supply typically softens prices + rents 12–24 months out; constrained supply supports both.
Investment metrics
- 1% rule
- 1.48% ✓
- Cap rate
- 11.86%
- Cash-on-cash
- 19.87%
- DSCR
- 1.88
- GRM
- 5.6
CMA / ARV
- ARV (median comp)
- $124,094
- List price
- $74,000
- Delta
- -40.37%
- Verdict
- UNDERPRICED
- Comps
- 2 within 2.0 mi
Projected returns pro-forma
-3.0% appreciation · 3.0% rent growth · sell at horizon
- IRR
- 12.0%
- Equity multiple
- 1.48×
- Total profit
- $9,878
- Equity at exit
- $11,034
- IRR
- 21.0%
- Equity multiple
- 2.78×
- Total profit
- $36,823
- Equity at exit
- $6,398
Cash invested: $20,720 (down + closing). Projections, not guarantees.
Landlord ↔ Tenant lean methodology
- Overall (STATE)
- 87 Strongly Landlord-Friendly
- State Texas
- 87 Strongly Landlord-Friendly · R+5
- County
- — inherits STATE
- City
- — inherits STATE
ZIP-level market 75964
- Home prices YoY
- -34.5%
- Active inventory
- 118
- Price-to-rent
- 5.6×
Monthly cashflow live
- Estimated rent
- $1,094 high interval (Pro) →
- Mortgage (P&I)
- −$388
- Tax from tax record
- −$102 /mo · $1,224/yr
- Insurance
- −$31
- HOA
- −$0
- Vacancy / Maint / Mgmt
- −$230
- Net cashflow
- $343
Break-even live
Sensitivity live
| Price | -10% $385 | -5% $364 | +0% $343 | +5% $322 | +10% $301 |
|---|---|---|---|---|---|
| Rent | -10% $257 | -5% $300 | +0% $343 | +5% $386 | +10% $429 |
| Rate | -1.0pp $380 | -0.5pp $362 | base $343 | +0.5pp $324 | +1.0pp $304 |
UW: 25.0% down · 7.5% · 30yr · 1.5% tax · 5.0% vac · 8.0% maint · 8.0% mgmt
Financing live
Cash to close
- Down payment
- $18,500
- Closing costs
- $2,220
- Reserves months
- —
- Total cash needed
- —
Loan-product check · same deal, 3 products live
Conventional
25% down · 7.5% · 30yr
- Down + closing
- —
- Monthly P&I
- —
- Monthly cashflow
- —
- DSCR
- —
- Eligible?
- —
Personal DTI + credit; lowest rate.
DSCR
20% down · 8.5% · 30yr
- Down + closing
- —
- Monthly P&I
- —
- Monthly cashflow
- —
- DSCR
- —
- Eligible?
- —
No personal income docs; deal must DSCR.
Hard money
10% down · 12.0% · 12mo
- Down + closing
- —
- Monthly P&I
- —
- Monthly cashflow
- —
- DSCR
- —
- Eligible?
- —
Short-term bridge; refi at stabilization.
Rent comps 10 comps
| Address | Beds | Baths | Sqft | Rent | $/sqft | DOM | Units | Dist |
|---|---|---|---|---|---|---|---|---|
| 900 Hackberry St Unit 912 Nacogdoches, TX | 1.0 | 1.0 | 630 | $700 | $1.11 | 44d | 1 | 0.75mi |
| 108 E Seale St Nacogdoches, TX | 1.0 | 1.0 | 550 | $650 | $1.18 | 44d | 1 | 0.76mi |
| 1000 W Seale St Unit 13 Nacogdoches, TX | 2.0 | 1.0 | 840 | $895 | $1.07 | 44d | 1 | 0.80mi |
| 216 W Starr Ave #102 Nacogdoches, TX | 3.0 | 2.0 | 1095 | $2,000 | $1.83 | 44d | 1 | 1.04mi |
| 420 Wedgewood St Nacogdoches, TX | 2.0 | 1.5 | 800 | $850 | $1.06 | 44d | 1 | 1.28mi |
| 1905 Banita St #102 Nacogdoches, TX | 2.0 | 2.0 | 875 | $1,950 | $2.23 | 44d | 1 | 1.31mi |
| 327 W College St Nacogdoches, TX | 2.0 | 2.0 | 965 | $850 | $0.88 | 44d | 1 | 1.33mi |
| 2109 Pearl St Unit E12 Nacogdoches, TX | 2.0 | 1.0 | 850 | $975 | $1.15 | 44d | 1 | 1.42mi |
| 2109 Pearl St Unit F15 Nacogdoches, TX | 3.0 | 1.5 | 939 | $1,075 | $1.14 | 44d | 1 | 1.42mi |
| 2120 Pearl St Nacogdoches, TX | 1.0 | 1.0 | 686 | $995 | $1.45 | 44d | 2 | 1.48mi |
Listing history 19 events
-
2026-06-19days on market $74,000 Active 117 DOM
-
2026-06-18days on market $74,000 Active 116 DOM
-
2026-06-17days on market $74,000 Active 115 DOM
-
2026-06-16days on market $74,000 Active 114 DOM
-
2026-06-15days on market $74,000 Active 113 DOM
-
2026-06-14days on market $74,000 Active 111 DOM
-
2026-06-13days on market $74,000 Active 110 DOM
-
2026-06-10days on market $74,000 Active 108 DOM
-
2026-06-09days on market $74,000 Active 107 DOM
-
2026-06-08days on market $74,000 Active 106 DOM
-
2026-06-07days on market $74,000 Active 105 DOM
-
2026-06-05days on market $74,000 Active 102 DOM
-
2026-06-02days on market $74,000 Active 100 DOM
-
2026-06-01days on market $74,000 Active 99 DOM
-
2026-05-31days on market $74,000 Active 98 DOM
-
2026-05-30days on market $74,000 Active 97 DOM
-
2025-12-19$79,000 Active
-
2025-12-19$79,000 Active
-
2025-07-11$79,000 Active
ⓘ Source: listings_history table (triggers on properties + properties_extension) + one-shot
backfill from property_details.listing_events for pre-trigger history.
Tax reassessment forecast TX · Resets to sale price
- Current annual tax
- $1,224 · $102/mo
- Projected year-2 tax
- $1,354 · $113/mo
- Expected delta
- +$130/yr (+$11/mo · 10.7%)
ⓘ Screening estimate from a state-policy table — verify with the county assessor before closing.
Nearby sold comps map
Loading sold comps map…
Walkable amenities ~0.75 mi
Loading nearby amenities…
Taxation est. · year 1
- Rental income
- $13,122
- − Mortgage interest
- −$4,145
- − Property taxes
- −$1,224
- − Insurance
- −$370
- − Repairs & maintenance
- −$1,050
- − Management
- −$1,050
- − Depreciation
- −$2,153
- Taxable income
- $3,131
- Est. tax owed @ 24.0%
- −$751
- After-tax cash flow
- $3,365/yr
For passive investors: Depreciation is non-cash, so a rental often shows a tax loss while cash-flowing — sheltering income. Rental losses are passive: they offset passive income freely, and up to $25,000/yr can offset ordinary (W-2) income if you actively participate and your MAGI is under $100k (phasing out to $0 by $150k); unused losses carry forward. On sale, claimed depreciation is recaptured at up to 25%, and gains may owe capital-gains tax (a 1031 exchange can defer both). Figures are a year-1 estimate at your 24.0% rate — not tax advice; consult a CPA.
Schools (NCES district)
- District
- Nacogdoches ISD
- NCES district ID
- 4832090
- Math proficiency
- 26% ▼ -12.00%
- Reading proficiency
- 30% ▼ -4.00%
- Median HH income
- $33,759
- Composite
- 22.98/100
- National rank
- #7983
- State rank
- #688 of 826 in TX
Livability — Nacogdoches
- Score
- 72/100
- State rank
- #252
- US rank
- #5962
Category grades
Schools grade is shown separately in the Schools card above.
Census & demographics
- Census place
- Nacogdoches, TX
- County
- Nacogdoches County · 53,896 people
- City population
- 53,896
- Metro
- Nacogdoches, TX
- Population (ZIP)
- 20,470
- Household income
- $56,762
- Rent vs Own
- Severe rent burden
- 711.0
Population outlook (Nacogdoches County) Hauer SSP2
- Today (2025)
- 66,553 people
- By 2030
- 66,920 · +0.6%
- By 2040
- 66,833 · +0.4%
- By 2050
- 66,462 · -0.1%
- By 2075
- 65,710 · -1.3%
- By 2100
- 62,321 · -6.4%
Race, ethnicity, and origin ACS 2023
- Neighborhood character
- Diverse neighborhood (Simpson 0.64)
- Race & ethnicity
- White 45% Hispanic / Latino 35% Black 17% Two or more races 16%
- Hispanic origin (detail)
- Mexican 32%
- Common ancestry
- Slovak 2% Portuguese 1% Lithuanian 1%
- Foreign-born
- 16% · Canada, Vietnam
- Languages at home
- 71% English-only · Spanish 29%
Political lean MEDSL · Nacogdoches
- 2024 margin
- Solid R (+38.8) · D 30.2% · R 69.0%
- 2008→2024 swing
- -11.3pp toward R · 2008: -27.5pp · 2024: -38.8pp
- All cycles
- 2024: R+38.8 2020: R+31.3 2016: R+35.4 2012: R+36.2 2008: R+27.5
Not yet ingested
- Civics
- —
Market trends
- HPI YoY
- ▼ -86.99%
- Current HPI
- 165.2321
- Rent YoY
- —
- Metro
- Nacogdoches, TX
- State GDP YoY
- ▲ 3.95%
- F500 in state
- 110
Industry mix (Fortune 500 HQ in TX)
| Industry | F500 HQs | Revenue |
|---|---|---|
| Energy | 16 | $1,198B |
|
||
| Technology | 5 | $198B |
|
||
| Engineering / Construction | 4 | $72B |
|
||
| Energy Services | 3 | $60B |
|
||
| Utilities | 3 | $41B |
|
||
| Healthcare | 2 | $330B |
|
||
Price history
+0.0% since first listed3 events — show timeline
- 2025-12-19 Listed $79,000 Deep East Texas MLS
- 2025-12-19 Listed $79,000 Deep East Texas MLS
- 2025-07-11 Listed $79,000 Deep East Texas MLS
Property tax history
+3.7%/yrLatest (2025): $1,224 · +20.7% YoY. Source: county tax records.
Cash-flow waterfall
monthlySold comps — $/sqft
last 12 mo · ≤1 miLoading sold comps…