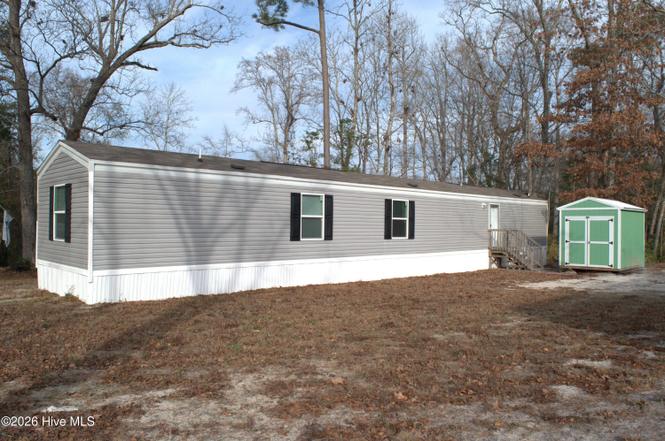
2188 Fay Cir SW · Holden Beach, NC
Flood risk 3/10 · Minor
- FEMA flood zone
- X (unshaded)
- Chance of flooding over 30 yrs
- 0.1%
- Est. flood insurance / yr
- $507 – $1,088
Fire risk 5/10 · Moderate
- Est. fire insurance / yr
- $906 – $1,684
Heat risk 9/10 · Severe
- Hot days now (above 104°F)
- 7 days/yr
- Hot days in 30 yrs
- 19 days/yr
Wind risk 8/10 · Major
- Chance of severe wind over 30 yrs
- 99.0%
Air-quality risk 2/10 · Minimal
- Unhealthy air days now
- 1 days/yr
- Unhealthy air days in 30 yrs
- 1 days/yr
Risk factors via First Street. Map © Google.
Why this score? — see what drove the C grade
The composite is a weighted blend of 9 inputs, each scored 0–100. Each bar is that input's sub-score; the figure is the points it added to the 100-point composite (weight × sub-score).
- Cash flow +28.0/30.0
- DSCR +9.9/10.0
- 1% rule +6.5/10.0
- Schools +3.9/10.0
- Livability +3.2/5.0
- Rent growth +2.5/5.0
- Condition / age +2.5/5.0
- ARV discount +0.0/15.0
- Appreciation +0.0/10.0
$174,900
🖨 Deal sheet 📄 Offer letter ✓ Due diligence
Listing remarks MLS
Take a look at this 0.32-acre lot in Ridge Forest! This property is just 4 miles from the beach and minutes to local shopping, dining and golf. With a variety of home styles allowed, including singlewide, doublewide, modular or site-built, you can finally build the home you want with the freedom to personalize it to your needs and style. Say goodbye to HOA restrictions and hello to endless outdoor living possibilities. Don't miss out on the opportunity to make this wonderful property yours today!
Key facts
- Hybrid water heater
- Recessed lighting
- No hoa
Tags
Property features AI
Finance
- Other: Lot on a private paved road; Lot dimensions: 58' x 187' x 98' x 185'; Lot size approximately 0.32 acres; Zoning: Co-R-6000; Subdivision: Ridge Forest; Directions available from Hwy 17 to Fay Cir
- Financial info: Tax amount listed separately (excluded per instructions)
- HOA & community: No association amenities
Exterior
- Parking: On-site parking; Gravel/unpaved parking
- Security: No security features listed
- Utilities: Public water; Water connected; Septic tank sewer
- Home design: Manufactured home; Residential property; One-story; Entry level on main floor; Faces unspecified direction
- Construction: Vinyl siding; Frame construction; Crawl space foundation; Built (year not specified)
- Exterior features: Shingle roof; Shed(s); Has view; No additional exterior amenities listed; No patio or porch; No fencing
Interior
- Kitchen: Dishwasher; Refrigerator; Electric water heater
- Bedrooms: 5 total rooms
- Flooring: Laminate
- Bathrooms: 2 full bathrooms
- Heating & cooling: Electric heating; Heat pump; Central air conditioning
- Interior features: Ceiling fan(s); Window coverings; Unfurnished
- Laundry & utility: Washer; Dryer; Laundry room
Neighborhood map
What this means for you Summary
Snapshot
- This is a 3-bed/2.0-bath manufactured listed at $175k.
Deal economics
- At list price, monthly cash flow is $544 ($7k/yr) — positive.
- The deal already cash-flows at list — no discount required.
- Meets the 1% rule at list price ($2k rent vs $175k).
- Recommended offer: $154k (12.0% below list) — sets the bar for market timing.
- Cap rate 10.0% vs local median 3.1% in Holden Beach — top-decile yield for the area; either an underpriced asset or a hidden risk that comps aren't pricing in. Stress-test before assuming the spread holds.
Location & tenants
- Location reads 65/100 on livability (#334 in NC) — a middle-class / working-renter tenant base. Strengths: employment A+, crime A, housing A; Watch: cost of living D, health & safety D, amenities F.
- Brunswick County Schools (rural): math 45% / reading 47% proficiency, ranked #82 of 178 in NC (top 46%) — families likely to look elsewhere, expect single-tenant / working-renter base with shorter leases.
- Zoned schools: Virginia Williamson Elem (math 50% / reading 49%, grade D, #417 of 1,410 statewide, top 32%, 502 students, 99% FRL); Cedar Grove Middle (math 30% / reading 36%, grade F, #305 of 475 statewide, top 65%, 434 students, 99% FRL); West Brunswick High (math 50% / reading 56%, grade C-, #281 of 535 statewide, top 53%, 1,526 students, 100% FRL) — zoned schools average 100% FRL vs 53% district-wide (46 pts higher); higher-poverty schools than district average — tighter screening recommended.
- Market conditions: 506 active listings in the ZIP; 6,112 units permitted in Brunswick County in 2024 (990 in 5+ unit buildings).
- This rent runs 40% of the median local income ($60k/yr) — at the standard rent-burdened threshold; future hikes will face affordability resistance.
Forward outlook
- Local home prices are declining (-3.0%/yr); year-one equity from $1k of loan paydown is wiped out by about $5k of value loss. Plan a longer hold.
- Brunswick County population projected at +36% by 2050 — long-run rental-demand tailwind backs the buy-and-hold thesis.
- At projected returns (-3.0% appreciation + 3.0% rent growth), your $49k cash investment doubles in ~9 years — after that, you're playing with house money.
Negotiation context
- It's been on market 160 days — a 12% lower offer ($154k) is reasonable based on typical stale-listing flexibility.
- 4 sale attempts since 3y ago with the ask held roughly flat each time — persistent listings suggest the price (not the market) is what's stuck; bring a comps-based counter.
- Current owner paid $32k; list at $175k implies a 438% gain — meaningful room to come down on a strong offer.
Risks & watch-outs
- Climate carrying-cost: severe wind risk, 99% chance of damaging wind over 30y; moderate wildfire risk; extreme-heat days projected 7→19/yr by 2055 (HVAC capex compounding) — expect insurance premiums to compound above CPI over the hold.
Questions for the listing agent
- It's been on market 160 days. Have you received any prior offers? Is the seller open to a 12% concession, seller financing, or rate buy-down credit?
- Why hasn't it sold? Are there any deal-killer items the seller is aware of (foundation, flood, title, zoning, code violations)?
- Is there a deadline driving the sale (1031 exchange, divorce, estate, relocation)? That informs how much negotiation room exists.
- What's the average days-on-market for RENTAL listings here right now (not sales)? A rising rental-DOM trend means longer vacancies and softer asking-rent achievability than the comps imply.
- What's the recent tenant-quality profile in this submarket — average credit score on applications, eviction rate, late-payment / NSF rate, and stable-employment percentage? A property-management company in the area should have these aggregated.
- How much new for-sale + rental construction is in the pipeline within 1–3 miles? Heavy new supply typically softens prices + rents 12–24 months out; constrained supply supports both.
Investment metrics
- 1% rule
- 1.15% ✓
- Cap rate
- 10.03%
- Cash-on-cash
- 13.34%
- DSCR
- 1.59
- GRM
- 7.2
CMA / ARV
- ARV (on-the-fly)
- $147,896
- Comps found
- 12
Show comp detail 12 sales within ~0.75 mi
| Address | Dist | Beds/Ba | Sqft | Sold | Price | $/sf | Match |
|---|---|---|---|---|---|---|---|
| 2199 Helmsman Dr SW | 0.45mi | 3/2.0 | 1,056 (-1%) | 2mo | $201,000 | $190 | 77 |
| 2152 Forest Dr SW | 0.47mi | 3/2.0 | 1,064 (0%) | 7mo | $156,000 | $147 | 72 |
| 1979 Cedar Ln SW | 0.43mi | 3/2.0 | 1,050 (-1%) | 7mo | $143,000 | $136 | 72 |
| 2486 Kirby Rd SW | 0.66mi | 3/2.0 | 1,070 (+1%) | 2mo | $130,900 | $122 | 67 |
| 2024 Crest Ln SW | 0.50mi | 2/2.0 (-1) | 1,085 (+2%) | 2mo | $115,000 | $106 | 66 |
| 1890 Vale St SW | 0.55mi | 3/2.0 | 1,049 (-1%) | 7mo | $146,000 | $139 | 66 |
| 1911 Thompson Ave SW | 0.53mi | 2/2.0 (-1) | 1,055 (-1%) | 3mo | $175,000 | $166 | 66 |
| 2180 Creekwood Ct SW | 0.33mi | 3/2.0 | 980 (-8%) | 8mo | $122,900 | $125 | 65 |
| 2426 Red Snapper St SW | 0.70mi | 3/2.0 | 1,056 (-1%) | 3mo | $135,100 | $128 | 64 |
| 2075 Gum St SW | 0.27mi | 2/2.0 (-1) | 924 (-13%) | 2mo | $105,000 | $114 | 59 |
| 2158 Forest Dr SW | 0.47mi | 3/2.0 | 1,196 (+12%) | 4mo | $217,500 | $182 | 55 |
| 2529 White Sands Dr SW | 0.71mi | 3/2.0 | 1,165 (+10%) | 7mo | $239,000 | $205 | 45 |
Match score weights: distance 35% · size 25% · config 20% · recency 20%. Top-matched comps best support the ARV.
Projected returns pro-forma
-3.0% appreciation · 3.0% rent growth · sell at horizon
- IRR
- 3.3%
- Equity multiple
- 1.13×
- Total profit
- $6,258
- Equity at exit
- $26,078
- IRR
- 12.8%
- Equity multiple
- 2.02×
- Total profit
- $49,812
- Equity at exit
- $15,122
Cash invested: $48,972 (down + closing). Projections, not guarantees.
Landlord ↔ Tenant lean methodology
- Overall (STATE)
- 85 Strongly Landlord-Friendly
- State North Carolina
- 85 Strongly Landlord-Friendly · R+3
- County
- — inherits STATE
- City
- — inherits STATE
ZIP-level market 28462
- Active inventory
- 506
- Price-to-rent
- 7.2×
Monthly cashflow live
- Estimated rent
- $2,015 medium interval (Pro) →
- Mortgage (P&I)
- −$917
- Tax from tax record
- −$58 /mo · $692/yr
- Insurance
- −$73
- HOA
- −$0
- Vacancy / Maint / Mgmt
- −$423
- Net cashflow
- $544
Break-even live
UW: 25.0% down · 7.5% · 30yr · 1.5% tax · 5.0% vac · 8.0% maint · 8.0% mgmt
Financing live
Cash to close
- Down payment
- $43,725
- Closing costs
- $5,247
- Reserves months
- —
- Total cash needed
- —
Loan-product check · same deal, 3 products live
Conventional
25% down · 7.5% · 30yr
- Down + closing
- —
- Monthly P&I
- —
- Monthly cashflow
- —
- DSCR
- —
- Eligible?
- —
Personal DTI + credit; lowest rate.
DSCR
20% down · 8.5% · 30yr
- Down + closing
- —
- Monthly P&I
- —
- Monthly cashflow
- —
- DSCR
- —
- Eligible?
- —
No personal income docs; deal must DSCR.
Hard money
10% down · 12.0% · 12mo
- Down + closing
- —
- Monthly P&I
- —
- Monthly cashflow
- —
- DSCR
- —
- Eligible?
- —
Short-term bridge; refi at stabilization.
Listing history 30 events
-
2026-06-18days on market $174,900 Active 160 DOM
-
2026-06-17days on market $174,900 Active 159 DOM
-
2026-06-16days on market $174,900 Active 158 DOM
-
2026-06-15days on market $174,900 Active 157 DOM
-
2026-06-14days on market $174,900 Active 155 DOM
-
2026-06-13days on market $174,900 Active 154 DOM
-
2026-06-10days on market $174,900 Active 152 DOM
-
2026-06-09days on market $174,900 Active 151 DOM
-
2026-06-08days on market $174,900 Active 150 DOM
-
2026-06-07days on market $174,900 Active 149 DOM
-
2026-06-05days on market $174,900 Active 146 DOM
-
2026-06-03days on market $174,900 Active 145 DOM
-
2026-06-02days on market $174,900 Active 144 DOM
-
2026-06-01days on market $174,900 Active 143 DOM
-
2026-05-31days on market $174,900 Active 142 DOM
-
2026-05-30days on market $174,900 Active 141 DOM
-
2026-04-27price $174,900
-
2026-01-09price $175,900
-
2026-01-09$174,900 Active
-
2025-10-23price $179,500
-
2025-07-24status Active
-
2025-07-02status Pending
-
2025-07-02historical
-
2025-06-27$184,900 Active
-
2025-05-28historical
-
2023-06-22soldstatus $32,500 Closed 501-char remark
Show marketing remark (501 chars)
Take a look at this 0.32-acre lot in Ridge Forest! This property is just 4 miles from the beach and minutes to local shopping, dining and golf. With a variety of home styles allowed, including singlewide, doublewide, modular or site-built, you can finally build the home you want with the freedom to personalize it to your needs and style. Say goodbye to HOA restrictions and hello to endless outdoor living possibilities. Don't miss out on the opportunity to make this wonderful property yours today!
-
2023-04-05status Pending 501-char remark
Show marketing remark (501 chars)
Take a look at this 0.32-acre lot in Ridge Forest! This property is just 4 miles from the beach and minutes to local shopping, dining and golf. With a variety of home styles allowed, including singlewide, doublewide, modular or site-built, you can finally build the home you want with the freedom to personalize it to your needs and style. Say goodbye to HOA restrictions and hello to endless outdoor living possibilities. Don't miss out on the opportunity to make this wonderful property yours today!
-
2023-04-05$32,500 Active 501-char remark
Show marketing remark (501 chars)
Take a look at this 0.32-acre lot in Ridge Forest! This property is just 4 miles from the beach and minutes to local shopping, dining and golf. With a variety of home styles allowed, including singlewide, doublewide, modular or site-built, you can finally build the home you want with the freedom to personalize it to your needs and style. Say goodbye to HOA restrictions and hello to endless outdoor living possibilities. Don't miss out on the opportunity to make this wonderful property yours today!
-
2021-02-18soldstatus $135,000
-
2005-03-28soldstatus $520,000
ⓘ Source: listings_history table (triggers on properties + properties_extension) + one-shot
backfill from property_details.listing_events for pre-trigger history.
Tax reassessment forecast NC · Resets to sale price
- Current annual tax
- $692 · $58/mo
- Projected year-2 tax
- $1,434 · $120/mo
- Expected delta
- +$742/yr (+$62/mo · 107.3%)
ⓘ Screening estimate from a state-policy table — verify with the county assessor before closing.
Climate risk First Street
- Flood 3/10 Moderate FEMA zone X (unshaded) · 10% chance over 30 yrs
- Wildfire 5/10 Major
- Heat 9/10 Extreme 7 d/yr ≥104°F today · 19 d/yr by 30 yrs out
- Wind 8/10 Severe 99% chance of damaging wind over 30 yrs
- Air quality 2/10 Low 1 unhealthy d/yr today · 1 by 30 yrs out
Nearby sold comps map
Loading sold comps map…
Walkable amenities ~0.75 mi
Loading nearby amenities…
Taxation est. · year 1
- Rental income
- $24,183
- − Mortgage interest
- −$9,797
- − Property taxes
- −$692
- − Insurance
- −$874
- − Repairs & maintenance
- −$1,935
- − Management
- −$1,935
- − Depreciation
- −$5,088
- Taxable income
- $3,862
- Est. tax owed @ 24.0%
- −$927
- After-tax cash flow
- $5,605/yr
For passive investors: Depreciation is non-cash, so a rental often shows a tax loss while cash-flowing — sheltering income. Rental losses are passive: they offset passive income freely, and up to $25,000/yr can offset ordinary (W-2) income if you actively participate and your MAGI is under $100k (phasing out to $0 by $150k); unused losses carry forward. On sale, claimed depreciation is recaptured at up to 25%, and gains may owe capital-gains tax (a 1031 exchange can defer both). Figures are a year-1 estimate at your 24.0% rate — not tax advice; consult a CPA.
Schools (NCES district)
- District
- Brunswick County Schools
- NCES district ID
- 3700420
- Math proficiency
- 45% ▲ 4.00%
- Reading proficiency
- 47% ▲ 4.00%
- Median HH income
- $47,494
- Composite
- 39.23/100
- National rank
- #4011
- State rank
- #82 of 178 in NC
Livability — Holden Beach
- Score
- 65/100
- State rank
- #334
- US rank
- #13586
Category grades
Schools grade is shown separately in the Schools card above.
Census & demographics
- County
- Brunswick County · 131,536 people
- Metro
- Myrtle Beach-Conway-North Myrtle Beach, SC-NC
- Population (ZIP)
- 12,340
- Household income
- $60,349
- Rent vs Own
- Severe rent burden
- 269.0
Population outlook (Brunswick County) Hauer SSP2
- Today (2025)
- 152,111 people
- By 2030
- 165,705 · +8.9%
- By 2040
- 188,494 · +23.9%
- By 2050
- 206,228 · +35.6%
- By 2075
- 237,876 · +56.4%
- By 2100
- 251,451 · +65.3%
Race, ethnicity, and origin ACS 2023
- Neighborhood character
- Predominantly White (87%)
- Race & ethnicity
- White 87% Black 7% Two or more races 5% Hispanic / Latino 2%
- Common ancestry
- Slovak 4% Lithuanian 4% Serbian 2%
- Foreign-born
- 1% · Canada
- Languages at home
- 99% English-only · Spanish 1%
Political lean MEDSL · Brunswick
- 2024 margin
- Strong R (+24.9) · D 37.2% · R 62.0%
- 2008→2024 swing
- -6.9pp toward R · 2008: -17.9pp · 2024: -24.9pp
- All cycles
- 2024: R+24.9 2020: R+25.0 2016: R+28.7 2012: R+22.2 2008: R+17.9
Not yet ingested
- Civics
- —
Market trends
- HPI YoY
- ▼ -259.44%
- Current HPI
- 144.2462
- Rent YoY
- —
- Metro
- Myrtle Beach-Conway-North Myrtle Beach, SC-NC
- State GDP YoY
- ▲ 3.28%
- F500 in state
- 26
Industry mix (Fortune 500 HQ in NC)
| Industry | F500 HQs | Revenue |
|---|---|---|
| Financial Services | 2 | $213B |
|
||
| Retail | 2 | $95B |
|
||
| Industrial Conglomerate | 1 | $38B |
|
||
| Metals / Steel | 1 | $35B |
|
||
| Utilities | 1 | $30B |
|
||
| Industrial Machinery | 1 | $19B |
|
||
Price history
-66.4% since first listed14 events — show timeline
- 2026-04-27 Price Changed $174,900 Hive MLS
- 2026-01-09 Price Changed $175,900 Hive MLS
- 2026-01-09 Listed $174,900 Hive MLS
- 2025-10-23 Price Changed $179,500 Hive MLS
- 2025-07-24 Relisted — Hive MLS
- 2025-07-02 Pending — Hive MLS
- 2025-07-02 Listing Removed — Hive MLS
- 2025-06-27 Listed $184,900 Hive MLS
- 2025-05-28 Coming Soon — Hive MLS
- 2023-06-22 Sold (MLS) $32,500 Hive MLS
- 2023-04-05 Pending — Hive MLS
- 2023-04-05 Listed $32,500 Hive MLS
- 2021-02-18 Sold (Public Records) $135,000 Public Records
- 2005-03-28 Sold (Public Records) $520,000 Public Records
Property tax history
+31.7%/yrLatest (2025): $692 · +2.1% YoY. Source: county tax records.
Cash-flow waterfall
monthlySold comps — $/sqft
last 12 mo · ≤1 miLoading sold comps…